![]()
Monthly Performance
In June of 1998, the Central Florida area experienced a record heat wave and drought which touched off numerous wildfires. Lakeland, Florida, where our demonstration project is located, is only about thirty miles east of Tampa. The Tampa National Weather Service office reported that the average June '98 Tampa temperature was an all-time record high, for any month in any year! How much hotter was it than normal? Plenty-- the official numbers:
| Average | June 1998 | June 1997 | Relation to Thirty Year Normal |
| Daily Temp. | 85.6°F | 81.8°F | June '98 temp. is 4.3oF above normal 30 year |
| Daily Max. | 93.0°F | 89.7°F | June '98 temp. is 3.5oF above normal 30 year |
| Daily Min. | 78.1°F | 73.8°F | June '98 temp. is 5.2oF above normal 30 year |
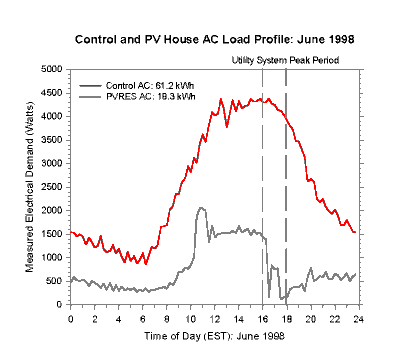
The AC load profile (below) shows the average AC electric demand in the two homes over the entire month. The "load shift" related increase in the PVRES home (thermostat goes down from 76o to 74o) at 11 AM is noticeable, as is the drop in load at 5 PM. The total average cooling energy use in the unoccupied Control home is 61 kWh a day ($4.90). Even with the internal heat from appliances and occupant the measured cooling was only 18 kWh ($1.40) a day in the occupied PVRES house-- a reduction of 70%. When total power from the occupied PVRES home is considered (30.3 kWh/day), it still uses only 50% of the air conditioning of the Control.
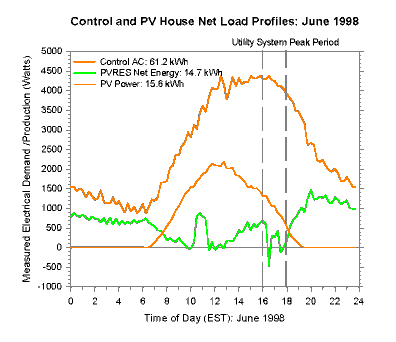
The net load profile (below) shows the average daily AC electric consumption (61 kWh/day) at the Control house compares with the PV electric power production (15.6 kWh/day) at the PVRES home over the entire month. The green line shows the PVRES Net power demand (Total electric load - PV power to the grid). Note that the late afternoon PV electric production was sufficient to approximately zero out the total PVRES electric demand during the peak hours between 4 and 6 PM EST (5 and 7 PM EDT). The total daily net power total draw of the PVRES home is only 24% of that of air conditioning alone at the Control.


