

Reference Publication: Parker, D., Fairey, P., McCluney, R., Gueymard, C., Stedman, T., McIlvaine, J., "Rebuilding For Efficiency: Improving the Energy Use of Reconstructed Residences in South Florida", Prepared for U.S. Department of Energy, Florida Energy Office, and Florida Power & Light Company, FSEC-CR-562-92, December 1992. Disclaimer: The views and opinions expressed in this article are solely those of the authors and are not intended to represent the views and opinions of the Florida Solar Energy Center. |
REBUILDING
FOR EFFICIENCY:
Improving the Energy Use of Reconstructed
Residences in South Florida
Appendix
E
Reflective Roof Research at FSEC
Background Information
- Florida
Solar Energy Center (FSEC), began testing various residential roof
finishes on small scale roof models in January of 1991. The tests
were designed to determine the difference in heat build-up at the
roof substrate.’
Results compared various clay and concrete tile scenarios with white and darklgray shingles. Gray shingles painted with a white elastomeric coating (Flex-Tech in Sarasota, FL) were also included in the test and were found to perform very well.2
The shingles painted with the elastomeric coating registered a sub-strate temperature about 50°F lower than the uncoated gray shingle and about 40°F lower than the white shingle.
- Based on
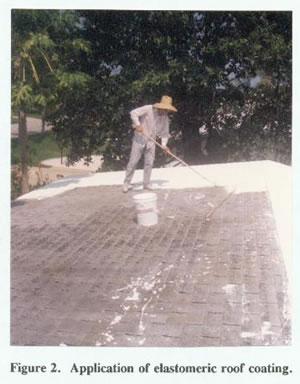
these findings, two full-size houses in Cocoa Beach, Florida were retrofitted
with white elastomeric coating over shingles.
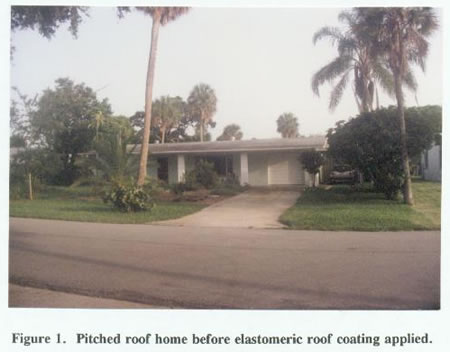
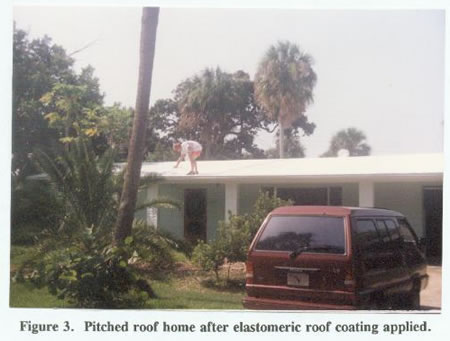
Residence 1: pitched, gray shingle roof over plywood decking and R-19 ceiling insulation (Figures 1-4).
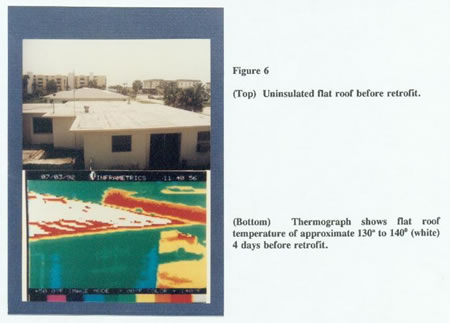
Residence 2: flat, tar paper roof and no ceiling insulation (Figure 6).
Prior to the retrofit, the two houses were monitored for one month. The air conditioning load of each house was measured every 15 minutes. The thermostats were left on a constant settings. After the retrofit was done on July 7, 1992 and the houses were monitored for another month (Figure 7).
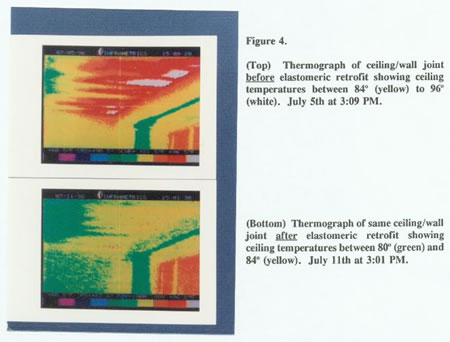
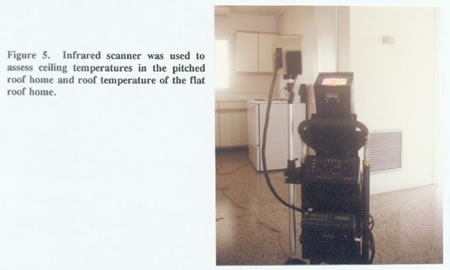
- An infra-red scanner (Figure 6), used to evaluate changes in heat gain, revealed greatly reduced heat flux from the attic in the home with the pitched roof (Figure 4).
Preliminiry Results
- The
measured roof solar reflectance in both homes changed from about
20% to 70% after the coating was applied.
- Comfort
increased significantly in the flat-roofed home without ceiling insulation.
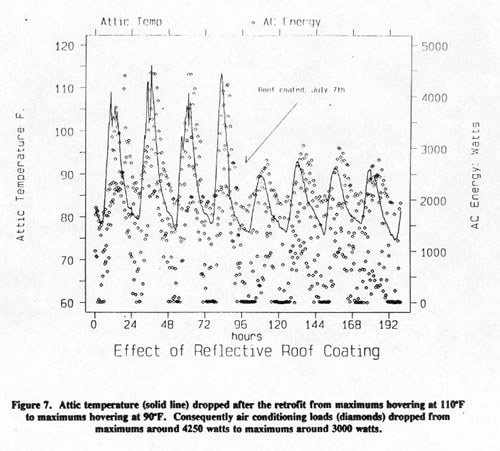
- Maximum
attic temperatures under the pitched roof dropped by at least 15°F.
This potentially has a substantial impact on heat transfer to duct work
located in attics, particularly if the duct work has any supply or return
leaks.
- Residence
1: Measured air conditioning consumption was reduced by over 20%.
Figure 7 shows A/C energy consumption on the vertical-axis and day
of experiment on the horizontal-axis. Attic temperatures are shown
by the solid line; the diamonds show the 15-minute recorded electrical
demand. The graph shows an eight day period of the two month monitoring
(four days before the retrofit and four days after). Seventy-two to
ninety-six represents the last 24-hour period before the retrofit and
96 to 120 represents the first day after the retrofit.
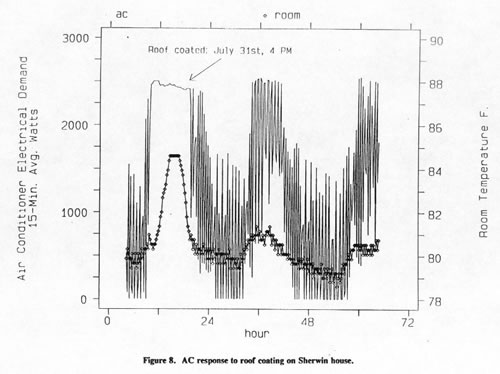
- Residence
2: Figure 8 shows the reduction to air conditioning energy and
improved interior comfort in the coated flat-roofed home. A 72-hour
period during which the coating was applied is plotted. Before the
roof is coated on July 31st, the 2.5-ton air conditioner runs constantly
each summer day from 11 AM - 8 PM. After the coating, the air conditioner
cycles on and off producing energy savings with greatly improved interior
comfort conditions.
- Results verify findings of other researchers.
FLORIDA
SOLAR ENERGY CENTER
DSET Report No.: 4043203.01O
DSET No.: 40432
Date: September 3, 1992
Hemispherical Spectral Reflectrance Test Report
3.0 Observations, Deviations, and Waivers:
The measurements were made with the uncoded side of the specimens to the source.
The disparity at 350 and 400 nm in the spectral reflectance charts is attributed to normal pen response coupled with an automatic filter change in the Beckman 5240 Spectrophotometer. This disparity generally occurs only in regions of rapid change in percent transmittance.
4.0 Results
Specimen
Code |
%
Reflectance |
%
Absorptance |
||||||
Solar |
UV |
VIS |
NIR |
Solar |
UV |
VIS |
NIR |
|
| Aged Elastomeric | 72.7 |
17.4 |
78.5 |
73.1 |
27.3 |
82.6 |
21.5 |
26.9 |
| Cement Tile | 24.8 |
9.7 |
18.1 |
32.8 |
75.2 |
90.3 |
81.9 |
67.2 |
| Lo Mit | 54.1 |
50.9 |
53.3 |
55.2 |
45.9 |
49.1 |
46.7 |
44.8 |
| Grey Shingle | 21.7 |
10.1 |
23.1 |
21.7 |
78.3 |
89.9 |
76.9 |
78.3 |
| White Shingle Flex-tec Elastomeric | 65.0 |
14.1 |
69.4 |
66.3 |
35.0 |
85.9 |
30.6 |
33.7 |
FLORIDA SOLAR ENERGY CENTER
DSET Report No.: 4043203.01O
DSET No.: 40432
Date: September 3, 1992
Total Emittance Test Report
4.0 Results
| Specimen Code | Reflectance
Measured |
Emittance
Calculated |
| Aged Elastomeric | .14 |
.86 |
| Cement Tile | .10 |
.90 |
| Lo Mit | .58 |
.42 |
| Grey Shingle | .09 |
.91 |
| White Shingle Flex-tec Elastomeric | .11 |
.89 |
FLORIDA SOLAR ENERGY CENTER
DSET Report No.: 4043203.01O
DSET No.: 40432
Date: September 8, 1992
Directional
Hemispherical Solar
Reflectance Test Report
4.0 Results
Date
of Test: September 8, 1992
Start Time: 11:00 MST
Finish Time: 11:35 MST
Specimen |
%
Reflectance |
| Built-Up with Gravel | 30.6 |
| Smooth Built-Up | 5.9 |
| Gray EPDM | 23.0 |
| White EPDM | 66.2 |
| Black EPDM | 6.0 |
FLORIDA SOLAR ENERGY CENTER
DSET Report No.: 4043203.01O
DSET No.: 40432
Date: August 4, 1992
Hemispherical Spectral Reflectance Test Report
4.0 Results
Specimen
Code |
%
Reflectance |
%
Absorptance |
||||||
Solar |
UV |
VIS |
NIR |
Solar |
UV |
VIS |
NIR |
|
| Galvanized | 71.3 |
75.0 |
74.0 |
68.7 |
28.7 |
25.0 |
26.0 |
31.3 |
| Aluminum | 60.9 |
29.3 |
49.4 |
73.5 |
39.1 |
70.7 |
50.6 |
26.5 |
| Grey EPDM | 23.1 |
13.5 |
27.2 |
20.2 |
76.9 |
86.5 |
72.8 |
79.8 |
| White EPDM | 68.7 |
16.7 |
68.3 |
75.0 |
31.3 |
83.3 |
31.7 |
25.0 |
| Black EPDM | 6.2 |
6.7 |
6.4 |
6.0 |
93.8 |
93.3 |
93.6 |
94.0 |
| Hypalon | 75.5 |
17.3 |
81.2 |
76.4 |
24.5 |
82.7 |
18.8 |
23.6 |
| T-EPDM | 80.6 |
16.7 |
88.7 |
79.8 |
19.4 |
83.3 |
11.3 |
20.2 |
| Smooth Bitumen | 5.8 |
4.2 |
5.2 |
6.6 |
94.2 |
95.8 |
94.8 |
93.4 |
| Granular Surface Bitumen | 25.8 |
9.3 |
28.4 |
25.0 |
74.2 |
90.7 |
71.6 |
75.0 |
| Black Shingles | 5.0 |
4.6 |
5.3 |
4.8 |
95.0 |
95.4 |
94.7 |
95.2 |
| White Fiberglass Shingles | 25.3 |
9.9 |
27.0 |
25.2 |
74.7 |
90.1 |
73.0 |
74.8 |
FLORIDA SOLAR ENERGY CENTER
DSET Report No.: 4043203.01O
DSET No.: 40432
Date: August 3, 1992
Total Emittance Test Report
3.0 Observations, Deviations, and Waivers
All measurements were performed on the uncoded surface. The values reported represent the average of at least five measurements.
4.0 Results
| Specimen Code | Reflectance
Measured |
Emittance
Calculated |
| Galvanized | .96 |
.04 |
| Aluminum | .75 |
.25 |
| Grey EPDM | .13 |
.87 |
| White EPDM | .13 |
.87 |
| Black EPDM | .14 |
.86 |
| Hypalon | .09 |
.91 |
| T-EPDM | .08 |
.92 |
| Smooth Bitumen | .14 |
.86 |
| Granular Surface Bitumen | .08 |
.92 |
| Black Shingles | .09 |
.91 |
| White Fiberglass Shingles | .09 |
.91 |
| Smooth Built-Up | .09 |
.91 |
MEMORANDUM
Date: November,
1, 1991
To: Subrato Chandra, Jim Cummings, Bob Abernathy, Danny Parker
From: Jody Cummings
Subject: Measured solar absorptances of IHP surfaces
_________________________________________________________________________
On September 19, Jim Cummings and Bob Abernathy measured the solar absorptances of the IHP model roof structures and the IHP prototype walls using a PSP (serial #14392). The results of these tests are:
| Dark grey shingle model roof | a
= .88 |
| Single
batten red concrete tile model roof |
a
= .86 |
| Red metal model roof | a
= .79 |
| Elastomeric coated model roof | a
= .41 |
| Ceramic coated model roof | a
= .41 |
| Base prototype wall | a
= .36 |
| Dome prototype wall | a
= .41 |
| Dow prototype wall | a
= .41 |
| IHP cement slab | a
= .71 |
| Ceramic
coating (different manufacturer) Cummings house roof |
a
= .27 |
These measurements may overestimate the absorptance of the ceramic and elastomeric coated model roofs because a fraction of the roof surface is shaded by the PSP and beacase the small area of the model roofs cannot fill the full field of view of the PSP. The true values for the white coated model roofs may be closer to the measured value of .27 for the Cummings house roof. Jim suggested that measurements of larger surfaces with similar white coatings should be done.
© 2007-2014 University of Central Florida. The Florida Solar Energy Center (FSEC)
is a research institute of the
University of Central Florida.
For more information about FSEC, please contact us or learn more about us.
Find us on Facebook!