

![]()
 End-Use Monitoring
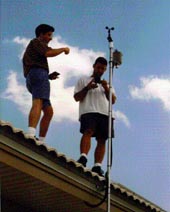
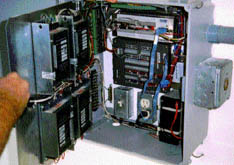
In April of 1998, both the PVRES home and the control site were fully instrumented with a Campbell Scientific CR10 data logger to both measure weather and thermal conditions as well as total electrical load and to isolate each of the major end-use loads. The photo below shows the enclosure logger during installation and wiring. The data logger itself is the small silver box at the top of the enclosure; the large flat wiring panel below the data logger is the AM416 multiplexer which allows the collection of the large number of analog measurements necessary in the project. A SW8A pulse count board (top of the enclosure) allows storage of the numerous switch-closure measurements on site. The series of boxes on the swing door are the individual Ohio Semitronics watt-hour transducers that measure the power consumption of the various appliances. Each of the following electrical end-uses were individually metered:
-
Total electricity
-
Air conditioner
-
Air handler
-
Hot water
-
Refrigerator
-
Range
-
Dryer
-
Washer
 Miscellaneous loads, including lighting and ceiling fan use
are tracked by subtracting the major electrical end uses from total. Thus,
if lighting loads were altered, the differences in the estimated miscellaneous
loads could be used to estimate lighting energy savings based on a pre and
post retrofit monitoring protocol.
Miscellaneous loads, including lighting and ceiling fan use
are tracked by subtracting the major electrical end uses from total. Thus,
if lighting loads were altered, the differences in the estimated miscellaneous
loads could be used to estimate lighting energy savings based on a pre and
post retrofit monitoring protocol.
In addition, a weather tower was installed to obtain data on ambient air temperature, relative humidity and solar irradiance. Wind speed is obtained by an RM Young anemometer; solar irradiance is obtained from Li-cor silicon cell pyranometers. Ambient and indoor relative humidities are taken by Vaisala hygrometers. Temperatures were taken in a variety of locations throughout both homes to characterize thermal performance.
All temperatures are taken with Type-T thermocouples (0.1F accuracy):
-
Ambient air temperature
-
Roof surface temperature
-
Decking surface temperature
-
Attic air temperature
-
Interior air temperature by thermostat
-
Return air temperature (just before the coil)
-
Supply air temperature (just after the coil)
-
Supply air temperature at closest register
-
Supply air temperature at far register
-
Slab temperature (2" depth)
-
Garage temperature
-
Cold water line inlet temperature
The temperatures taken before and after the air conditioner coil allow characterization of cooling system performance; the temperatures taken at the near and far registers should allow assessment of heat gains to the duct system in the Control home. Other unique information is taken at the PVRES home to characterize the PV system performance:
-
Array plane solar irradiance (south)
-
Array plane solar irradiance (west)
-
Array center temperature
-
PV DC output voltage
-
PV DC output amps
-
AC inverter output Watts
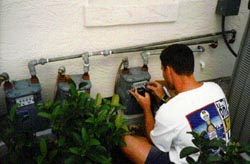 Also, the PVRES home has propane used for its range, dryer,
a fireplace and back-up for the water heating system. The consumption
of the individual propane appliances is recorded by signals sent from
the data logger by pulse-initiating AC-250 propane meters graciously provided
by the American
Meter Company.
Also, the PVRES home has propane used for its range, dryer,
a fireplace and back-up for the water heating system. The consumption
of the individual propane appliances is recorded by signals sent from
the data logger by pulse-initiating AC-250 propane meters graciously provided
by the American
Meter Company.
All of the data channels in both houses are scanned every ten seconds with integrated averages output to storage each 15-minutes. The resulting data is then sent to FSEC over dedicated telephone lines each evening. Detailed plots are created for each day of the monitoring project. See the updates this month for the PV system and the thermal performance monitoring to see samples of what is being recorded. Eventually, we'll have all this up on our website so you can review the previous day's data yourself.
© 2007-2014 University of Central Florida. The Florida Solar Energy Center (FSEC)
is a research institute of the
University of Central Florida.
For more information about FSEC, please contact us or learn more about us.
Find us on Facebook!