

Reference Publication: Schrum, L., Parker, D., "Daylighting Dimming and Energy Savings: The Effects of Window Orientation and Blinds," Presented at The 1996 ASME International Solar Energy Conference, San Antonio, TX, April 1-3, 1996. Disclaimer: The views and opinions expressed in this article are solely those of the authors and are not intended to represent the views and opinions of the Florida Solar Energy Center. |
Daylighting Dimming and Energy Savings: The Effects of Window Orientation and Blinds
Florida Solar Energy Center (FSEC)
FSEC-PF-305-96
Abstract
The Daylighting Test Facility (DTF) located at Florida Solar Energy
Center, was used to study daylight dimming systems and how orientation
and blinds effect energy savings.
To evaluate the impact of blinds on dimming savings, the energy consumption
was compared in two pairs of offices for all four window orientations: north,
south, east and west. One office in each pair had blinds in a fixed position
(down and open) and the other office had no blinds.
From September through December of 1994, data were collected on the north- and south-facing offices. The DTF was rotated 90 degrees and data were collected from January through April for east- and west-facing offices. The DTF was also modeled on DOE2.1 and the predicted energy usage was compared to the actual data.
The study showed that daylight dimming systems can provide significant energy savings. Energy savings ranged from 24% to 51% depending on the orientation and whether the office had blinds. The research suggest adjustments to parameters used with the DOE2.1 daylighting model to improve the accuracy of its predictions.
Introduction
Until 1900, most buildings were "day lit" in the sense that daylight was the major source of daytime illumination. Due to the electricity use and increased cooling load that is created by electric lighting, there is a renewed interest in daylighting commercial buildings. Numerous theoretical studies have shown significant potential for energy savings in day lit buildings [1]. In order for a day lit building to realize energy savings, the electric lighting system must be manually switched in an effective fashion or else be linked to some type of integrated control system. The shortcomings of reliance on manual control are extensively documented in the literature [2]. A study by Hunt and Cockram [3] showed that continually occupied offices experienced little manual switching during occupancy. Most of the switching was at the start and the end of the work day. Thus, reliable savings are likely only with automated controls.
One type of dynamic lighting control system available is the continuous dimming system which constantly adjusts the electric lighting level based on the amount of daylight available. A continuous dimming system consists of a photosensor that provides the control signal that is used by the dimming electronic ballast to vary the light level according to changes in daylight availability. These systems seem attractive since they reduce the use of electric light automatically without occupant intervention.
Significance of the Problem
Computer simulations such as DOE-2.1 and other programs [4] can be used to predict energy savings for such continuous dimming systems. However, these simulations do not accurately account for human behavior such as seasonal blind adjustment related to window orientation. The use of automatic daylight controls and potential energy savings has been studied [5], but the position of the blinds was not taken into account. Studies on window blind usage show that people use window blinds to block solar radiation (both as a source of localized overheating as well as glare) [6,7]. However, typically occupants did not change blind positions within a day. Preference for window blind position appears based on long-term perceptions of solar radiation or other factors. Other considerations such as privacy and security may be ancillary concerns.
Little data have been collected in situ to quantify the energy savings as a result of daylight dimming systems. Actual savings may vary dependent on the window orientation and window management strategies. A metered study conducted by Lawrence Berkeley Laboratory [8] showed the energy savings were less in the south day lit zone than in the north day lit zone due to the occupants using drapes to reduce glare and thermal discomfort on the south orientation. A National Bureau of Standards study [9] found that window area does not influence lighting load as strongly as the type of window system. A window system may include window coatings, external shading devices, and internal shading devices such as blinds.
However, preliminary data of an on-going study [10] in a Wisconsin commercial building showed that savings were greatest on the south side of the facility even though occupant manipulation of the window blinds did reduce savings. The building being monitored has windows on all four sides with a dimming system and blinds. During the winter, the amount of light entering through the east and south faces is so great that occupants often manipulate the blinds to reduce the heat, light, and glare. The report also states that many occupants on the north side often have their blinds fully raised to obtain an unrestricted view throughout the day.
The contrary results of the limited research performed so far underscores the need for a more rigorous evaluation of the effects of orientation on daylighting system performance. The purpose of this research is to monitor the electric lighting energy usage of eight offices with windows and a continuous dimming system.
Daylighting Test Facility
Test Site Description
The test site, the Daylighting Test Facility (DTF), is located at the Florida Solar Energy Center, Cape Canaveral, Florida (latitude 28o, longitude 80o). Eight offices are located within the test site. The offices vary in size, number of windows and window orientation as shown in Table 1.
Table 1
| Window Orientation | ||||
Office |
Dimensions |
# of Windows |
Phase I |
Phase II |
A |
3.4 m x 4.0 m (11' x 13') |
2 |
North and east |
West and north |
B |
3.4 m x 4.0 m (11'3" x 13') |
2 |
South and east |
East and north |
C |
2.2 m x 2.9 m (7'1"' x 9'7") |
1 |
South |
East |
D |
2.2 m x 2.9 m (7'1" x 9'7") |
1 |
South |
East |
E |
3.4 m x 4.3 m (11'3" x 14') |
2 |
Both south |
Both East |
F |
3.4 m x 4.3 m (11' x 14') |
2 |
Both north |
Both West |
G |
2.3 m x 2.7 m (7'9" x 9') |
1 |
North |
West |
H |
2.3 m x 2.7 m (7'9" x 9') |
1 |
North |
West |
All windows are 0.84 m x 0.71 m (2'9" x 2'4") located 1.2m (4') from floor to a ceiling height of 2.3 m (7'9"). The trailer can be rotated so that the north- and south-facing windows become east- and west-facing windows. The floor plan of the test site is shown in Figure 1. Figure 2 shows an exterior view of the facility.
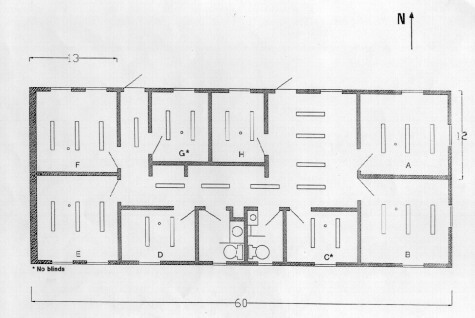
Figure 1. Floor plan of the Daylighting Test Facility (DTF) in Phase
I. In Phase II the orientation is rotated 90o.
The offices contain work desks and other furnishings germane to the typical office environment. Each office has a video display terminal; visual tasks include reading, writing, drafting, and typing. Figure 3 shows an interior view of Office "F".
The interior floor surface is brown carpet with an approximate reflectance of 0.20. The four interior walls are beige and have a reflectance of 0.45. The ceiling is finished off-white with a reflectance of 0.70. The exterior surface on the sides of the trailer is grass with no obstructions.
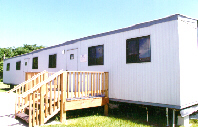
Figure 2. The Daylighting Test Facility (DTF) was used
to collect data on offices
with windows, blinds, and daylight dimming
ballasts.
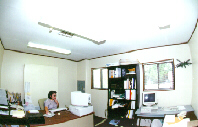
Figure 3. Interior of an office at the DTF where daylight dimming was studied. The office has north facing windows.
The windows consist of double pane clear glass 1/8" thick with a light gray tint. The measured visible transmittance of the single pane windows is 0.67. Each window has one-inch mini-blinds that are white and have a reflectance of ~0.70. The blinds remained fixed to eliminate occupant related variation. The blinds remained down and the slats at 90 degrees. All offices have blinds except offices "C" and "G" which were intentionally left without blinds to examine their relative effect.
Electric Lighting System
Each office has two or three two-lamp ceiling-mounted wrap-around prismatic fluorescent luminaires. Two T-8 lamps (4100oK) and one Mark VII electronic ballast are used in each luminaire. Manufacturer's data suggest that the ballasts can be dimmed over a range from 100% to approximately 20% of full power. The luminaires are four feet on center and operate on 120 Vac.
Photosensors
The Wattstopper LightSaver LS30 is a ceiling mount, low voltage photocell which interfaces with Advance Mark VII and Motorola Helios electronic ballasts. The sensor is used to control the output of light based on the availability of natural light and on the required task illumination level. The photosensor has a Fresnel lens which allows the sensor to measure light levels uniform across a 60 degree field of view and provide a dimming range from 10% to 100%.
Instrumentation
Electrical Measurements
The lighting power and current to the four branch circuits serving the offices are individually monitored with Ohio Semitronics watt-hour transducers with a current transformer to supply the input. These transducers accurately measure true root mean square (RMS) power and current regardless of any current wave shape distortion. All the transducers are mounted in a central location in the trailer. The watt-hour transducers are factory calibrated with an accuracy of ± 1.0%.
Photometric Measurements
Light levels in the offices are monitored with Li-Cor Model 210S color- and cosine-corrected photometers. One photometer is mounted in each office at desktop height, two-thirds away from the window wall. The photometers were mounted directly below the ceiling-mounted ambient sensor used by the dimmable lighting system to control the electric light levels. Figure 1 shows the location of the sensors. Global horizontal insolation data are concurrently taken on a horizontal plane of the building using silicon cell pyranometers.
Data Acquisition
All measured values are recorded using a Campbell Scientific 21X Data Acquisition and Control Unit (12-bit precision). The datalogger scans all instrumentation every ten seconds with integrated averages output to storage on fifteen-minute intervals. Data is transferred daily from the DTF to FSEC's mainframe computer. Data are then archived and daily plots produced to describe system performance on the previous day. Figure 4 shows an illustration of a sample plot for October 13, 1994.
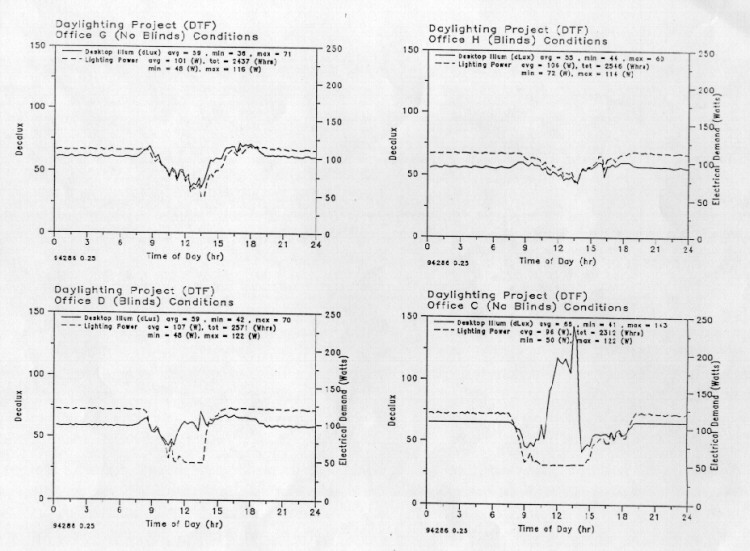
Figure 4. Daylighting Test Facility data for October 13, 1994.
Experimental Procedure
Data for the north and south-facing offices were collected for four months (September - December) to cover half the seasonal daylight availability cycle. At the end of this cycle, the trailer was rotated 90 degrees so that the windows are oriented east and west, respectively. This was accomplished on January 11, 1995. Data were collected for the east- and west-facing offices for four months (January-April).
Discussion of Measured Results
Illumination and power consumption data were taken between September 1 and December 31, 1994 for the north and south facing windows. The same data were taken between January 17 and May 16, 1995 for the east and west-facing windows. Data analysis concentrated on the hours of 6 AM and 6 PM since it is more expensive to supply and use energy during this time. This is also the most common period during which office lighting systems are used in commercial facilities.
The lighting system was powered 24 hours a day so that the percent energy reduction was calculated by using the nighttime data as the baseline. The nighttime monthly average wattage for each office was calculated by estimating the mean electrical demand between the hours of 10 PM and 6 AM. The average was multiplied by twelve to compare to the 12-hour daytime period. The total kWh was also plotted for each month between the hours of 6 AM and 6 PM. Table 2 shows the total monthly kWh data taken of the dimming system over the entire period from September 1, 1994 to December 31, 1994 for the four north and south-facing interior offices.
Table 3 shows the total monthly kWh data for the period from January 17 to May 16, 1995 for the four east and west-facing interior offices. The daytime data was divided by the baseline data to obtain the percent energy reduction. For the purposes of the analysis, these calculations assume that the lights would be on continuously between the hours of 6 AM and 6 PM.
Table 2
Monthly Lighting Energy Consumption For Four Offices
North-South Orientation
(Total kWh)
| MONTH | NORTH
NO BLINDS |
NORTH BLINDS | SOUTH
NO BLINDS |
SOUTH
BLINDS |
| September | 59 | 62 | 52 | 56 |
| October | 71 | 79 | 68 | 75 |
| November | 71 | 74 | 68 | 73 |
| December | 76 | 78 | 70 | 79 |
| Total | 278 | 293 | 259 | 283 |
Table 3
Monthly Lighting Energy Consumption For Four Offices
East-West Orientation
(Total kWh)
| MONTH | EAST
NO BLINDS |
EAST
BLINDS |
WEST
NO BLINDS |
WEST
BLINDS |
| January | 67 | 61 | 65 | 62 |
| February | 81 | 72 | 78 | 73 |
| March | 74 | 65 | 71 | 67 |
| April | 72 | 64 | 70 | 64 |
| Total | 255 | 304 | 278 | 270 |
Table 4 shows a summary of the percent energy reduction for the same period. Figure 5 is a graphical representation for these data.
Figure 5.
The energy reduction ranged from 24% - 45% depending on orientation and blind condition.The south-facing office with no blinds had the lowest power consumption over the test period with a 45% energy reduction for the period. The north-facing office with blinds had the highest power consumption with a 24% energy reduction. Blinds evidence a 7% effect on the energy savings for both orientations.
Table 4
Percent Energy Reduction*
North and South Offices
| September | October | November | December | Period Total | |
| North
No blinds |
42% | 30% | 30% | 21% | 31% |
| North Blinds | 35% | 19% | 25% | 18% | 24% |
| South
No blinds |
54% | 47% | 42% | 37% | 45% |
| South Blinds | 48% | 39% | 38% | 26% | 37% |
* Energy reduction is based on assuming the lights would have been
on continuously between the hours of 6 AM and 6 PM. The baseline
data was taken as an average of the system wattage between the hours
of 10 PM and 6 AM.
Table 5 shows a summary of the percent energy reduction for the east-west orientation during the period described. Figure 6 is a graphical representation of these data.
Figure 6.
The energy reduction ranged from 22% - 51% depending on the orientation and blind condition. The east-facing office with no blinds had the highest period energy reduction of 48%. For this orientation, blinds had a 18% effect on power consumption. The west-facing offices did not yield expected results. The office with blinds had a higher power consumption of 3%.
To verify the west-facing office data, the blind condition was switched. The blinds were removed from one west-facing office and installed in the control office (office without blinds). The data taken for one month from June 17 to July 17 showed an energy reduction of 44.9% for the office without blinds and 18% for the office with blinds. These results indicated that once the blind condition was switched, the blinds did make a significant difference of 26.8%. This data led researchers to believe that the dimming system was not working properly in the office without blinds during the four month test period. Since this data were taken during the summer solstice, it is expected that the energy reduction would be higher than the test period.
Table 5
Percent Energy Reduction*
East and West Offices
| MONTH | EAST
NO BLINDS |
EAST
BLINDS |
WEST
NO BLINDS |
WEST
BLINDS |
| January | 44% | 22% | 28% | 33% |
| February | 47% | 27% | 31% | 33% |
| March | 49% | 32% | 32% | 34% |
| April | 51% | 37% | 34% | 41% |
| Period Total | 48% | 30% | 31% | 35% |
* Energy reduction is based on assuming the lights would have been on continuously between the hours of 6 AM and 6 PM. The baseline data was taken as an average of the system wattage between the hours of 10 PM and 6 AM.
Simulation Analysis
The facility was modeled using DOE-2.1E and compared to the field data. DOE-2.1 is a building loads simulation program that evaluates energy use, peak loads, and energy cost. DOE-2.1 allows the user to predict the impact of daylighting on electric lighting energy consumption.
The DOE-2.1 daylighting calculation simulates control of lighting fixtures in response to the level of natural lighting from the sun, sky, and reflection off the inside surfaces of the space. Input parameters include window size and orientation, glass transmittance, inside surface reflectance of the space, sun-control devices such as blinds and overhangs, and the luminance distribution of the sky. Continuously dimming control systems and window shade management can be modeled.
The eight offices were modeled in the north-south orientation. Parameters that effect the daylighting calculations include window visible transmittance, blind transmittance, blind schedule, window location in the wall and orientation. The window visible transmittance was measured at 0.67. DOE-2.1 recommends a blind visible transmittance value of 0.18 - 0.23 depending on the type of blind. The blind visible transmittance used in the simulation was 0.23. The blind schedule relates the blind position throughout the day and year on an hourly basis. DOE-2.1 recommends a value of 0.0 - 1.0 depending on the position of the blind and the slats. A value of 0.0 indicates the blind is down with the slats closed and 1.0 is a blind completely up and open. Since the blinds were fixed, the blind schedule was set at 0.5 for the simulation period. A value of 0.5 indicates that the blinds are down and the slats are open 90 degrees.
This input file was run for the north-south orientation with a building azimuth of 0 degrees. To simulate the east-west orientation the building azimuth was changed to 270 degrees.
The kWh usage for the offices which was predicted by DOE-2.1 was compared to the actual DTF data. Table 6 and Table 7 shows a comparison of the data. Except for the south, east, and west-facing office with no blinds, DOE-2.1 predicted higher kWh usage for all other configurations. The implication is that the measured dimming exceeds that predicted for offices with blinds. As a result of this analysis, it was concluded that the blind schedule and the visible transmission of the blinds are important parameters that effect the predicted power consumption.
Table 6
DTF/DOE kWh Data Comparison
North-South Orientation
| MONTH | NORTH
NO BLINDS |
NORTH
BLINDS |
SOUTH
NO BLINDS |
SOUTH
BLINDS |
||||
| DTF | DOE | DTF | DOE | DTF | DOE | DTF | DOE | |
| September | 59.2 | 65.9 | 62.3 | 84.4 | 52.4 | 60.8 | 56.4 | 78 |
| October | 71.1 | 74.7 | 79 | 88.7 | 68.4 | 64.4 | 75.5 | 78 |
| November | 71.3 | 77.2 | 74.1 | 86.8 | 68 | 63.4 | 72.8 | 74.1 |
| December | 76.2 | 80.7 | 77.6 | 90 | 69.9 | 68.1 | 78.5 | 78.7 |
| Total | 277.9 | 298.5 | 293 | 349.9 | 258.6 | 256.6 | 283 | 308.8 |
| %Difference DTF\DOE | + 6.8 % | + 16.3 % | - .8 % | + 8.3 % | ||||
Table 7
DTF/DOE kWh Data Comparison
East-West Orientation
| MONTH | EAST
NO BLINDS |
EAST
BLINDS |
WEST
NO BLINDS |
WEST
BLINDS |
||||
| DTF | DOE | DTF | DOE | DTF | DOE | DTF | DOE | |
| January | 66.8 | 65.9 | 60.5 | 57.4 | 65.3 | 61.5 | 62.2 | 58.6 |
| February | 81.1 | 78.1 | 71.9 | 71.1 | 78.0 | 79.4 | 72.7 | 78.4 |
| March | 74.1 | 77.5 | 65.4 | 64.8 | 70.8 | 66.9 | 67.1 | 59.4 |
| April | 71.6 | 89.4 | 64.0 | 79.6 | 70.1 | 86.8 | 63.5 | 82.7 |
| Total | 255.1 | 243.4 | 304.2 | 307.9 | 277.8 | 268.6 | 283.2 | 338.5 |
| % Difference DTF/DOE | -4.6 | +0.9 | -3.3 | +20.3 | ||||
Summary
The study shows that daylight dimming systems can provide significant energy savings. Energy savings ranged from 22% to 51% depending on the orientation and whether the office had blinds. The east-facing office with no blinds had the highest energy reduction of 51%. The east-facing office with blinds had the lowest monthly energy reduction of 22%. Although the blinds were fixed, they had a 7% average reduction on the energy savings for both the north and south-facing offices. The east-facing offices had an 18% blind effect. The data taken one month after the blind condition was switched in the west-facing offices indicate the energy reduction may be similar to the east-facing offices. We also learned from DOE-2.1 that parameters such as window and blind visible transmission and blind schedule can change the predicted energy consumption. In all interior offices with blinds and the north-facing no blind condition, DOE-2.1 overestimated the power consumption by as much as 20%. This indicates that DOE-2.1 estimates for daylight dimming system savings may be conservative for offices with blinds operated like those in our study.
Follow Up
A blind usage study will be conducted in a large facility on a statistically valid sample of offices to examine how occupants use their blinds related to window orientation and season. This empirical research may lead to the development of a blind usage multiplier for energy simulation programs such as DOE-2.1.
References
- Zonneveldt, L., Pernot, C.E.E., 1994. Energy Savings by Optimal Use of Daylight, CADDET Energy Efficiency Newsletter, No. 4/1994, pp.7-9.
- Hunt, D.R. G., 1979. The Use of Artificial Lighting in Relation to Daylight Levels and Occupancy, Building and Environment, Vol. 14, pp.21-33.
- Hunt, D.R.G. and Cockram, A. H., 1978. "Field Studies of the Use of Artificial Lighting in Offices", BRE current paper 47/78.
- Hunt, D.R.G., 1976, Simple Expression for Predicting Energy Savings from Photoelectric Control of Lighting, Lighting Research and Technology, Vol. 9, pp.93-102.
- Crisp, V.H.C., 1977. Energy Conservation in Buildings: A Preliminary Study of the Use of Automatic Control of Artificial Lighting, Lighting Research and Technology, Vol. 9, No. 1, pp. 31-41.
- Rea, M.S., Window Blind Occlusion: a Pilot Study, Building and Environment, Vol. 19, No.2, pp. 133-137.
- Rubin, A.I., Collins, B.L., Tibbott, R.L., 1987. Window Blinds as a Potential Energy Saver - A Case Study, National Bureau of Standards, Washington, DC, NBS Building Science Series 112.
- Rubinstein, F., 1991. Automatic Lighting Controls Demonstration: Long-term Results, LBL-28793 Rev. UC350, Lawrence Berkeley Laboratory, University of California, Berkeley, CA.
- Treado, S. and Kusuda, T., 1980. Daylighting, Window Management Systems, and Lighting Controls, National Bureau of Standards, NBSIR 80-2147.
- Reed, J., et al., 1994. Energy Savings from an Active Daylighting Retrofit and Impact on Building Practices, American Council for an Energy-Efficient Economy 1994 Summer Study on Energy Efficiency in Buildings, Technology Research, Development and Evaluation Proceedings, Vol. 3, pp. 217-228.
Presented at:
1996 ASME International Solar Energy Conference
April 1-3, 1996
San Antonio, TX
© 2007-2014 University of Central Florida. The Florida Solar Energy Center (FSEC)
is a research institute of the
University of Central Florida.
For more information about FSEC, please contact us or learn more about us.
Find us on Facebook!