

Reference Publication: Cummings, J.B., C.R. Withers, N. Moyer, P. Fairey, B. McKendry, "Uncontrolled Air Flow in Non-Residential Buildings", Prepared for Florida Energy Office, Department of Community Affairs, FSEC-CR-878-96, March 29, 1996. Disclaimer: The views and opinions expressed in this article are solely those of the authors and are not intended to represent the views and opinions of the Florida Solar Energy Center. |
Uncontrolled Air Flow in Non-Residential Buildings
James
B. Cummings, Charles R. Withers, Neil Moyer,
Philip Fairey, and Bruce McKendry
Florida
Solar Energy Center (FSEC)
FSEC-CR-878-96
Download the full report (PDF, 44mb)
Acknowledgements
Funding for this project was provided by the Florida Energy
Office, Department of Community Affairs. We would like to thank Ed
Cobham and the other members of FEO staff for their continued support
of research into uncontrolled air flows in buildings.
We would also like to thank John Toth of FSEC who contributed considerable
time, energy, and talent to doing field testing, organizing our files,
and organizing our slides; and to Tom Hansen of Future Controls, our
Test and Balance expert, for his considerable help in deciphering complex
control systems and assisting us with various aspects of Test and Balance;
and to John Tooley of Natural Florida Retrofit for help in field testing
several buildings. Thanks to members of the advisory committee for giving
of their time and energy to participate in this project. Thanks to the
three paid consultant members of the advisory committee, Joe Lstiburek,
Terry Brennen, and Bill Turner, for contributing their expertise and
encouragement to our effort. Thanks to the following volunteer members
of the advisory committee for their considerable contributions to this
effort.
| Dennis Bradshaw - SMACNA | Neil Leslie - Gas Research Institute |
| Frank Colacino - Florida Power & Light Co. | John Masiello - Florida Power Corp. |
| Jack Davis - Florida Power Corp. | Bill Mixon - Oak Ridge National Lab |
| Larry Dennison - FACCA | Mark Modera - Lawrence Berkeley Lab |
| Rick Dixon - Dept. of Community Affairs | Davor Novasel - Gas Research Institute |
| Holly Duquette - Florida Power & Light Co. | David Odom - CM2H Hill |
| Tim Dyess - US EPA | Mike Philo - Florida Power & Light Co. |
| Randy Harris - City Gas | Trent Price - Fl. Dept. of Community Affairs |
| Esher Kweller - US DOE | David Rogers - Florida Gas Association |
| Bill Seaton - ASHRAE | Larry Stokely - Florida Energy Office |
| Terry Sharp - Oak Ridge National Lab | Bob Wasilewski - SMACNA |
1. Executive Summary
The objective of this study was to develop the capability
to substantially reduce energy use, building degradation and indoor
air pollution caused by uncontrolled air flow in nonresidential buildings.
For purposes of the study, “uncontrolled air flow” was
defined as air moving across the building envelope or between
zones or components of a building, where the pathways of flow, the
direction of flow, and the origin of the air are unknown, unspecified,
or unintended.
The study comes to three major conclusions as follows:
- Uncontrolled air flow is pervasive in buildings, often resulting in severe -- and sometimes even catastrophic -- consequences.
- Building practitioners lack the training, methods, and insight necessary to understand and avoid uncontrolled air flow in buildings.
- Given proper attention, problematic air flows in buildings can be virtually eliminated. Uncontrolled air flow can be avoided in new buildings, and repaired in existing buildings.
A major goal of this study has been to characterize the nature and
extent of uncontrolled air flow through testing, measurement and monitoring
in 70 small commercial buildings. Results showed that the nature of
uncontrolled air flows in these buildings varies widely, and is strongly
dependent on a large variety of complex building system interactions.
As to extent, the study found that uncontrolled air flow is ubiquitous.
Out of the 70 buildings studied, only one was deemed to be a “good” building.
Repairs were made on 20 of these buildings. Before and after monitoring
showed average energy savings of 15%.
Perhaps the most profound and compelling finding of the study is
that, given the present state of practice, whether a building
will avoid serious, or even catastrophic problems due to uncontrolled
air flow, is primarily a matter of ijk. Building practitioners
do not have access to information about uncontrolled air flow and its
potential consequences in buildings. Even the research community has
only recently “discovered” uncontrolled air flow, as evidenced
by the fact that this study is the first major research effort of its
kind. This study has found uncontrolled air flow to be surprisingly
complex, and the impacts and consequences to be quite well camouflaged.
Under these circumstances, it is not surprising that a good building
depends almost entirely on chance.
The salient characteristic of uncontrolled air flow that appears
most elusive is the fact that our buildings are functioning as pressure
vessels. Mechanical air distribution systems force air through not only “leaky” ducts,
but also through the various zones of this complex pressure vessel.
Because we cannot see the uncontrolled air flow that results, we normally
are not aware of it. As a result, forced air systems are typically treated
as discrete, separate systems that begin and end with the fans, blowers,
and duct systems. In actuality, the building is a complex series
of pressure vessels that connect together the two ends of the air handler
and duct systems, and are thus an integral part of them.
It appears that this lack of information on building air flows has
forced practitioners to accept things on faith. They are condemned to
the smart air syndrome -- the belief that the air is “smart’ enough
to flow where it is supposed to flow, which is only within the designated
ducts of the mechanical systems.
There is scant evidence from this study that the impacts of uncontrolled
air flows in buildings are understood or appreciated. Buildings are
designed and tested and balanced considering only the air flows at designated air
inlets and outlets of the duct systems. Even though duct systems have
been shown to be quite leaky, they are practically never tested for
tightness. The field evidence points to two ill-fated assumptions: 1)
the ducts will not leak, and 2) forced air flow begins and ends at the
designated termination points of the air handler’s duct systems.
Numerous examples that show the widespread existence of the smart
air syndrome are contained in the body of this report.
This study conclusively shows that duct systems normally leak, often
extensively. Given this fact, and the fact that the building acts as
a pressure vessel, it is clear that building pressure measurements are
the only accurate means of determining air flow balance in buildings.
The study concludes that building pressures must be measured under a
variety of building and mechanical system operating conditions in order
to accurately evaluate and understand the impacts of the forced air
flow in buildings. Air flow measurements alone are simply insufficient.
The extensive test and measurement data from the 70 small commercial
buildings studied here show that these buildings are considerably more “leaky” than
residences. The data also show that uncontrolled air flow is more pervasive
and more complex in these buildings than in residences. The data also
disclose a labyrinth of complex building system interactions that make
diagnostic generalizations virtually impossible. Almost any given diagnostic
result (for instance, the degree of supply duct leakage) can have an
enormous variety of impacts, depending quite literally on everything
else in the building. Simple generalizations and rules-of-thumb inevitably
have proven insufficient. Nonetheless, this study provides answers to
many previous questions. It also provides much needed insight, and discloses
an extensive array of additional gaps in our knowledge base. (See especially
Sections 4, 7 and 8 of this report.)
It has become clear from the study that more research and extensive
education and training are required before practitioners will be able
to successfully evaluate the impacts of these complex building system
interactions. One recommendation of this study is to transfer this “new” knowledge
to the building industry -- its researchers, its practitioners, and
its regulators. Section 7 of this report details the specific needs
in this area and recommends implementation strategies for proceeding
with this important task.
It has also become clear that, given the proper attention, most uncontrolled
airfiows and the problems they engender can be avoided. Section 6 of
this report provides extensive discussion on the characteristics of
a good building. It is now clear that a much improved set of “best
practices” for building design, construction, and commissioning
can be achieved. Extensive effort on the part of many individuals and
organizations will be necessary to widely effect such a standard in
our diverse building industry.
This study is important because uncontrolled air flows in buildings often have serious and sometimes catastrophic consequences. Increases in energy and demand costs may be the least critical of these. Often more critical and costly are the decreases in health and safety, building material durability, indoor air quality, indoor comfort, building moisture control, worker productivity, and business revenues that are experienced in problem buildings. Much too often, uncontrolled air flows cause massive building failures that result in dramatic remediation and litigation costs. In some cases, these costs have exceeded the original cost of constructing the building. Indoor air quality problems alone are estimated to result in tens of billions of dollars in unwanted costs annually in U.S. buildings.
The study presents strong evidence that many serious indoor air quality problems either arise directly from, or are exacerbated by, uncontrolled air flows in buildings. One of the important overall conclusions of this study can be concisely summarized as follows:
It is highly unlikely that indoor air quality
can be ensured in any building
unless the potential for uncontrolled air flow in that buildings
is eliminated.
In other words, if we can’t control the air flow, how can we expect to control the air quality?
In summary, virtually all uncontrolled air flows in buildings stem from one or more of the following three straightforward, building-system characteristics:
- Air flow pathways where there should be barriers.
- Air flow barriers where there should be pathways.
- Imbalances in the forced air flows between the inside and outside of the building.
The results of this study show that buildings do not have to be plagued by these unwanted air flow problems. Good buildings can be achieved.
2. Project Description
2.1 Introduction
“The overall objective of this project is to develop
the capability to substantially reduce energy use, building degradation,
and indoor air pollution caused by uncontrolled air flow in non-residential
buildings.” (Workplan: Uncontrolled Air Flow in Non-Residential
Buildings, February 4, 1993). The workplan goes on to say, “This
involves gaining knowledge of air flow and pressure differentials
in non-residential buildings, identifving tools and testing techniques
for research and diagnostic work, and developing recommendations
for dealing with uncontrolled air flow in non-residential buildings.”
Before proceeding, a definition of uncontrolled air flow is helpful.
Our working definition has been:
“Uncontrolled air flow - air moving across
a building envelope or between
zones or components of a building, where the pathways of flow, the
direction
of flow, and the origin of the air is unknown, unspecified, or unintended.”
Seventy small commercial buildings in central Florida were tested for
various types of uncontrolled air flow, including duct leakage, return
air imbalance problems, and exhaust air/intake air imbalance. These
buildings ranged in size from 704 square feet to 22,461 square feet,
and averaged 5030 square feet. Typical tests included building airtightness,
duct system airtightness, infiltration rates, and pressure differentials;
and air flow rates of supply, return, air handlers, exhaust fans, outdoor
air, and make-up air. This study concludes that uncontrolled air flow
is a serious and wide-spread problem that contributes to energy waste,
elevated peak electrical demand, high relative humidity, building materials
moisture degradation problems, mold and mildew growth, combustion safety
concerns, and indoor air quality complaints.
Uncontrolled air flow is a function of the intensity of drivers (primarily
mechanical air moving systems) and building complexity and tightness
(see section 2.2 for discussion of uncontrolled air flow potential).
Compared to residences, small commercial buildings have larger air flow
drivers because they have larger HVAC systems which run a greater proportion
of the time. Cooling systems are considerably larger, averaging 3.38
tons per 1000 square feet in these 70 buildings compared to 1.8 tons
per 1000 square feet in typical residences, and in some small commercial
buildings the air handlers run continuously. Exhaust fans are larger
and operate longer periods of time in commercial buildings. Additionally,
commercial buildings have outdoor air and make-up air which do not normally
exist in Florida residences.
Duct leakage, as measured by duct depressurization test, is three
times greater in commercial buildings than in Florida residences (area
normalized). Even considering that the cooling systems of commercial
buildings are nearly twice as large (in terms of tons of cooling capacity
per 1000 square feet), this duct leakage is considerably in excess of
duct leakage in Florida residences. According to SMACNA, these commercial
duct systems are approximately 70 times more leaky than the SMACNA duct
tightness standard. In Florida residences, duct leaks are almost always
to and from unconditioned spaces (attics, garages, reducing exhaust
air, and airtightening of leaky t-bar ceilings).
Cooling energy use was monitored for four to six summer months in
each building. Repair of uncontrolled air flow was done in the middle
of the summer. On average, cooling energy consumption decreased from
87.4 kWh/day to 75.1 kWh/day, or 12.4 kWh/day. On average,
cooling energy use declined by 14.7% from repair of uncontrolled air
flow. Based on the assumed $0.075/kWh electricity cost, projected annual
cooling energy savings are $182. Given that the average projected retrofit
cost is $454, simple payback is 2.5 years. This indicates
that UAF repairs can be very cost-effective retrofit measures.
This report concludes that uncontrolled air flow is widespread in
commercial buildings. Energy waste is one important consequence. However,
other consequences of occupant discomfort, cooling/heating equipment
being improperly sized, high humidity, moisture problems, indoor air
quality complaints, and sick buildings are of equal or greater importance.
Since uncontrolled air flow problems are widespread and often severe,
there is a strong need to bring about changes to the way buildings are
created and used.
A plan was developed to implement the findings of this project (chapter
7). The plan suggests three areas of further work. 1) More research
needs to be done to understand the extent, consequences, and solutions
to uncontrolled air flow in commercial buildings. 2) Based on findings
from this research, various standards relating to building design, construction,
commissioning, and maintenance need to be modified. 3) To bring about
resolution of uncontrolled air flow problems, training programs need
to be established to bring improved design, construction, commissioning,
and maintenance skills to those responsible for buildings.
Uncontrolled air flow may be caused by duct leaks, return design
problems, and exhaust/intake imbalance. Another and more inclusive way
of stating this is that uncontrolled air flow occurs:
- When there are pathways where there should be barriers (e.g., duct leaks)
- When there are barriers where there should be pathways (e.g., closed interior doors when returns are centrally located, firewalls that restrict return air flow, and dirty coils and filters)
- When there is building air flow imbalance (e.g., exhaust air not equal to outdoor air plus make-up air).
In order to achieve project objectives, we have tested 70 commercial
buildings and made repairs of uncontrolled air flow (UAF) in 20 commercial
buildings. (Note: by commercial buildings, we mean all non-residential
buildings except industrial.)
2.2 Building Categorization
Commercial buildings fall into a wide variety of building uses and types. By comparison, there is much less diversity in single family homes. Most homes have two, three, or four bedrooms, a living room, a dining room, a kitchen, one or two bathrooms, and a garage. There are, of course, regional variations regarding foundation style (slab on grade, crawlspace, or basement), number of stories, and attic configurations. In terms of air flow, etc. In small commercial buildings, however, duct leaks commonly exist in four different ambient environments. 1) In some cases, the duct leakage occurs inside both the building air barrier and thermal barrier (insulation). In these cases there is not much air exchange or heat exchange with outdoors. 2) In other cases, the duct leaks occur inside the building air barrier but outside the thermal barrier (such as when the ducts are in the space between the ceiling and the roof deck, but the insulation is on top of the ceiling tiles) and therefore have significant energy penalties. 3) In yet other instances, the duct leaks exist outside both air and thermal barriers (such as in vented ceiling spaces or vented attic spaces), and the energy penalties of duct leakage can be severe. 4) Ducts may also be located on the roof. In many cases, a small portion of the ductwork is located on top of the roof. In a small number of cases, the entire duct system is on top of the roof. The energy penalties of duct leakage are generally worst in case 3, but are also substantial in cases 2 and 4.
Small commercial buildings are more leaky and often have greater complexity
than residences. Testing in 70 small commercial buildings found them
to be 30% more leaky than residences, primarily because suspended t-bar
ceilings are quite leaky. ACH5O, the air exchange rate of the building
when depressurized to -50 pascals by a blower door, averages
16.7 compared to 12.7 in Florida residences. The difference is even
more pronounced in new construction. New commercial buildings are more
than twice as leaky as new Florida residences.
Small commercial buildings are very leaky primarily because suspended
t-bar ceilings are on the order of 10 times more leaky than gypsum board
ceilings. Because the ceilings of most commercial buildings are so leaky,
overall building leakiness depends primarily upon whether the ceiling
space or attic space above the ceiling is well ventilated to outdoors.
In those which have tight ceiling spaces, building airtightness may
be 5 ACH5O or less. Several of the 70 buildings were considerably
tighter than any Florida residence we have tested. In the majority of
cases, where the ceiling space or attic space is vented, building airtightness
is 15 ACH5O or greater. Also of note is that attached units, such as
those in strip malls, are more than twice as leaky as stand-alone commercial
buildings. Because much of the leakage of these attached units is to
adjacent units, the energy impacts of this excessive building leakage
may be relatively less severe.
Commercial buildings are often more complex than residences -- that
is, they have a greater number of partitions and compartments. A building
can be thought of as a matrix of barriers to air flow and pathways for
air flow. Interior walls, closed interior doors, firewalls, and multiple
stories create potential barriers to air flow which can interrupt the
flow of air throughout the building. This disruption of air flow can
create pressure imbalances which can cause elevated infiltration rates,
accumulation of moisture in building cavities, and backdrafting of combustion
equipment. Filters and coils, as they become dirty, become barriers
to air flow and can create pressure imbalance in the air distribution
system.
Repair of uncontrolled air flows was done on 20 of the 70 buildings.
Repair candidates were selected based on the perceived potential for
energy savings and whether the repair was financially feasible within
the project budget. Repairs included sealing of duct leakage, provision
of return air pathways, reducing outdoor air flow, airtightening the
building envelope, and turning off attic exhaust fans. The majority
of repairs were duct repair. Three major types of repairs that were
not attempted were provision of make-up air, homes often have air distribution
systems, but no make-up air, no outdoor air, and small and infrequently
used exhaust fans. Variations in homes is much smaller than in commercial
buildings.
Commercial buildings have a much wider range of sizes, uses, construction
styles, height, and mechanical systems. A conceptual framework was developed
for thinking about the diversity of building types and configurations
found in commercial buildings based on the potential for and consequences
of uncontrolled air flow.
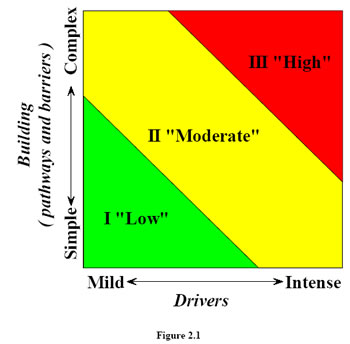
2.2.1 Uncontrolled air flow potential
A two-dimensional matrix has been developed that attempts
to describe the potential for uncontrolled air flow in a building.
The two axis are “drivers” and “building” (Figure
2.1).
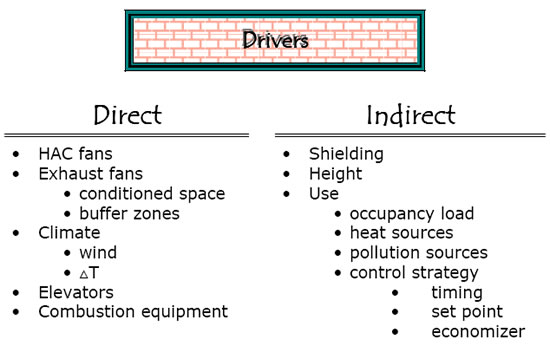
 “Drivers” are
the forces which move air within a building and across the building
envelope. They include air handlers, exhaust fans, outdoor air, make-up
air fans, and operation of combustion equipment (Figure 2.2). Drivers
can also include wind driven air flow and pressure differentials, and
stack effect pressures (especially in tall buildings in cold weather).
Drivers range from mild to intense. The more intense or larger the drivers,
the greater the potential for uncontrolled air flow to occur.
“Drivers” are
the forces which move air within a building and across the building
envelope. They include air handlers, exhaust fans, outdoor air, make-up
air fans, and operation of combustion equipment (Figure 2.2). Drivers
can also include wind driven air flow and pressure differentials, and
stack effect pressures (especially in tall buildings in cold weather).
Drivers range from mild to intense. The more intense or larger the drivers,
the greater the potential for uncontrolled air flow to occur.
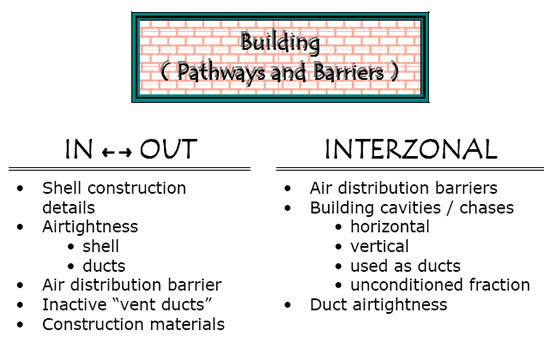
“Building” refers to building size and complexity, but
complexity is most important. A building is an interwoven fabric of
barriers and pathways. A wide-open retail space, for example, has few
compartments, and is therefore “simple”. A building which
has many partitions and subdivided spaces is complex. Partitions provide
the potential to restrict air flow and therefore have the potential
to create substantial pressure imbalances and UAF (Figure 2.3).
Simple buildings with mild drivers fall into the “low potential” portion
of the matrix and have less potential for UAF and large pressure differentials.
Examples include restaurants (large exhaust, make-up air, and outdoor
air) and some recreation and light industrial/warehouse facilities.
Complex buildings with mild drivers (only air handlers) also fall into
the "moderate potential" portion of the matrix and have substantial
potential for UAF because of closed doors when returns are centrally
located.
Complex buildings with intense drivers fall into the "high potential" portion of the matrix and have the greatest potential for UAF; these would include hotels, hospitals, larger restaurants, and some sports facilities.
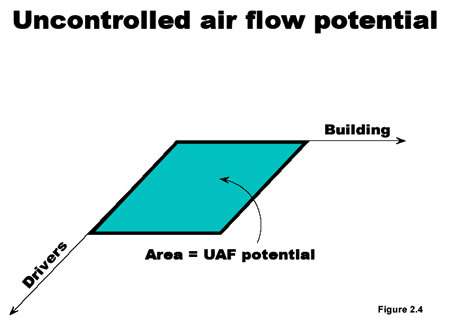
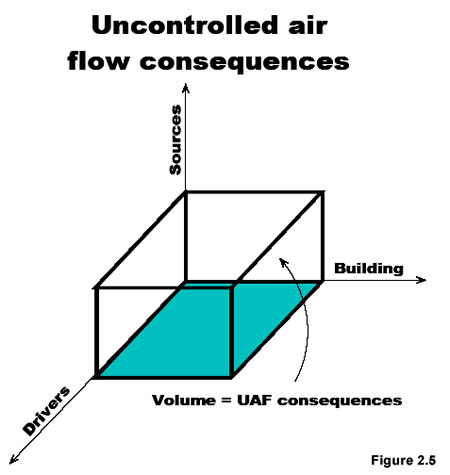
2.2.2 Uncontrolled air flow consequences
While uncontrolled air flow potential can be defined by a two-dimensional matrix consisting of drivers and building complexity. The potential for uncontrolled air flow can be thought of as the area defined by the two matrices (Figure 2.4). Uncontrolled air flow consequences can be conceived as a three-dimensional matrix defined by drivers, building complexity, and sources, and the extent of consequences can be thought of a volume defined by the three parameters of drivers, building complexity, and sources (Figure 2.5). Sources include heat, cold, moisture, and air contaminants. When transported by UAF, these sources often have negative consequences. Sources fall into three primary categories; 1) cold/heat, 2) moisture, and 3) pollutants.
2.2.2.1 Cold and Heat
When drawn into the building by UAF, cold and heat can cause the following consequences.
- Increased heating and cooling energy use
- Increased electrical demand
- Comfort problems
- Oversizing of heating and cooling systems
- Added run ime and stress on HVAC equipment
- Stress on other equipment, such as copiers, printers, computers, etc., because of high or low temperatures and humidity.
- Moisture condensation on building surfaces
- Freezing of pipes
- Low relative humidity
- Static electricity problems
2.2.2.2 Moisture or dryness
When drawn into the building by UAF, moisture or dryness (air with low moisture content can cause the following consequences.
- Increased cooling energy use
- High relative humidity
- Condensation on surfaces
- Mold/mildew/microbial growth
- Building materials decay
- Comfort problems
- Damage to paper products
- Tress on equipment, such as copiers, printers, computers, etc., because of high or low temperatures and humidity.
- Increased emission rates of VOC (volatile organic compounds) and formaldehyde
- Low relative humidity
- Static electricity problems
- Dry skin and eye irritations
2.2.2.3 Pollutants
Pollutants can be drawn itno buildings or not properly diluted (diminished ventilation) as a result of uncontrolled air flow. UAF can cause indoor air quality problems by four mechanisms; 1) mining of pollutants, 2) transporting of pollutants, 3) generation of pollutants, especially microbial growth, and 4) diminishing of ventilation.
Mining of pollutants occurs when depressurization caused by UAF draws pollutants from the soil (radon, methane), sewer pipes (methane, sulfur dioxide), or combustion equipment (carbon monoxide, moisture, particulates, and nitrous oxides). Space depressurization draws pollutants through cracks or penetrations in the slab (soil gases such as radon or methane), from sewer lines when plumbing fixtures are not seated properly or when traps are dry, and from combustion appliances when backdrafting or spillage is induced.
Transport of pollutants occurs when UAF carries pollutants from zones that have air contaminants. Following are examples. Return leaks in ducts or air handlers located in crawl spaces, garages, attics, etc. may transport radon, volatile organic compounds (oil and gasoline in garage), and insulation particles from these zones to the occupied space. In at least two reported incidents in Duval and Brevard counties in Florida, a total of seven persons died in their homes from carbon monoxide poisoning when cars were left running in closed garages. Leaks in the air handlers and ducts in the garage transport carbon monoxide-laden air into the house, resulting in lethal carbon monoxide poisoning. Return leaks in a roof-top package air conditioner may be drawing air from contaminated sources such as cooling towers, plumbing stacks, or exhaust fan discharges.
Generation of pollutants occurs when UAF actually creates or increases the pollution source. Four examples are presented.
- Mold/mildew. The most important example occurs
when humid air is transported into building cavities (walls, ceiling
spaces, etc.). When the humid air meets cool interior building
surfaces, moisture accumulates in those materials. Moist building
materials can support mold and mildew growth, which in turn can
contaminate indoor air and cause indoor air quality and health
problems. There are great numbers of buildings throughout Florida
which suffer from mold and mildew growth, a significant portion
of which is caused by uncontrolled air flows.
- Fouling of ducts and air handler. A second example
of UAF generated pollution occurs as a result of
return leaks when the filter is located at the return
grill. In this situation, the air entering the return
leaks is not filtered (it missed the filter since the filter is at
the grill) and may be quite dirty because it comes from outdoors,
the attic, the garage, or the crawl space. The dirt may quickly foul
the cooling coil, the blower wheel, the drain pan, and duct surfaces,
and with the presence of moisture and high humidity around the coil
and downstream in the supply ducts it often generates various types
of microbial growth. This growth, in turn, can generate odor and indoor
air quality problems.
- Wet ducts as a result of failed condensate traps. A
third example of UAF-generated pollution occurs as a result of dysfunctional
(or missing) condensate traps. The purpose of the trap is to prevent
air from being sucked into the air handler (draw through air handlers)
through the drain line. In a properly functioning trap, a plug of
water is held in a low spot in the drain line, thus preventing air
flow. If this plug of water disappears because of leakage, evaporation,
or improper design (e.g., insufficient elevation from low to high
point of trap), then air will rush through the drain pipe and into
the air handler.
The velocity of the air depends upon the extent of air handler depressurization and air flow resistance in the drain pipe. This high velocity air can prevent condensate from flowing out of the drain pan so the condensate collects into a “pond”. As the water level rises, and it will rise to a height approximately equal to the static pressure in the air handler (e.g., -250 pascals depressurization equals 1.0 inches WC, so water will pond to about 1 inch depth), air entering from the drain pipe will be discharging into this body of water and causing bubbling and splattering. Water droplets will begin to splatter wetting interior surfaces of the air handler. The splattered water may also be drawn into the blower where they can be “atomized” and blown downstream into the supply plenum and ductwork. The moist environment created in the air handler and supply ductwork is ideal for mold and other microbial growth. The odors and spores from this growth can create air quality and sick building problems.
In this study, we found that a large number of traps were dysfunctional. Some no longer had traps or in some cases even drain lines. In other cases, the trap cleanout cap had been left off so that air was coming into the drain line and by-passing the trap. Commonly, little or no condensate was coming from the line when the unit was on, and then when it shut off a rush of condensate would flow out. In one building, the accumulation of condensate in the drain pan was confirmed and observed by replacing one panel of the air handler with a sheet of plexiglas. As the water level rose, it overflowed the pan and covered the 35 square foot area of the bottom of the air handler with about 1 inch deep water.
The rise in water level and splattering of water inside the air handler was observed through and on the plexiglas panel. (Note that water was not easily draining out of leaks in the bottom of the air handler because pressure between the coil and blower was -330 pascals, so streams of air bubbles were flowing up through the water and little water was draining out.) There was no indication, however, that water particles were being drawn into the blower or discharged into the supply ductwork. by the blower. The fact that water particles apparently were not being drawn into the blower may have been the result of the very thick coil assembly (heat pipe, coil, and heat pipe) and a several foot distance from the coil to the blower. Other researchers have found wet supply plenums and ducts as a result of dysfunctional traps (Trent and Trent, 1994).
- Elevated carbon monoxide generation. A fourth example of UAF generated pollution occurs in some cases with atmospherically vented combustion water heaters. By “atmospheric” it is meant that the water heater and the vent pipe are separated by the draft diverter. One purpose of the diverter is to permit entry of room air into the vent pipe to dilute the combustion gases and thereby reduce the dewpoint of the gases in the vent pipe, diminishing condensation on the vent pipe walls. The diverter also allows combustion gases in the flue (inside the appliance) to vent even if the vent is blocked or backdrafting. In cases of severe backdrafting, however, the velocity of the air coming down the vent pipe can, push into the flue (the flue is inside the appliance), reducing the flow rate of gases up the flue, thus reducing the entry of combustion air into the combustion chamber, and sometimes causing substantial increases in the generation rate of carbon monoxide. In these cases, an appliance that otherwise may be producing little carbon monoxide may now be producing large amounts. And since these combustion gases are no longer leaving the building through the vent pipe, serious health hazards may result.
Diminished ventilation may occur if outdoor air, exhaust air, or. make-up air ducts have leaks. Consider some examples. Outdoor air ductwork is located in a ceiling space. If the ductwork leaks, then building air is drawn into the outdoor air ducts and thus reduces building ventilation air. If exhaust fan ductwork leaks (blower at or near the grill), so that air is discharging from the ducts into the building, then polluted air may be re-entrained into the building and the overall ventilation rate may be diminished.
2.2.3 Types of air quality consequences
Uncontrolled air flow generates very substantial energy consequences. • However, these consequences are often’ dwarfed by the indoor air quality and materials damage consequences. Air quality problems produced by the four UAF mechanisms listed in the preceding section can result in various types of consequences.
-
Odor problems
-
Health consequences
a) chronic
b) acute -
Reduced worker productivity
-
Sick buildings
a) headaches
b) respiratory stress
c) increased illness
d) anxiety. developed among workers -
Evacuation of buildings, temporarily or long-term
-
Law suits
UAF may lead to increased sick leave and reduced worker productivity. Add to this the possibilities of having to evacuate the building, renovation costs, and law suits, the air quality:nationwide consequences of UAF may run into the billions of dollars each year.
2.2.4 Consequences are somewhat random
Just because there are intense drivers, a complex building,
or both, does not ensure that uncontrolled air flow will result.
These factors simply increase the potential for uncontrolled air
flows.
Just because there are uncontrolled air flows does not mean there
will be consequences. The presence of uncontrolled air flow simply increases
the potential for significant consequences. Whether there are consequences
or not depends in large part upon luck (often the randomness of how
buildings are put together) and of course whether there are sources.
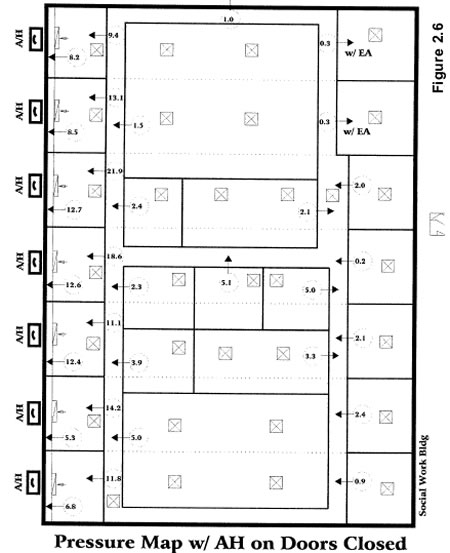
Just a matter of luck. Whether uncontrolled air flow leads
to serious consequences is often just a matter of luck. Consider the case of
one manufactured office building (#16 on Master Table in Appendix B) tested
in this project. Seven package air handlers are mounted on the exterior wall
of the building, through-the-wall returns pull air from office, return transfer
grills in the office doors were greatly undersized (allowing only about 5% of
the needed air flow), and office doors are closed most of the time (Figure
2.6 -- note the numbers are pressure differentials and the arrows indicate
the direction of pressure gradient and air flow). The closed doors then acted
as barriers to air flow, creating strong depressurization in the closed offices,
and thus pulling a majority of the return air from the space above the ceiling,
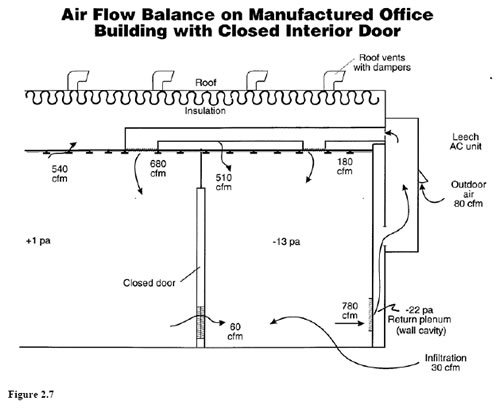
which had 34 passive roof vents to outdoors (Figure 2.7).
Two fortunate circumstances prevented this major form of uncontrolled
air flow from being a serious problem. First, the roof vents had dampers
and these dampers were quite tight. Second, the ceiling insulation (batts)
was attached to the. bottom of the roof deck. Therefore, this ceiling
space, which was acting like a return plenum, was located inside both
the air barrier and thermal barrier of the building. If the insulation
had been located on top of the ceiling tiles or the roof vents actually
ventilated the ceiling space, then there could have been substantial
energy and humidity consequences.
Importance of sources. The importance of sources can be
illustrated by considering the following example. If we have a building with
considerable UAF, and it is drawing considerable air from outdoors, but the
air being drawn into the building is virtually identical to the desired indoor
conditions (75F and 50% RH) and has no pollutants, then there may
be no energy, comfort, humidity, building material damage, or indoor air quality
consequences from UAF. This could occur, for example, in a city like San Diego,
California when cool and clean breezes blow from the ocean much of the time.
In real life, however, the air brought into buildings by UAF is generally too
cold, too hot, too humid, too dry, or polluted. Even in San Diego on a perfect
day, air can be drawn from an attic space (which may be hot) or a loading dock
area (which may be polluted), and there may be negative consequences.
3. Diagnostic and Testing Protocols
One of the primary objectives of this project was to develop diagnostic
and testing methodologies which can be used to diagnose UAF problems
in buildings. Since this project is research, the testing actually done
on these buildings was more comprehensive than we expect will be used
in typical “real world” diagnosis. Nevertheless, many of
the research procedures and testing methodologies developed in this
project will be incorporated into real world diagnostics. A number of
new measurement techniques were developed and refined in this project,
and they allow mçasurement of air flows and pressure differentials
in buildings more accurately and quickly than is commonly available
in the industry.
Following is a discussion of the various diagnostic and testing protocols used to characterize airtightness, pressure differentials, and air flow rates in this project.
3.1. Not All Tests Were Done In All 70 Buildings
Not all tests were done in all 70 buildings. In terms of building
airtightness, one business owner would not allow us to do a blower door
test because he felt it would disrupt his business activities. Building
airtightness tests exist for the other 69 buildings.
In 24 of the 70 buildings, duct system airtightness was not measured.
Three factors determined whether the duct airtightness test was done.
- This is the most time-consuming of the tests.
- This test is the most intrusive to the operations of the business because it requires turning off the air conditioning systems for a several-hour period and (in some cases) simultaneously running blower doors (when determining leakage to outdoors). In a 15,000 square foot building with six air conditioning systems, duct system airtightness testing could take two or more person-days. Depending upon outdoor weather and building thermal efficiency, some building occupants would not allow us to turn off the systems for any length of time.
- In a significant number of buildings (17 buildings), ducts were
located within both the air and thermal barriers of the building,
or even inside the ceiling return plenum. In these cases, the importance
of duct leakage in understanding UAF and the consequences of UAF is
greatly reduced, so the test results are of less value. In other cases,
the ductwork was located within the building primary air barrier but
not within the primary thermal barrier (see definitions). In these
cases the roof deck is the primary air barrier while the insulation
is typically located on top of the ceiling tiles. Commonly, however,
the roof deck (especially flat roofs) may have
some thermal resistance (or thermal mass) because of a layer of concrete, layers of built-up roofing materials, semi-reflective roof surfaces, or loose gravel (the latter poorly conducts heat downward into the building but readily dissipates its heat into the air). Depending upnn the thermal resistance of the roof construction, consequences of duct air leakage in these circumstances is also diminished because significant recovery of lost energy is likely to occur.
In 13 of the 70 buildings, the building infiltration rate with the
air handlers (and normally operating exhaust fans) turned off was not
measured. This occurred almost exclusively in cases where the occupants
were very reluctant to allow us to turn off the air conditioning systems
for a one-hour-plus period. Business owners are generally very sensitive
to things that affect worker productivity or customer comfort. In many
buildings, turning off the cooling system on summer days results in
rapidly rising temperature and humidity. In restaurants, it is virtually
impossible to turn off the exhaust fans because the cooking appliances
require continuous exhaust.
In one small real estate office building, for example, the air handler-off
infiltration test was done over the lunch hour when most of the employees
were out to lunch. During the 70- minute test, the temperature in the
space rose by about 5F. Because the air conditioner was undersized (this
was a thermally inefficient building because of a very leaky building
shell and poorly located insulation), the temperature in the space never
recovered and the occupants were hot (and not particularly happy with
us) throughout the remainder of the work day.
Typical protocol. A typical protocol includes visual inspection,
building and duct airtightness testing, pressure differential measurement,
infiltration/ventilation tests, air flow measurement, and visual inspection
of building mechanical components which may contribute to uncontrolled air
flow and pressure differentials. The objective of the testing is to characterize
air flows and pressure differentials within the building, characterize the
air flow balance across the building envelope, identify the cause of air
flow and pressure imbalances, and understand the interacting relationships
between building airtightness, air flows, pressure differentials, the operation
of building equipment, indoor air quality, ventilation, and energy consumption.
3.2 Visual Inspection
The first step in the diagnostic process is visual inspection
and obtaining information from persons familiar with the building.
Following are steps typically taken.
- Inspection includes reviewing building architectural and mechanical plans, if available.
- Inspect mechanical rooms, mechanical equipment, duct systems, ceiling spaces, attics, and control devices (thermostats, etc.). Learn how to control the HVAC systems. Look for signs of problems, such as moisture damage on walls, ceilings, ducts, and air handler support platforms. Learn typical use patterns for air conditioners, thermostats, and exhaust equipment.
- Inspect combustion equipment for any irregularities related to vent pipes, leaking fuel, signs of incomplete combustion (excess carbon), or signs of flame roll-out (burned areas on or adjacent to the combustion equipment, or melted wire or pipe insulation).
- Inspect for sources of air contamination, such as cleaners, fuel, pesticides, volatile organic compounds, etc, that may contribute to air quality problems. Note any smells that may give clues to problems or sources that should be identified. In one restaurant, for example, there was a strong sewer odor in one of the bathrooms that led us eventually to identify that strong negative pressure in the building was drawing gases out of the sewer lines. In another building, foul odors were coming from the men’s bathroom during the blower door test. The floor drain trap was dry, so sewer gases were coming rapidly from the sewer pipe during the test and would be coming out more slowly during normal building operation. If these gases come into the bathroom rapidly when depressurized to -50 pascals, they may be entering the bathroom slowly during normal operation with the bathroom depressurized to about -1 pascals. Basically we are looking for any and all clues that indicate any types of problems that may be related to equipment efficiency, energy waste, building damage, comfort problems, or indoor air quality problems.
- Speak with the business or building owner, facilities manager, or other persons familiar with the building to get their perspective on any problems that may exist. One can learn a considerable amount by listening to their comments, about comfort, air quality, utility bill, or other symptoms.
3.3 Important Definitions
Following are definitions that are important to understanding
some of the following discussions.
Attic space is a space above the ceiling that has
trusses or joists which can be walked on and often has sloped roof,
wood decking, intentional ventilation, and insulation at the attic
floor level.
Backdrafting is reversal of flow of gases down the chimney
or vent of a combustion appliance.
Ceiling space is the space above a ceiling that has no structural
members that could support a person’s weight, may have insulation at
the ceiling or roof deck level, and generally is not intentionally vented.
Pressure pan is a pan that can be placed over supply and return
registers to measure pressure difference. It is made of a cake pan (or other
type of pan). Gasketing is put on the pan rim to facilitate an airtight fit
and a tap penetrates the pan to allow measurement of pressure in the ductwork.
Primary air barrier is that portion of the building envelope
which provides the greatest resistance to air flow and the greatest pressure
drop when the building is exposed to a significant pressure differential compared
to outdoors. In the ceiling/roof plane, the roof deck may be the primary air
barrier or the ceiling may be the primary air barrier. Note that this means
only that the primary air barrier is only relatively tight; that is, it is
tight only by comparison to any other air barriers in series with the primary
air barrier. A suspended t-bar ceiling may be the primary air barrier, but
it nevertheless may be very leaky.
Primary thermal barrier is that portion of the building envelope
which provides the greatest resistance to heat flow. In the ceiling/roof plane
of the building, insulation may be located at the ceiling, at in the roof deck,
or suspended in between. Often the primary insulation barrier is located on
top of the ceiling tiles, but the (flat) roof assembly may also have some significant
R-value, so the ceiling space is actually sandwiched between two thermal barriers.
Spillage occurs when only a portion of the combustion gases
leave the building through the vent pipe. The remainder spill into the space.
Spillage often occurs during start-up of a combustion appliance when the chimney
or vent is cold. Ad the flue gases warm, draft strength increases and complete
drafting of combustion gases results. Continuation of spillage beyond one minute
indicates a draft problem.
3.4 Building Airtightness Testing
Typically, the second step in the diagnostic process is building
airtightness testing. The building is prepared by turning off vented
combustion equipment and air moving equipment including air handlers,
exhaust fans, make-up air fans, and clothes dryers. Outdoor air, exhaust
fans, and make-up air openings are sealed off, since these holes in
the building do not respond passively to building air flow and pressure
dynamics.
A multi-point airtightness test is performed (we follow the ASTM
E 779-87, “Standard Test Method for Determining Air Leakage Rate
by Fan Pressurization”, except we only depressurize the building),
using from one to six calibrated fans (blower doors), depending upon
the building airtightness and size, and generally obtaining air flow
at five to eight building pressures in the range from -10 pascals to
-60 pascals depressurization. (Note: all pressures expressed
in this paper are “with respect to outdoors” unless otherwise
indicated). Knowledge of building airtightness assists in interpretation
of other field testing, especially pressure differential measurements,
and in developing recommendations for air flow and pressure balancing.
3.5 Identification of Building Air Barriers
With the building depressurized to -50 pascals by the calibrated
fan(s), pressures in various zones of the building are measured in ordet
to identify the primary building air barrier; in other words to determine
which portions of the building are “indoors” and which are “outdoors”.
Pressure may be measured in the ceiling space, attic space, wall cavities,
chases, soffits, mechanical rooms, ducts, space between floors, etc.
Consider an example; if the ceiling space of an office buildings is
at -5 pascals when the occupied space is at -50 pascals,
this indicates that the ceiling is the primary air barrier. It may also
indicate that the ceiling space is reasonably well ventilated to outdoors
and that ducts located in the ceiling space are in a zone that is effectively “outdoors”.
If the ducts are “outdoors”, then it will be more important
to test for duct leakage.
If, on the other hand, the ceiling space is at -49 pascals when the
occupied space is at -50 pascals, then the ceiling space and
the ducts are located “indoors”. (Note that being inside
the building air barrier does not ensure, however, that the ceiling
space and the ducts are inside the thermal barrier; for example, the
insulation may be on top of the ceiling tiles while the roof deck is
the air barrier.)
Consider another example; a mechanical room containing a gas water
heater is at zero pressure when the occupied zones are at -50 pascals.
This indicates that the mechanical room is well connected to outdoors
arid poorly connected to indoors, and that the combustion equipment
located in that room will not be significantly affected by any pressures
which may be created in the occupied zones. On the other hand, if the
mechanical room is well ventilated to the occupied space and is at -48
pascals when the occupied space is at -50 pascals, then the
combustion equipment located in that room could be significantly affected
by any pressures which may be created in the occupied zones. This could
lead to spillage or backdrafting of combustion equipment.
3.6 Duct System Airtightness Testing
Airtightness of the duct system can be measured by means of a depressurization
test. Airtightness of the duct system can also be indicated by means
of a pressure pan test.
3.6.1 Duct system depressurization test
Duct system airtightness may be measured using calibrated
fans (duct test rigs or duct testers). All registers except one supply
and one return (in proximity to the air handler) are masked off.
Outdoor air inlets, if any, are masked off. Calibrated fans are attached
to the open registers. An air flow barrier is placed in the air handler
(at the filter, coil, or blower) to divide the system into supply
and return. Air is drawn from the duct system by the calibrated fans
and a multi-point (multiple pressures) airtightness test is done,
with each side of the system at the same pressure (duct pressure
is measured near the air handler and referenced to the zone in which
the ducts are located). CFM25 (air flow through leaks in the duct
system when the ducts are at -25 pascals) is determined
for both the supply and the return side of the system. The combined
CFM25 (add supply and return sides together) represents the combined
leakage to outdoors, unconditioned building space, and conditioned
building space, and can be expressed as CFM25total.
The duct system airtightness test can be repeated to determine what
portion of the duct leakage is to outdoors (or to buffer zones which
are well ventilated to outdoors). Using a calibrated fan, the building
is depressurized to the same pressure as the duct system, usually at
just one pressure of -25 pascals, and the duct system airtightness test
is repeated. Since the occupied zone and the ducts are at the same pressure,
the duct test rig is measuring only duct leaks to outdoors. The resulting
CFM25 can be expressed as CFM25out.
If the ducts, plenums, and air handler are within the air barrier
of the building, then the second test (with the building depressurized)
is not needed. Note that in some cases, the ducts may be inside the
building air barrier but there are leak pathways between the “designated” duct
system and interstitial cavities that lead to outdoors.
In other cases, the ducts are located within the air barrier of the
building, but outside the thermal barrier, such as when the roof deck
is the building air barrier, the ducts are located in a ceiling space,
and the insulation is on top of a t-bar ceiling. (T-bar ceilings are
used in the vast majority of all commercial buildings. They are composed
of t-shaped metal framework suspended from above with ceiling tiles
supported within the metal framework). Duct leakage to and from these
ducts causes considerable heat gain from the ceiling space during the
cooling season and heat loss during the heating season. Even though
this leakage occurs within the air barrier of the building, it occurs
outside the thermal barrier of the building and consequently causes
significant energy penalties (the extent of the energy penalties largely
depends upon the thermal resistance inherent in the roof construction,
the color of the roof surface, whether the roof surface is covered by
gravel, and the extent of roof shading).
3.6.2 Pressure pan test
Duct system airtightness can be indicated (though not measured) by
means of a pressure pan test. In this test, the building is depressurized
to -50 pascals by the blower door. The air handler is turned
off. A pan, similar to a cake pan, is attached to a pole and placed
over each supply and return register, one register at a time. A micromanometer
is attached to a pressure port on the pan so that the pressure in the
ductwork (with respect to the room) can be measured. If the duct pressure
is the same as the room pressure, then there is no duct leakage (to
outside the building envelope). If the duct pressure is considerably
different from room pressure, this indicates substantial duct leakage
near that register. The following table provides a means of interpreting
the pressure pan results.
Table 3.1
Interpretation of pressure pan results when house is depressurized
to -50 pascals. (Cummings, Tooley, and Moyer, 1993.
PRESSURE DIFFERENCE (PA) |
CONDITION OF DUCT SYSTEM |
0.0 |
completely airtight |
0.5 |
very small duct leakage |
1.0 |
small duct leakage |
3.0 |
moderate duct leakage |
8.0 |
large duct leakage |
15.0 |
very large duct leakage |
30+ |
open to the world! |
The interpretation of pressure pan test results shown in Table 3.1
assumes that the duct system is located in a zone which is well ventilated
to outside, so that when the occupied space is at -50 pascals, the duct
zone is near neutral with respect to outdoors. In single family residences,
this assumption is most often correct. In commercial buildings, however,
the zone containing the ductwork is frequently located inside the primary
air barrier and may experience pressure much closer to indoors than
outdoors.
Consider the following example. In Realty 2 (building #37), the attic
space is at -43 pascals with respect to outdoors when the occupied space
was at -50 pascals with respect to outdoors (the attic is at +7 pascals
with respect to the occupied space). Pressure pan tests were done on
the 10 supplies and 1 return of the duct system. The indicated pressure
ranged from 0.7 pascals to 5.0 pascals and the average was 2.0. Since
the maximum pressure that could occur was 7 pascals (50 pascals - 43
pascals), these pressures indicate large duct leakage.
In order to convert these number to values which can be interpreted
on Table 3.1, multiply the pressure pan pressures by 50 (the assumed
pressure difference between the occupied zone and the duct zone) and
divide by the actual pressure difference between the occupied zone and
the duct zone. In this example, multiply by 50 and divide
by 7. The converted pressure pan pressures would range from 5 to 35.7 pascals.
In many commercial buildings, pressure in the duct zone is the same
or virtually the same as in the occupied space (blower door operating);
consequently the pressure pan test will not work in these buildings.
In conclusion, while the pressure pan test is widely useful in residences,
it is often not an effective diagnostic tool in commercial buildings.
3.7 Building Pressure Differentials
Pressure differentials were measured in the building with the building
and HVAC systems in various modes of operation. Pressure in the building
is measured with respect to (wrt) outdoors once with the air handlers
turned to continuous “on” and the exhaust fans operated
in normal operation. Pressure in the building is measured a second time
with all mechanical systems turned off. Pressure in various rooms and
zones of the building are measured with doors open and closed and various
HVAC equipment turned on and off in order to characterize pressure differentials
between various zones of the building and between those zones and outdoors.
A primary objective is to characterize the effect of the air moving
equipment on building and zone pressures, especially negative pressure.
Pressure differential measurements are made with 2-channel and 8-channel
digital micromanometers with resolution to 0.1 pascals. The hand held
units have time-averaging capabilities which allow discriminating small
pressure differentials even when significant fluctuations exist because
of wind. The 8-channel micromanometer with interface to computer display
and memory was used to sample at up to eight locations simultaneously
throughout the building and mechanical systems, plot continuously on
a computer screen, and store data for later analysis.
3.8 Infiltration/Ventilation Rates
Using tracer gas decay methodology (ASTM E 741, “Standard Test
Method for Determining Air Leakage Rate by Tracer Dilution”),
the building infiltration/ventilation rate was measured, once with the
HVAC equipment operating and then again with the HVAC equipment turned
off (if possible or practical). In 13 of the 70 commercial buildings,
the “equipment off ‘ test was not done because it was difficult
to find a period when the occupants would allow turning off the mechanical
systems.
Foxboro Miran 101 Specific Gas Analyzers and a Bruel and Kjaer 1302
multi-gas analyzer were used in various types of infiltration testing.
Sulfur hexafluoride and nitrous oxide were the two gases that were commonly
used as tracers. The typical test method using the Miran 101 was as
follows:
- Turn on the gas analyzer and allow it to warm up for an hour before testing begins.
- Inject tracer gas into the building, typically into the return air, with the AHs operating.
- Zero the gas analyzer using air from outdoors.
- Take tracer gas concentration measurements at a number of locations throughout the building at approximately 10 minute intervals over a 60 to 90 minute period.
- Check zero of the gas analyzer every 20 minutes and rezero if needed.
3.9 Air Flow Rates
In virtually all buildings, HVAC system air flow rates were measured.
A number of different measurement techniques were used.
Various methods were used because 1) some methods work better than
others because of intake or discharge configuration, 2) some methods
take more time, and 3) some methods take duct leakage into account and
others do not. Air flow hoods are useful for getting a “quick
and dirty” picture of overall flows of the HVAC systems. They
are not the best choice, in many cases, for measuring exhaust air flows,
make-up air flows, or outdoor air flows. They also may overestimate
air flows, especially at discharge grills/registers (more discussion
in 3.8.1).
Tracer gas injection in conjunction with a gas analyzer can measure
total air flow through ducts, air handlers, exhaust fans, and make-up
air fans. Calibrated blowers can be used to measure air flows through
air handlers, exhaust fans, make-up air fans, and even outdoor air.
Both methods can deal with most intake or discharge configurations and
accurately take duct leakage into account, but they are both more time
consuming compared to using a flow hood.
Since an important aspect of diagnosing uncontrolled air flow is
accurately measuring net air flows across the building envelope, the
more time consuming methods are often called for. Following are detailed
descriptions of the various air flow measurement methods.
3.9.1 Flow hood
Air flow at supply registers and return grills is measured by air
flow hood. Outdoor air is typically measured with a flow hood, by placing
the air flow hood over the outdoor air intake opening. Both Shortridge
and Alnor hoods were used in this project.
These air flow hoods provide the fastest means for determining flow
from registers and grills. They are generally quite accurate measuring
flow into return grills and exhaust grills. They are not so accurate
measuring air coming from some supply registers, especially those that
discharge mostly to one side or have jetting” of air into the
hood (these occur in small commercial and are most common in residential
systems). With some register configurations and air discharge configurations,
we have found measurement of air flow from supply registers often are
20% too high and can be as much as 50% to 80% too high. The
larger 24”x24” grills with diffuse holes or discharging
equally to all four sides can usually be measured with very little error.
3.9.2 Tracer gas
While tracer gas is most commonly used to determine the
building infiltration or ventilation rate, it can also be used to
determine return leak or outdoor air flow rates. Tracer gas is distributed
into the building (as in the tracer gas decay infiltration test)
and well mixed (about 15 minutes with the air handlers operating).
Tracer gas concentration is then sampled at three locations for each
air handler; A) in the room near the return grill, B) at the discharge
of a supply grill, and C) at the return leak or outdoor intake location
(since some tracer gas may be re-entrained into the outdoor air intake).
To get return leak fraction (RLF), run the test once with the outdoor
air intakes masked off. Then rnn the test a second time with the
outdoor air grills open.
RLFt, the proportion of return air flow that enters
the return air distribution system through all leaks, whether from
inside the building shell or not, is calculated by the following
equation (Cummings and Tooley, 1989).
RLFt = (A-B)/(A-C)
where
A is the tracer gas concentration of air entering the return grill(s)
B is the tracer gas concentration of air coming from a supply grill
C is the tracer gas concentration of air at the return leak site
Note that as the concentration of tracer gas at C approaches the value of that at A, the accuracy of the test diminishes rapidly.
RLFo, the proportion of return air flow that enters the return air distribution system through leaks from outside the building, is calculated by the following equation:
RLFo = (A-B)/A
Note that this test is done with outdoor air intake sealed off.
To obtain outdoor air fraction, repeat the return leak fraction test but this time with the outdoor air intake open. OAFt, the proportion of return air entering through both the outdoor air opening and return leaks from outdoors, is calculated by:
OAFt = (A-B)/(A-C)
where
C is the concentration of tracer gas enetering the outdoor air opening.
Outdoor air fraction (OAF; air entering only through the outdoor air vent) is calculated as follows:
OAF = OAFt - RLFo
Total return leak flow is calculated by:
RLFflowt = RLFt * air handler flow rate
Return leak flow from outdoors is calculated by:
RLflowo = RLFo * air handler flow rate
Outdoor air flow rate (OAflow) is calculated by multiplying OAF times total air handler flow rate.
OAflow = OAF * air handler flow rate
3.9.3 Measuring air flow rates using tracer gas injection
Flow rate of exhaust fans and make-up air fans (and air flow through
most duct systems) can be measured by means of tracer gas injection
and sampling with a gas analyzer downstream. Tracer gas is continuously
injected into the air stream such that the gas is well distributed (tubing
with holes is often used), and the gas is sampled downstream in a distributed
manner (a loop of tubing attached to a sampling pump). The injection
rate of the tracer gas must be accurately measured. Tracer gas concentrations
before the injection point (Cs) and downstream (Cb) must be accurately
measured. Flow rate is calculated by means of the following formula
(Grieve, 1991):
q = dose/(Cs-Cb)
where
q is the air flow rate in cfm
dose is tracer injectin rate in cfm
Cs is the tracer concentration at the sample point
Cb is the tracer concentration upstream of the injection location
Gas flow meters.
Two sizes were purchased to allow a wide range of gas flow rates.
Computer software was purchased which allows accurate determination
of flow rates through these two meters for a wide range of gases.
A water-displacement procedure was developed to calibrate the flow
meters. An airtight, five-gallon container of water was placed on an
accurate weight measurement scale. Tracer gas then flowed into the container
and displaced the water. The change in water volume was determined by
means of change in weight. In order to avoid compression of the tracer
gas within the five gallon container, pressure (wit the room) in the
container was measured. The flow rate of water out of the tank was modulated
so that pressure inside the container remained within about ±10
pascals of the room environment. The calibration results indicate that
the computer software/flow meter was accurate to within 3%, and the
data was extremely linear (r2 = 0.9915 fit to straight line indicates
little scatter in the experimental data).
Using the calibrated flow meter and a tracer gas analyzer (either
our Bruel and Kjaer 1302 or Miran 101), the air flow rate through a
duct, air handler, or exhaust system could be measured quickly. On a
test building, for example, we were able to measure the flow rate through
six roof-top package units in less than one hour. By comparison, measuring
that same rate using a duct blaster or blower door would have required
considerably more time. Depending up the air handler configuration and
outdoor air flow rate, an air flow hood could provide a fast and relatively
accurate means of measurement. Using a capture tent with a calibrated
blower might have been almost as fast, depending upon how much time
is involved in assembling and moving the tent (see section 3.8.4 for
further discussion of the capture tent method).
3.9.4 Calibrated fans
Calibrated fans, such as those used with blower doors and duct test
rigs, can be used to measure air flows. They can be installed in capture
tents, attached directly to the HVAC system, or used with the building
as a capture tent.
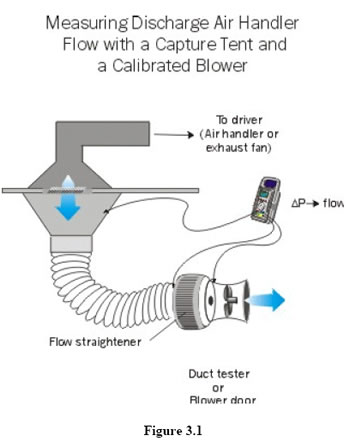
Capture tent. Air flows, especially the discharge of exhaust fans
or the intake of make-up air fans, can also be measured by means of calibrated
fans and a capture tent (polyethylene sheeting on a PVC frame will do). A
tent is placed over the discharge of the exhaust fan, for example, and a
calibrated fan is mounted into the side of the tent (a flow conditioner may
be needed to reduce turbulence at the intake side pressure sensor). A micromanometer
measures the pressure in the tent wrt outdoors. The calibrated fan is turned
on to draw air out of the tent and reduce the pressure in the tent (recall
that the exhaust fan is blowing air into the tent) until the pressure in
the tent is neutral wrt outdoors. Air flow through the calibrated fan is
then equal to the flow through the exhaust system. Make-up air may be measured
in an analogous manner, with the calibrated fan blowing air into the tent.
Figure 3.1 illustrates use of a capture tent and calibrated fan.
 |
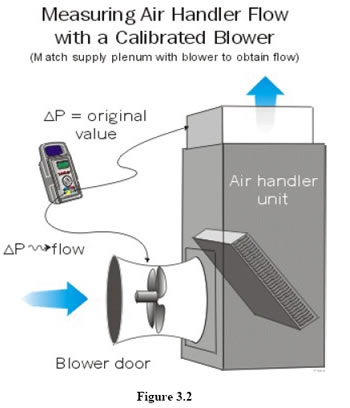 |
Calibrated fans mounted directly to the HVAC system.
The calibrated fan may be mounted directly to a portion of the HVAC
system. flow of an air handler, the following steps the supply plenum
as the system normally operates. Then remove a panel from the air handler,
attach the calibrated blower to the opening in the air handler, seal
off any remaining openings around the calibrated fan, place a barrier
at the bottom of the air handler to isolate the return side of the system,
turn on the air handler, then turn on the calibrated fan and increase
its speed till static pressure in the supply plenum is equal to that
measured previously. The air flow through the calibrated fan is equal
to the air handler flow rate (Figure 3.2).
Building as a capture tent. The building can also be
used as a capture tent. Look at an example of measuring exhaust
fan flow in a restaurant. With the exhaust fan(s) turned on (all
other air moving equipment turned off), the pressure in the building
is measured (this could be -60 pascals or greater in many restaurants).
The calibrated fan is turned on to blow air into the building until
the pressure in the building is neutral wrt outdoors. The air flow through
the calibrated fan is equal to the exhaust fan flow rate. (Note this
method works well if the building is tight or the exhaust fans are large.
Restaurants may be tight and often have large exhaust fans).
Note, however, that this is the flow rate that occurs when the building
is at neutral pressure. If the normal operating pressure (NOP) of the
building is much different
from neutral, -10 pascals for example, then the measurement of exhaust
or makeup air may be different than that which actually occurs, because
building depressurization will reduce exhaust fan flow and increase
make-up air flow. To correct for this, the calibrated fan is turned
on to move air into the buildinguntil the NOP is reached (-10 pascals);
record the flow rate through the calibrated fan (say 3600 cfm). Now
calculate the air flow rate into the building due to the -10 pascals
depressurization using the airtightness curve developed from the building
airtightness test. (Example: say C 300, n .65, then q would
be equal to 1340 cfm at -10 pascals). Exhaust fan flow is equal to flow
through the calibrated fan plus the building leakage; 3600 cfm plus
1340 cfm = 4940 cfm.
The flow of make-up air can be measured in an analogous manner. Turn
on only the makeup air fan and use a calibrated fan to pull air out
of the building until reaching NOP. Makeup air flow is then equal to
the air flow through the calibrated fan minus the air flow through the
building envelope (this assumes the NOP is negative). Alternatively,
the make-up air flow can be measured with the make-up air and the exhaust
fans operating simultaneously (note that the make-up air flow is usually
less than the exhaust air flow). If the building is at its NOP, then
make-up air is equal to exhaust fan flow minus building leakage at NOP.
If the building is depressurized beyond its NOP, then turn on the calibrated
fan to blow air into the building until it reaches its NOP. The make-up
air flow is equal to the exhaust fan flow minus building leakage minus
calibrated fan flow. Note also that in this situation, the calibrated
fan flow is equal to OAflowT (the sum of outdoor air flow and return
leaks that draw air from outdoors).
4. Project Findings
Air flow across a building envelope is a function of hole
size and pressure differential across that hole. Without a hole there
is no air flow. With no pressure differential, there is (almost)
no air flow. It is the combination of holes and driving forces which
create most uncontrolled air flows in buildings.
Mechanically induced pressure differentials are a function of the
net air flow into a space and the airtightness of that space. This applies
to occupied and unoccupied building spaces, building spaces used as
ducts, and ducts themselves.
In commercial buildings, we expected mechanically induced pressure
differentials to be the big story. And certainly they are. However,
a big concern, and a surprise to most of us, emerged -- that many small
commercial buildings have big holes, especially in the ceiling plane,
and that these big holes may be the source of substantial energy problems.
A significant number of commercial buildings are tighter than most Florida
homes (12 of 70 buildings have ACH5O less than 5). On
the other hand, a large number of commercial buildings are much leakier
than almost all Florida homes built in the last 20 years (26 of 70 buildings
have ACH5O greater than 20). On the whole, central Florida commercial
buildings are considerably more leaky than central Florida homes.
Also of considerable concern is the magnitude of problems associated
with ceiling insulation systems. Many ceiling insulation systems are
functioning poorly, because the insulation is missing, has been moved
around, or is being by-passed by uncontrolled air flow. Following is
a discussion of the major findings of this project.
4.1 General Building Information
A large portion of the project findings are contained in a single
table contained in Appendix B. The following general summary can be
presented for our sample of 70 central Florida small commercial buildings.
Average floor area was 5030 square feet. Five buildings were manufactured
(non-metal), either an office trailer or a modular office space. Four
buildings were metal. Twenty buildings were frame or predominantly frame.
The remaining 41 buildings were masonry or predominantly masonry (Figure
4.1).
Six buildings are on crawl spaces. The remaining 64 are slab-on-grade
construction.
Five are two story. The remaining 65 are one story buildings.
Nine buildings have no attic or ceiling space. The bottom of the
roof deck, in most of these cases, is the ceiling of the occupied space.
Tn two cases, the space above the ceiling is a warehouse. In other words,
this is an office space in an unconditioned warehouse. Fifteen buildings
have attics. The remaining 44 buildings have a ceiling space above the
ceiling.
There seems to be confusion among contractors about whether ceiling
spaces should be vented and about construction details at the eaves.
It is common, for example, to install perforated soffit facia while
attempting to block off the soffit space from the ceiling space by insulation
batts. The insulation batts, of course, do not stop air flow so the
ceiling space is unintentionally vented. In general, it appears that
small commercial buildings in Florida contain a hybrid of residential
and commercial construction materials and methods which often do not
make sense from the perspective of heat flow and air flow control.
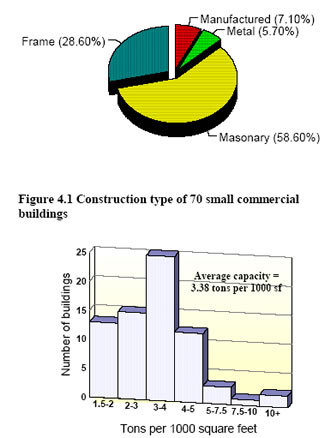 |
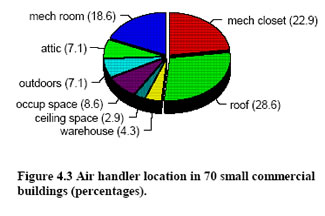 |
4.2 General HVAC Information
Cooling capacity. Cooling capacity in commercial
buildings is greater than in residential buildings. Total cooling capacity
per building ranged from 2 tons to 129 tons, with an average of 16.9
tons. Number of air conditioning systems ranged from one to eight per
building, with an average of 3.1 units per building. While Florida residences
typically have 1.5 to 2.0 tons of air conditioning capacity
per 1000 square feet floor area, the commercial buildings in our sample
averaged 3.38 tons per 1000 square feet. They ranged from 1.54 tons
per 1000 square feet to 11.1 tons per 1000 square feet. Figure 4.2 presents
a breakdown of cooling capacity for the 66 buildings for which cooling
capacity is known.
The three buildings with the highest capacity per floor area are
fast-food restaurants. Cooling capacity in these three averages 9.8
tons per 1000 square feet. Cooling capacity in all eight buildings which
are restaurants or contain restaurants (and for which we know cooling
capacity) is 6.1 tons per 1000 square feet, or twice the capacity of
the non-restaurant commercial buildings in this study. Interestingly,
the fourth largest capacity per floor area is in a 1512 square foot
dentist office with a 9 ton air conditioner.
Air handler location. Air handlers are located in mechanical rooms
in 13 buildings and in mechanical closets in 16
buildings. We define a mechanical room as a space containing mechanical
equipment (air handlers, etc.) in which persons can move around. A mechanical
closet is smaller, too small to allow persons to move around or in some
cases even enter. Air handlers are in attics in four buildings, in ceiling
spaces in two cases, and in the occupied space in six instances. Air
handlers are outdoors in five cases and on the roof in 19 cases. Air
handlers were in unconditioned warehouses in three buildings (Figure
4.3). (In eight buildings air handlers are located in two locations.
The numbers reported in this paragraph consider only the dominant location
for each building.)
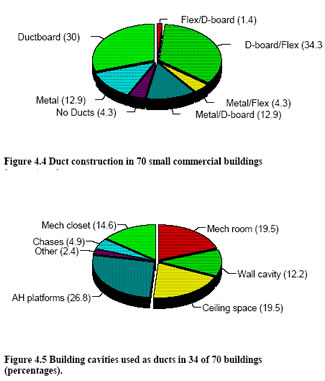 Ductwork
location. Duct systems are generally located in the ceiling
space or attic space. Some are located outdoors and some are located
in a warehouse space. The attic space and outdoors are always unconditioned.
Some ceiling spaces are conditioned and some are unconditioned. Some
warehouses are conditioned and some are unconditioned. In two buildings,
the ducts are primarily outdoors. In 48 buildings, ducts were located
in unconditioned building space, either in an unconditioned ceiling,
an attic, or an unconditioned warehouse. In 17 buildings, ducts were
located in conditioned space. Conditioned space is defined as either
the occupied space or another building space that is inside both the
air barrier and thermal barrier of the building. When ducts are located
in the conditioned space, penalties from duct leakage are greatly
minimized.
Ductwork
location. Duct systems are generally located in the ceiling
space or attic space. Some are located outdoors and some are located
in a warehouse space. The attic space and outdoors are always unconditioned.
Some ceiling spaces are conditioned and some are unconditioned. Some
warehouses are conditioned and some are unconditioned. In two buildings,
the ducts are primarily outdoors. In 48 buildings, ducts were located
in unconditioned building space, either in an unconditioned ceiling,
an attic, or an unconditioned warehouse. In 17 buildings, ducts were
located in conditioned space. Conditioned space is defined as either
the occupied space or another building space that is inside both the
air barrier and thermal barrier of the building. When ducts are located
in the conditioned space, penalties from duct leakage are greatly
minimized.
Types of ducts. Three types of duct materials dominate air distribution system construction. Nine systems were entirely metal. Twenty-one systems were entirely ductboard. None were entirely flex duct. Hybrid systems were the norm. (In the following, the dominant duct type is listed first.) Nine systems were metal with ductboard. Three were metal with flex duct. Twenty-three systems were ductboard with flex. One system was flex with ductboard. Two buildings had no ductwork (Figure 4.4).
Building cavities as ducts. Building cavities are
also used as portions of air distribution systems. In Florida single
family residences, it is common for air handler support platforms to
be used as part or all of the return air ductwork. Wall cavities, panned
floor joists, mechanical closets, dropped ceiling cavities, and spaces
below staircases are also used as ducts in homes. Since these building
cavities are almost always very leaky, they represent a large portion
of all duct leaks in existing Florida residences. In total, it is estimated
that 60% of all duct leak air flow in Florida residences occurs in building
cavities used as ducts.
It is also common to use building cavities as ducts in small commercial
buildings. In 34 of 70 buildings, one or more types of building cavities
are used as ducts (Figure 4.5). In eight buildings, the mechanical
room is used as a return plenum. In six buildings, a mechanical closet
is used as a return plenum. In most of these 14 cases, the ceiling of
the room or closet is t-bar, and in many of those cases the space above
the mechanical room is unconditioned attic or ceiling space. Since t-bar
ceilings are very leaky, it is common for these mechanical rooms or
mechanical closets to experience 20% to 40% return leakage (20% to 40%
of the systems return air is originating from leakage through the ceiling
or other leak pathsways from unconditioned space).
In five buildings, wall cavities are used as ducts or plenums. In
eight buildings, the ceiling space is used as a return plenum. In 11
buildings, air handler support platforms are enclosed to form a return
plenum, similar to what is found in many residences. In two buildings,
chases are used as return ducts. In another building, the space between
two dropped ceilings (one above the other) was enclosed to form a return
plenum. In this case, one of the ceiling tiles in the upper ceiling
had been removed and as a result there was an enormous return leak drawing
from an unconditioned ceiling space (CFM25 for that leak site alone
was about 4000). Even if all the tiles had been in place, there would
still be considerable leakage from the unconditioned ceiling space because
t-bar panel construction of the top portion of this plenum was very
leaky. (Note that while 34 buildings use building cavities as ducts,
the total of the various building cavity types comes to 41 because more
than one building cavity type exists in 7 buildings.)
In general, use of building cavities as ductwork is poor practice.
Building cavities virtually always leak, and in many cases the leakage
can be very severe. Ceiling spaces used as return plenums can be a significant
exception to this general rule. If the negative pressure in the ceiling
space is fairly small (which is what we observed in most builings) and
the ceiling space is reasonably tight to unconditioned spaces (which
we found in some cases), then leakage associated with use of the ceiling
space as a plenum can be relatively small. It is possible to design
the ceiling return plenum to operate at neutral pressure with respect
to outdoors. If outdoor air pressurizes the building to +2 pascals,
for example, and the plenum runs at -2 pascals with respect to the occupied
space, then the plenum will be at neutral pressure with respect to outdoors.
Consequently, the plenum can experience next to no duct leakage. (Note
that we have observed ceiling return plenums in several buildings operating
at positive pressure with respect to outdoors, so in effect these return
plenums are experiencing “supply leaks”.)
On the other hand, if ceiling space return plenums are rather leaky
to outdoors and are significantly depressurized wrt outdoors, then use
of the ceiling space as a return plenum will produce substantial air
distribution system leakage. Use of the ceiling space as a return plenum
can also be poor practice if the roof has little insulation R-value.
Outdoor air. Twenty-seven buildings have outdoor air. “Outdoor
air” is air intentionally drawn into (or pushed into, if there is a dedicated
outdoor air fan) the return side of the air distribution system and is generally
designed to provide ventilation for occupants in the space. The other 43 buildings
do not have outdoor air. They rely on naturally occuring infiltration, leakage
in the distribution system, or operation of exhaust fans to bring in ventilation
air.
Outdoor air only occurs when the air handler is on. Therefore, when
the air handler is off, either because the system has been turned off,
or the air handler has cycled off with the compressor, outdoor air ceases,
building pressure will decrease, and the building ventilation rate may
decrease.
Make-up air. Five buildings have make-up air. “Make-up” air
is mechanically induced air blown into the building simultaneously with the
operation of the exhaust fans. It is filtered, but in most cases (and in
all five cases found in this study) it is unconditioned. Typically the same
control switch activates both the make-up air and the exhaust air. Make-up
air is designed to reduce the air flow imbalance on the building and thereby
reduce space depressurization and space conditioning energy use. Typically
make-up air is designed to be 75% to 80% of the flow rate of the
exhaust fans (Gaylord Industries, Inc. Smoke Pollution Control Ventilator
Model CG-AB-SPC technical bulletin).
As can be seen in Table 4.1, make-up air is substantially undersized
in the five restaurants that have make-up air, averaging only 50% of
exhaust air flow. Outdoor air is insufficient to make up the balance,
averaging only 12% of exhaust air flow. Combined, make-up air and outdoor
air represent only 62% of total exhaust air. As a consequence, these
buildings operate at negative pressure.
TABLE 4.1.
Building air flow and pressure imbalance in five commercial
buildings which have make-
up air and which contain restaurants. Note that while make-up air
operates when the exhaust fans operate,
outdoor air may or may not occur
when the exhaust fans
operate. Therefore, the net air flow balance may actually be worse
than indicated.
ID # |
building |
EA |
MA |
OA |
NET |
dP |
32 |
golf club house |
-3038 |
1107 |
0 |
-1931 |
-6.1 |
67 |
hotel |
-12907 |
5140 |
815 |
-6952 |
-3 |
22 |
sub restaurant |
-5603 |
3220 |
1450 |
-933 |
-25 |
35 |
chicken rest. 2 |
-9222 |
5110 |
1250 |
-2862 |
-8 |
33 |
chicken rest. 1 |
-10616 |
6157 |
2253 |
-2206 |
-43 |
average |
-8277 |
4147 |
1154 |
-2977 |
-17.0 |
In four other buildings containing restaurants, there is no mechanically
induced make-up air. In one case, the kitchen exhaust fans are not operated
at all (building #19). In another, an exterior kitchen door is left
open throughout the day thereby reducing building depressurization from
-26 pascals to -4.6 pascals (building #62). In the third, the building
is depressurized to -1.8 pascals and passive make-up air comes primarily
through the leaky t-bar ceiling from a residential-type attic (building
#69). In the fourth, the exhaust fan operates 8 to 10 hours a day. After
the duct leaks were repaired, the exhaust fan caused depressurization
of -1.8 pascals and most of the passive make-up air comes through a
leaky interior knee-wall facade above the bar (building #3 1). (See
section 5.5.9 for additional discussion of building #31.)
Exhaust fans. Forty-three buildings have exhaust
fans that discharge air from the occupied space to outdoors. There
are a few additional buildings that have exhaust fans that discharge
air into ceiling spaces that are within the air barrier of the
building. Operation of these latter fans does little to affect
building ventilation rates or pressure differentials. The size
of exhaust fans (building total) in these 43 structures varies
from as little as 44 cfm to as much as 10,606 cfm and averages
1767 cfm. In some buildings the exhaust fans operate virtually
whenever the building is occupied, including restaurants, sports
facilities, and some other buildings. In others, the exhaust fans
are manually operated, either wired into the light switch or on
a separate switch, and their operation time is then a function
of user interaction.
4.3 Ducts Are Leaky
Testing of duct system airtightness was done in 46 of the
70 buildings. In a majority of these buildings, ducts were found
to be very leaky. On average, CFM25 (air flow through leaks when
the ducts are depressurized to -25 pascals) was 1209, or 341 CFM25
per 1000 square feet of floor area. By comparison, leakage in 100
central Florida residences (old and new together) was only 116 CFM25
per 1000 square feet, or about one-third as much (Cummings, Tooley,
and Moyer, 1991). Note that the ducts measured for airtightness excluded
ceiling return plenums in all but one case (building 17).
One factor that affects the amount of duct leakage is that commercial
buildings have about twice the installed cooling capacity per 1000 square
feet, so ducts in commercial buildings should have about 45% greater
surface area. Nevertheless, even considering that difference, duct leakage
in these small commercial building is disproportionately much greater
than in residences. Note that SMACNA (Sheet Metal and Air Conditioning
Contractors Natiohal Association) has set a leakage standard for ductwork
that is much tighter than what is found in residences or commercial
buildings. For Class 6 ductwork (ductboard, flex duct, and other sealed
ducts), the standard expects 1.2 CFM25 per 100 square feet of duct surface
area. For a typical residence, this might be 3 CFM25 per 1000 square
feet of floor area. In commercial buildings, this might be 5 CFM25 per
1000 square feet of floor area. Therefore, duct systems in small commercial
buildings are about 70 times more leaky than the SMACNA standard.
While the excessive leakiness of commercial duct systems is evident,
the impact of duct leakage on energy consumption is not as clear. In
some buildings, we expect that duct leaks have little impact on energy
consumption when the ducts are fully inside the building. When they
are outside the building or in an attic, the energy penalties should
be quite large. However, when the ducts are partly inside the building,
that is, they are inside either the primary air barrier or the primary
thermal barrier, the energy impacts are less certain. We anticipate
that a significant amount of energy lost from the duct leaks will be
recovered in this scenario.
Energy savings from repair of UAF was examined by repairing UAF in
20 of the 70 buildings. Energy consumption in these 20 buildings decreased
by an average 15%. There are still many questions to be answered about
the savings that are likely to result from repair when the ducts are
in. various environments. The candidates selected for energy monitoring
generally had ducts that were outside the conditioned space and therefore
would be likely to experiencc significant energy savings.
A number of factors dictate what, the energy costs of duct leakage
will be. Not all duct leaks are created equal, even those that are the
same size. The impact of duct leakage depends upon whether the ducts
are completely “inside” the building, partially “inside” the
building, outdoors, or -- in the worst case --‘ in a ceiling or
attic space that is outside the air and thermal barrier ‘of the
building. By “inside the building” we mean inside the primary
air barrier, inside the primary thermal barrier, or inside both the
air barrier and the thermal barrier. If the duct leaks occur in a space
that is outside the building air and thermal barriers, then only a small
portion of the energy lost by duct leaks may be recovered. If the ceiling
space is inside the air and thermal barrier, then we expect that the
majority of lost energy is covered to the occupied space.
Note that being located in an attic is even worse than being located
outdoors. Attics are generally hotter than outdoors, especially during
the portions of the day when air conditioning system operate the most.
Therefore, any air drawn into duct leaks will be hotter (and generally
have a higher dewpoint temperature) than outdoors.
Another factor to consider is the direction of mechanically driven
air flow. Consider this example. Building 35; a fast food restaurant
serving chicken, had a completely disconnected supply duct discharging
approximately 500 cfm of air into the ceiling space. Insulation batts
were located on top of the ceiling tiles. Kitchen exhaust fans were
drawing about 9200 cfm of air from the restaurant’ while, on average,
make-up air fans and outdoor air were discharging about 5800 cfm into
the restaurant. The net air flow imbalance caused the entire restaurant
to be depressurized to -43 pascals. This negative pressure was sucking
air into the building from all directions, including from the ceiling
space. Therefore, the approximately 500 cfm of supply air that was being
dumped into the ceiling space would be almost immediately drawn into
the occupied space. What portion of the lost energy was being recovered?
25%? 50%? 75%? 100%? We do not know. What would be the energy savings
that would result from repairing that large duct leak? Again we do not
know. Before retrofit programs can effectively determine which duct
systems should be repaired, more investigation needs to. be done to
understand the energy losses ‘associated with duct leakage in
various types of ceilings spaces.
Consider another example, building 69. This is a convenience store
with a small kitchen. A kitchen exhaust fan draws 1546 cfm from the
building and depressurizes the space to -1.8 pascals. Since nearly all
of the building leakage is in the ceiling, nearly all of the air drawn
into the building comes from the vented, residential style attic. Since
this air may be .11 OF or hotter in the summer, the’ energy impacts
will be great. Consider, however, if make-up and outdoor air were added
to the building so that it ran at a slight positive pressure, say +0.5
pascal. Air would then be passing from the occupied space into the attic.
Under this new condition, cooling energy use would be much reduced.
Savings are
greatest from make-up air, because this air does not need to be conditioned
before being injected into the building and when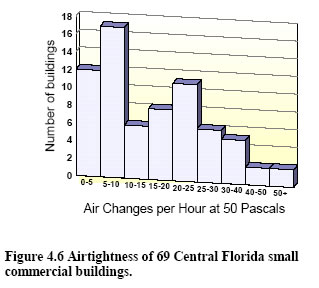 properly
designed, a large proportion of the make-up air is drawn directly into
the exhaust air stream and is not distributed more generally into the
occupied zones. Savings are also significant with outdoor air (compared
to drawing air from the attic). Both outdoor air and air drawn in from
the attic must be conditioned, but the air from outdoors is cooler and
generally drier than air from the attic.
properly
designed, a large proportion of the make-up air is drawn directly into
the exhaust air stream and is not distributed more generally into the
occupied zones. Savings are also significant with outdoor air (compared
to drawing air from the attic). Both outdoor air and air drawn in from
the attic must be conditioned, but the air from outdoors is cooler and
generally drier than air from the attic.
4.4 Ceilings Are Leaky
Commercial buildings, on average, are leaky, and the primary
location for building leakage is the ceiling. ACH5O, the air exchange
rate of the building when depressurized to -50 pascals by
a blower door, averages 16.7, about 50% greater than Florida
residences, and about 150% leakier than new Florida residences.
Not only are these commercial buildings more leaky than residences,
the range of leakiness is much greater. As can be seen in Figure
4.6, there is a bi-polar distribution of building airtightness, with
peaks at the 5 to 10 ACH5O bin and at the 20 to 25 ACH5O
bin.
This twin peak occurs, we believe, because of t-bar suspended ceilings
which are used in the greatest majority of commercial buildings. (In
our sample, 54 of 70 buildings have suspended, t-bar ceilings.
Six of the remaining 16 have no ceiling other than the bottom of the
roof deck. Six have gypsum board. Four have some other form of ceiling
tiles but are not suspended on t-bar framework.) These suspended ceilings
are very leaky, because of cracks, joints, penetrations, openings, vented
light fixtures, and duct leaks.
Since the ceilings are almost always leaky, it is what is happening
above the ceiling level that determines in most buildings whether they
are very tight or very leaky. In almost all cases, a very leaky building
is leaky because the space above the ceiling has large leak pathways
to outdoors, sometimes intentionally and sometimes unintentionally.
If the building is very airtight, it is because this space above the
ceiling is quite tight to outdoors.
There appears to be some confusion on the part of builders and architects
about whether ceiling spaces should be vented or not. It is common,
for example, for small commercial buildings to have vented soffits under
the eaves (with a flat or sloped roof), openings from the eaves into
the ceiling space, and insulation batts filling those openings. Since
the batts do not create a tight air barrier, air can flow through and
around the batts. It is not clear whether the builder intends for ambient
air to flow through the ceiling space or not. Based on our understanding
of energy and moisture control issues, we suggest that the air and thermal
barriers of the building be located at the roof deck and that the ceiling
space be made airtight with respect to outdoors.
Single family homes in Florida have become increasingly more airtight
over time, as can be seen in Figure 4.7 (Cummings, Tooley, Moyer, 1991).
By contrast, commercial buildings in Florida do not show a significant
trend toward airtightness (Figure 4.8). Those built in the past 10 years
are only slightly more airtight than the entire sample; 14.5 ACH50 in
the past 10 years versus 17.7 ACH50 for buildings more than 10 years
old. Commercial buildings built in the past 10 years are twice as leaky
as home built in the past 10 years. Homes built since 1985 have an average
ACH50 of about 7 while commercial buildings have an average ACH50 of 14.5.
Some attempts were made to measure ceiling airtightness. ifi one facility,
an office space is located inside a warehouse. Three exterior walls face outdoors,
one wall faces into the warehouse, and the ceiling is exposed to the warehouse.
Blower door tests were done, once with the office at -50 pascals and the warehouse
at neutral (both with repect to outdoors) and a second time with the warehouse
also depressurized to -50 pascals. By sealing obvious leak sites in the one
wall facing the warehouse and assuming that remaining leakage in that wall
was negligible, we calculate that ceiling leakage is 5.49 CFM5O/ft2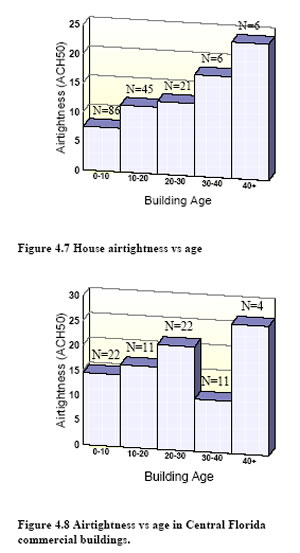 .
For the entire 360 square feet of ceiling area, CFM5O equals 1976, or 86% of
total CFM5O. Measurements found that the ceiling surface area breaks down to
76.7% suspended ceiling (t-bar and tiles), 17.8% fluorescent light fixtures,
4.4% supply grills, and 1.1% return grill. Ceiling airtightness was measured
with the duct registers and grill sealed off, so duct leakage is not included
in this number. Results from testing in several other buildings indicate similar
ceiling leakage.
.
For the entire 360 square feet of ceiling area, CFM5O equals 1976, or 86% of
total CFM5O. Measurements found that the ceiling surface area breaks down to
76.7% suspended ceiling (t-bar and tiles), 17.8% fluorescent light fixtures,
4.4% supply grills, and 1.1% return grill. Ceiling airtightness was measured
with the duct registers and grill sealed off, so duct leakage is not included
in this number. Results from testing in several other buildings indicate similar
ceiling leakage.
4.5 Ventilation and Infiltration Rates
In most residences, ventilation is not provided intentionally. It
results from natural infiltration (wind and stack driven infiltration), duct
leakage, operation of exhaust fans and exhaust equipment, and to a small extent
the operation of combustion equipment. Tests in 160 central Florida homes found
natural infiltration (air handler and exhaust systems turned off) of 0.28 ach
(air changes per hour). When the air handlers were turned on, infiltration
increased to 0.91 ach (Cummings, Tooley, and Moyer, 1991), indicating that
homes have substantial duct leakage and that mechanically driven infiltration
dominates.
As indicated in the previous section, commercial buildings are quite
leaky. This shows in passive infiltration rates. In the 55 buildings
in which an “air handler off’ test was done, passive ventilation
averaged 0.43 ach. For these same 55 buildings, ACH5O averaged 17.66.
The ratio of ACH5O to natural ach is 41. In a sample of 99 central Florida
homes, the ACH5O to passive ach ratio was 39 (Cummings, Tooley, and
Moyer, 1991). In a sample of 70 new Florida homes, this ratio was 35. The
general rule for central Florida buildings, then, is that passive infiltration
can be predicted (on average for a large sample) by dividing ACH5O by
40, for both residences and small commercial buildings. (Note:
it must be recalled that passive infiltration varies considerably depending
upon wind and temperature conditions at the time of the test.)
In commercial buildings, ventilation is often provided intentionally.
Twenty-seven buildings have outdoor air, which intentionally ventilates
the space when the air handlers operate. Forty-three buildings have
exhaust fans that discharge air to outdoors. In some buildings the exhaust
fans operate virtually all the time that the building is occupied, including
restaurants, sports facilities, and some other buildings. In others,
the exhaust fans are manually operated, either wired into the light
switch or on a separate switch, and there operation time is then a function
of user interaction.
When the air handlers are operating and exhaust fans are in their
normal operating mode, the ventilation rate averaged 1.24 ach in 68
buildings (unavailable in two buildings). Note, however, that air handlers
do not operate continuously in a majority of these buildings, so the
actual “as operated” ventilation rates will be somewhat
smaller.
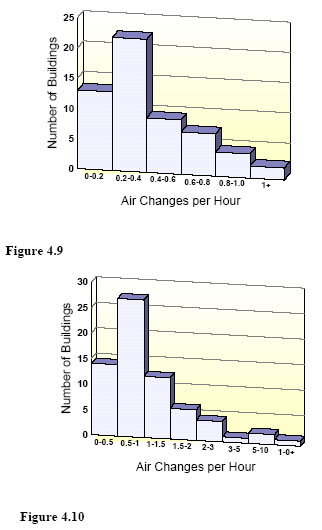 |
Note that “AH on” ventilation rates are much lower in the 55 buildings
for which a passive infiltration test was done. The 13 buildings for
which a passive infiltration test was not done are, to a large extent,
restaurants and other buildings with large exhaust fans, outdoor air,
and make-up air. It is more difficult to obtain the “AH off’ test
in these buildings because the business owners want
the equipment on all the time, especially the kitchen exhaust fans.
AHon ventilation in the 55 buildings was 0.85 ach. Passive
and mechanically induced ventilation varies substantially from one building
to another. Figure 4.9 graphically displays the distribution of ventilation
for the sample of 55 buildings for which AR off infiltration
tests were done. Figure 4.10 graphically displays the distribution of
ventilation for the sample of 68 buildings for which AH on ventilation
tests were done.
Figure 4.11 illustrates passive infiltration rates versus building
airtightness and shows that in general tighter buildings have lower
passive infiltration rates.
4.6 Air and Thermal Barriers Are Often Separate
In small commercial buildings, the primary air barrier and primary
thermal barrier in the ceiling/roof plane are often separated. The primary
air barrier may be located at the roof deck (38 of 68 cases) or at the
ceiling plane (30 of 68 cases). The primary thermal barrier may be located
at the roof deck, on top of the ceiling tiles, or suspended from the
trusses. (By ‘primary -- referring to air or thermal barriers
-- we mean that this air or thermal barrier provides greater resistance
to air or heat flow compared to any other barriers that may be in series.)
By contrast, the ceiling air and thermal barriers in residences are
almost always in the same plane. The ceiling gypsum is the air barrier
and the thermal barrier (insulation) lies on top of the gypsum.
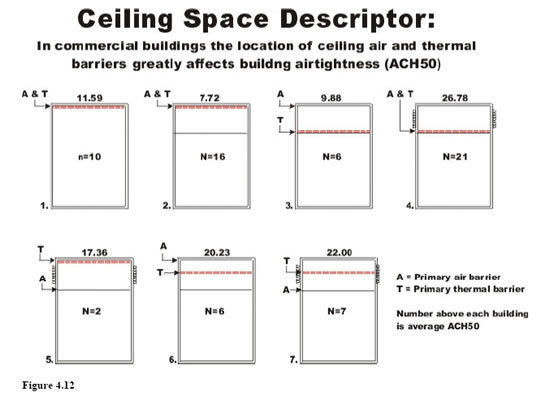
In small commercial buildings we have identified seven different ceiling/attic space configurations. These configurations are defined by the location of the air and thermal barriers. These configurations also define the type of conditions that likely exist in the space above the ceiling. These configurations are illustrated in Figure 4.12.
- The roof deck is the primary air and thermal barrier of the building. The roof deck is also the ceiling of the occupied space. There is no enclosed ceiling space.
- The roof deck is the primary air and thermal barrier of the building. Suspended tbar panels form the ceiling of the occupied space. The ceiling space is cool and dry. (Note that ceiling space descriptors refer to summer conditions during hot/humid weather).
- The roof deck is the primary air barrier of the building. In some cases the ceiling space is very airtight to outdoors. In other cases the ceiling space may be considerably ventilated to outdoors. However, the leakiness of the ceiling space to outdoors is less than the leakiness of the ceiling. The primary thermal barrier of the building is insulation positioned on top of the ceiling panels. The roof deck may have R-value, but its thermal resistance is less than that located at the ceiling. Suspended t-bar panels form the ceiling of the occupied space. The ceiling space is hot and dry. The degree of heat in the ceiling space depends upon the R-value inherent in the roof construction and the color of the roof surface.
- The ceiling of the occupied space is the primary air and thermal barrier of the building. The ceiling or attic space is ventilated, intentionally or unintentionally, such that the leakiness of the ceiling or attic space to outdoors is greater than the leakiness of the suspended ceiling. Suspended t-bar panels form the ceiling of the occupied space. The ceiling space is hot and humid.
- This is the reverse of #3. The suspended ceiling is the primary
air barrier while the thermal insulation is located at the roof deck. The
ceiling space is warm and humid.
This is an unusual case. For the suspended ceiling to be the primary air barrier requires that the ceiling space be well ventilated to outdoors (because t-bar suspended ceilings are so leaky). What makes this case unusual and surprising is that it makes little sense to place insulation at the roof deck when air can flow freely through the ceiling space from outdoors. Only two of the buildings tested in this project qualify as category 5. Uncontrolled air flow in one of these buildings was repaired by sealing the ventilation that existed in the ceiling space. In other words, we moved .the building air barrier from the fairly leaky suspended ceiling to the roof deck. Total building ACH5O decreased dramatically from 24.9 to 6.4. - The roof deck is the primary air barrier but the thermal barrier
is “floating. This occurs when the insulation bails are neither
at the roof deck or on top of the ceiling but rather are attached
to the bottom of the truss system. Often the insulation bails are
located only 8” to 1.” above the ceiling tiles. In other
cases, they may be suspended three feet or more in the air. In
a significant number of the test buildings, insulation batts were
falling partially or completely from the bottom of the trusses onto
the ceiling space below. The space above the insulation is hot and dry. Depending
upon the amount and direction of air flow through the suspended insulation,
the space between the ceiling and the insulation may be hot and dry,
warm and dry, or cool and dry.
Four of the six buildings that fall into category 6 have attics. In spite of the fact that the attic spaces are intentionally vented, the roof deck is the primary air barrier. This is remarkable, and means that the ceiling plane is very leaky. It also means that in many of these buildings there is almost no air barrier in the ceiling/roof plane of the building. Though we may call the ceiling or roof deck a primary air barrier, this only means that it is tighter than the other. Both may be very leaky. - The suspended ceiling of the occupied space is the primary air barrier and the thermal barrier is floating. The fact that the suspended ceiling is the primary air barrier means that the space above the ceiling (almost always an attic) is well vented to outdoors. As with category 6 building, parts of the insulation in category 7 buildings may have also fallen.
Table 4.2 illustrates that buildings with leaky or ventilated ceiling spaces are generally considerably more leaky than those with no ceiling space or those where the roof deck is the primary air barrier. Figure 4.12 illustrates the seven identified ceiling barrier configurations. As indicated earlier, commercial buildings are generally quite leaky, and the most important determinant is leakiness of the ceiling space to outdoors.
Table 4.2
Types of ceiling spaces as defined by the location
of the air and thermal barriers in 68 buildings.
Ceiling Barrier Configuration |
#buildings |
ACH50 |
|
1 |
no ceiling space | 10 |
11.59 |
2 |
inside A&T barriers | 16 |
7.72 |
3 |
inside A, outside T | 6 |
9.88 |
4 |
outside A&T | 21 |
26.78 |
5 |
inside T, outside A | 2 |
17.36 |
6 |
inside A, part inside T | 6 |
20.23 |
7 |
outside A, part inside T | 7 |
22.00 |
In ceiling barrier configurations 1, 2, 3, and 6 (total of 38 buildings), the roof deck is the primary air barrier. That does not mean the roof deck and exterior walls above the ceiling level are completely airtight or even very airtight. It just means that they are tighter than the suspended ceiling. Those buildings where the roof deck is the primary air barrier have an average airtightness of 11.0 ACH50.
In ceiling barrier configurations 4, 5, and 7 (total of 30 buildings), the suspended ceiling (or in a few cases the gypsum board ceiling) is the primary air barrier. Those buildings where the ceiling is the primary air barrier have an average airtightness of 25.9 ACH50. As indicated earlier, this greater leakiness is caused by the leakiness of the ceiling space (or attic space) to outdoors.
4.7 Problems That Result From Separate Air and Thermal Barriers
Ideally, the thermal and air barriers should be located
in the same plane, and those barriers should be sufficiently effective
to stop most heat and air flow into the building. The heat flow resistance
of the primary thermal barrier and the air flow resistance of the
primary air barrier should be great enough to minimize space conditioning
energy loads. A substantial proportion, however, of the small commercial
buildings examined in this study have inadequate thermal and air
flow resistance in the ceiling/roof plane of the building. Following
is a discussion of the pros and cons of the various categories related
to the location of the ceiling air and thermal barriers. (Note: categories
in the following discussions are as shown in Figure 4.12.)
Categories 1 and 2. The 10 buildings that fall into category
1 and the 16 buildings that fall into category 2 have air and thermal
barriers at the roof deck. In almost all of these cases, the air
barrier is effective. Average airtightness for these buildings
is 9.2 ACH5O. The thermal barrier is also likely to be effective,
because it is located at the primary air barrier, so air transported
heat does not have an opportunity to pass through the insulation.
In this study, we have almost no information about the insulation
levels that exist in the roof construction; all we could see was
the bottom of the roof deck and the top of the roof membrane. Nevertheless,
we feel that in most of these cases the building envelope (in terms
of both air and thermal barriers) is working quite well, especially
in comparison to the following categories.
Categories 3 and 6. The six buildings that fall into category
3 and the six buildings that fall into category 6 may have significant problems.
The roof deck is the primary air barrier. This means, however, only that leakage
from the ceiling or attic space to outdoors is smaller than the leakage across
the ceiling. Note that four of the six category 6 buildings have vented attics!
Even though the attic spaces are vented to outdoors, the attic is still more
airtight (to outdoors) than the suspended ceiling. In other cases, the ceiling
space may be very tight to outdoors. Two examples are a video productions office
building (building #6) and a fast food restuarant (building #22) which have
ACH5Os of 3.7 and 3.9, respectively.
Since the primary thermal barrier is located on top of the ceiling
tiles, the space above the insulation may become quite hot on summer
days. The extent of the heat penetration into the ceiling space (or
attic space) depends upon the thermal resistance of the roof construction.
(While the roof may not have insulation materials, nevertheless flat
roofs often have significant thermal and mass characteristics related
to materials used in its construction.) Heat in this ceiling space can
be easily transported into the occupied space by means of duct leakage
or air flow through the permeable t-bar ceiling by several types of
driving forces, including wind, return duct leaks, supply duct leaks,
closed interior doors, and exhaust fans.
Category 4. Like categories 1 and 2, category .4 buildings
have the air and thermal barriers located in the same plane, but both barriers
are at the ceiling. This is important because in nearly all cases (18 of the
20 cases), the primary air barrier is a suspended t-bar ceiling, and t-bar
ceilings are very leaky. Therefore, even though the ceiling is the primary
air barrier (i.e., it is tighter than the ceiling space to outdoors interface),
it is nevertheless quite leaky.
Therefore, air can easily be transported from the hot ceiling space
above the insulation into the occupied space by various driving forces
such as wind, duct leakage, closed interior doors, and exhaust equipment.
By contrast, if the air and thermal barriers are located at the roof
deck, then the ceiling space will stay cool and mechanically driven
air flow across the suspended ceiling will have very little impact on
building energy use.
Category 5. In this category, which is rather
rare, the ceiling space or attic space is fairly well ventilated
(such that the t-bar ceiling is the primary air barrier), but the
insulation is at the roof deck. The insulation may stop most of
the heat flow through the roof into the ceiling space, but air
from outdoors is free to flow through this space. The ceiling space
is likely to be warm and humid. This may result in elevated cooling
energy use and possible moisture problems as humid air comes into
contact with cool building surfaces, especially the ceiling tiles.
Category 7. This is very similar to category 4,
except the insulation is floating” above the ceiling tiles
(attached to the bottom of the trusses). This configuration has
all the problems of category 4, but is even worse because in many
cases some of the insulation batts have fallen (partly or completely)
from the bottom of the trusses onto the ceiling tiles below. This
leaves large gaps in the insulation barrier and thus allows air
to flow freely through the insulation barrier.
4.8 Insulation Problems
The location of insulation in the ceiling/roof plane of the building
has important implications. In 29 buildings, insulation was located
at the roof deck, either integral to the roof construction or attached
to the bottom of the decking. In 28 buildings, insulation was located
on top of the ceiling. In 13 cases, insulation was attached to the bottom
of attic trusses and therefore was ‘floating” between the
ceiling and roof.
In general, locating insulation at the roof deck is the best choice.
In all but one building, this means the air and thermal barriers .are
at the same location. As a consequence air flow and heat flow (in the
plane of the ceiling) is well controlled. Additionally, this keeps the
ceiling space cool and dry which in turn minimizes the energy impacts
of other types of uncontrolled air flow which may exist in the building.
Insulation located on top of the ceiling tiles can be a problem,
for two reasons.
- In many cases, insulation batts have been moved around as persons
lift ceiling tiles to gain access to the ceiling space. Over time,
the number of insulation batts shifted from their place increases
as more persons access the ceiling space to run wires and work
on mechanical systems. This leads to substantial insulation voids
which significantly reduce the overall insulation system thermal
resistance.
Insulation voids also exist at light fixtures. In many ceilings, light fixtures represent
10% to 15% of the total ceiling area. In other cases, portions of the ceiling have
simply not been insulated. It is not unusual to find voids due to light fixtures,
moved batts, and installation oversight reaching 20% to 30%, and in some cases
50% or more.
- Air can pass through the leaky ceiling and through the insulation. The amount of heat that enters the occupied space depends upon the amount of ambient heat that enters the ceiling or attic space and the extent of driving forces that move air across the ceiling. Exhaust fans can depressurize the occupied space causing hot air to be readily drawn into the building. Closing interior doors (when the return is located in the central zone) pressurizes the closed rooms and depressurizes the central zones, thus transporting significant amounts of hot air across the ceiling. Return leaks, if the return leakage occurs in the ceiling or attic space, can transport hot air into the occupied space. Supply leaks can depressurize the occupied space and cause considerable amounts of ceiling space air to be drawn into the occupied zone. Mechanical rooms used as return plenums are depressurized and thus can draw considerable amounts of air from the ceiling space/attic space into the occupied zone.
Insulation attached to the bottom of attic trusses generally has problems.
Often insulation batts partially or completely detach from the trusses
and fall to the ceiling below (often 6 inches to 36 inches), leaving
significant gaps in the insulation system. Even if the batts remain
attached to the trusses, air can flow through this thermal barrier.
With a ventilated attic above and a leaky t-bar ceiling below, there
is great potential for hot attic air to move into the occupied zone
and conditioned air to flow out of the building.
Insulation may be located at the roof deck, but the ceiling space
is intentionally or unintentionally vented. The insulation may be effective
in rejecting the solar load coming through the roof deck, but air transported
heat from outdoors bypasses the insulation, so its overall effectiveness
is greatly reduced.
4.9 Exhaust Air/Make-up Air Imbalance
Forty-five of the 70 buildings have exhaust fans that discharge
air from the building. There are a few additional buildings that
have exhaust fans that discharge air into ceiling spaces that are
within the air barrier of the building. The exhaust systems flow
rates range from a low of 44 cfm to 12,907 cfm per building. Normalized
to floor area, flow rates range from 5 cfm per 1000 square
feet to 3355 cfm per 1000 square feet. On average, exhaust fans in
these 45 buildings move 362 cfm per 1000 square feet out
of the building.
Restaurants generally are at the high end of the exhaust fan air
flow rate spectrum. In fact, in this sample of 70 buildings, the eight
highest exhaust “cfm per 1000 square feet” are restaurants
or buildings that contain restaurants (hotels, golf club house, convenience
store). These eight range from 411 to 3355 cfm per 1000 square feet,
with an average of 1521 cfm per 1000 square feet of floor area. One
other restaurant, actually a stop-and-go gas station/convenience store
with a kitchen area, has exhaust flow of 375 cfm per 1000 square feet.
The remaining 35 building having exhaust fans have an average exhaust
air flow of 100 cfhi per 1000 square feet.
Exhaust fans tend to depressurize buildings. The greater the exhaust
flow rate and the tighter the building, the greater the depressurization.
In some buildings the exhaust fans operate only intermittently and are
typically occupant controlled. In other buildings the exhaust fans operate
continuously or almost continuously.
Space depressurization may be off-set by outdoor air or make-up air.
Outdoor air is generally an intentional return leak drawing air from
outdoors when the air handler is operating, and is generally, intended
to meet ventilation requirements. In some cases outdoor air is induced
by its own blower but still operates only when the air handler operates.
Makeup air, by contrast, operates only when the exhaust fans are operating
and is intended to make-up for air drawn out of the building by the
exhaust fans. It pushes (generally unconditioned) air into the building
in proximity to the exhaust fan intakes so that less conditioned building
air is exhausted from the building. Its purpose is to reduce space depressurization,
allow downsizing of space conditioning equipment, improve indoor humidity
and thermal comfort, and reduce space conditioning energy use.
Twenty-five of the 45 buildings with exhaust fans have outdoor
air. In most small commercial buildings, outdoor air is intermittent
because the air handlers cycle according to load. In other cases, the
air handlers may run continuously but have variable speed, and as a
consequence outdoor air varies with load as well, In buildings where
exhaust fans operate continuously for extended periods, outdoor air
is therefore not a reliable means to avoid excessive space depressurization.
Make-up air can be quite useful in avoiding excessive space depressurization.
Since it operates whenever the exhaust fans are operating, the building
air flow balance can be controlled and predictable. Two problems exist,
however. 1) Most buildings do not have make-up air. Of the 45 buildings
that have exhaust fans that discharge to outdoors, only five have make-up
air. These five are all restaurants. Four other restaurants do not have
mechanically induced make-up air. 2) Make-up air flow is substantially
less than exhaust air flow. By design, make-up air is set at only 60%
to 80% of the flow rate of the exhaust fans, so that the kitëhen
area will be depressurized with respect to the dining area. This will
cause heat, humidity, and odors from cooking operations to move from
the dining area toward the kitchen, and not vice versa.
For example, if the kitchen exhaust fans move 10,000 cfm, the make-up
air fan may move only 7000 cfim Thus there is a 3000 cfm net deficit,
so the building will be depressurized. In some cases, outdoor air can
make-up some or all of the remaining imbalance. As indicated, since
the air handlers may cycle with load, outdoor air may therefore operate
only a portion of the time and net air flow and building pressure may
fluctuate up and down.
In the case study of the chicken restaurant 1 (building #33), air
flow and pressure imbalance exists because the four air handlers cycle
on and off according to load. As a consequence, building pressure fluctuates
up and down in. a stair-step fashion throughout the day as air handlers
cycle on and off, ranging from -3 pascals when all are on to -18 pascals
when all are off (Figures 13 - 15). During the afternoon hours of hot
summer days, most of the outdoor air is operational, and building pressure
is in the range of -3 pascals to -8 pascals. During cool morning hours
in the spring and fall, three or even all four of the air handlers may
be off and the pressure in the building will be in the range of -13
pascals to -18 pascals. Late at night when the thermostats are set to
higher levels in order to save energy overnight, all four air handlers
(and the outdoor air) shut off and building pressure goes to a consistent
-18 pascals. As reported in the case study, this space depressurization
has lead to considerable mold and mildew growth on the interior walls,
backdrafting of the water heater, and flame roll-out from the water
heater on two occasions.
4.10 Variable Air Volume Systems
Variable air volume (VAV) systems impact internal air flows, ventilation
rates, and building pressure differentials. Instead of cycling on and
off to meet load, these systems vary air flow through individual air
terminal boxes and through the main air handler in response to changes
in cooling or heating load. In VAV systems, total air flow through the
air handlers varies, either because of variable speed drive or inlet
vane damper control. In many systems, as a consequence, outdoor air
flow rates also vary because depressurization on the return side of
the system varies as a function of the air handler flow rate. In other
cases, outdoor air may be fairly constant because it has its own blower
to induce flow. When outdoor air fluctuates, primarily as a function
of load, the building ventilation rate can change and the net air flow
into the building can change. In many buildings, exhaust fans operate
continuously and at a constant rate. Therefore, it is possible that
building pressure can flip- flop back and forth between positive and
negative pressure as a function of VAV operation. Our observations are
based on testing in three buildings which have VAV systems, including
one which was a large 145,000 square foot central Florida office building
not tested as part of this project. Additional research into VAV systems
and the impacts of their operation upon building air flow balance and
pressure differential is needed.
4.11 Failure of Design
In many small commercial buildings, it appears that HVAC systems
are not designed in any detail. Rather, they are simply installed by
the HVAC contractors. In many cases, layout of ductwork, sizing of exhaust
fans, settings of outdoor dampers, and even whether outdoor air is provided
is left up to the contractor and/or the installing technicians. As commercial
buildings get progressively larger, the proportion with detailed HVAC
design and specifications increases.
In other cases, HVAC designs are flawed. Provision of return air,
fOr example, is often left to chance. Returns are often located in central
zones of buildings with little or no provision for return air to get
from closed rooms to those returns. Significant pressure imbalances
may result. In many commercial buildings, the ceiling space is used
as a return plenum. If the ceiling space is significantly depressurized
with respect to outdoors, substantial return leakage may result if the
ceiling space is leaky. In other cases, firewalls may separate various
sections of the building and restrict the return air from moving from
one zone to another and back to the air handler. In some cases, no return
pathways are provided through the firewalls. In other cases, return
transfer windows are provided (with fire dampers) but the windows are
undersized. In other cases, the dampers (which are supposed to be closed
only in case of fire) are closed and thus restrict return air flow.
Consequently, significant pressure imbalances may result.
In one building one air handler served two zones, and because the
return transfer windows were only about 1/3 the required size, pressure
in the remote zone went to as high as +17 pascals while pressure in
the zone housing the air handler went to as low as -8 pascals.In
other buildings, no provision was made for make-up air. Consequently,
exhaust fans cause serious depressurization of the building which can
result in humidity control problems, microbial growth problems, moisture
damage to building materials, and backdrafting of combustion appliances.
In one restaurant, no mechanical make-up air was provided and the building
was depressurized to -26 pascals. Since this created excessive infiltration
and made it difficult to maintain acceptable room temperature and humidity,
the business owner responded by keeping the exterior door to the kitchen
open throughout the entire day. Even with the door open, the building
was depressurized to -4.6 pascals. In another restaurant, a passive
make-up vent was located in the ceiling above the pizza assembly counter.
Because the make-up air would blast down onto the workers (and a considerable
portion of this air was coming from the attic space above), the kitchen
exhaust fan was never operated in spite of the fact that it was always
very hot because of the large pizza oven.
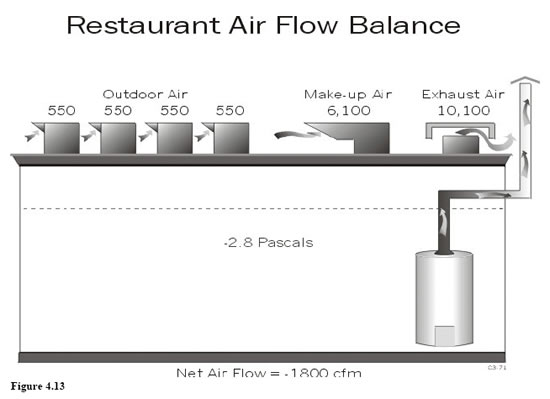
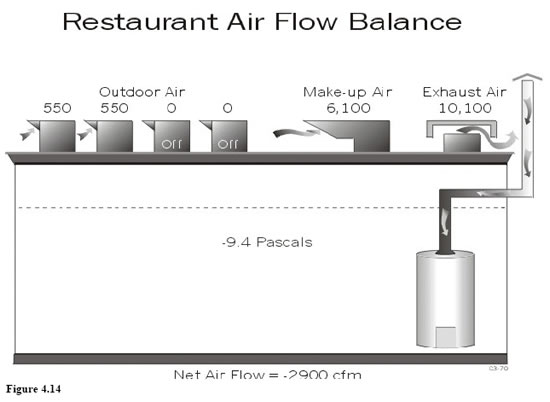
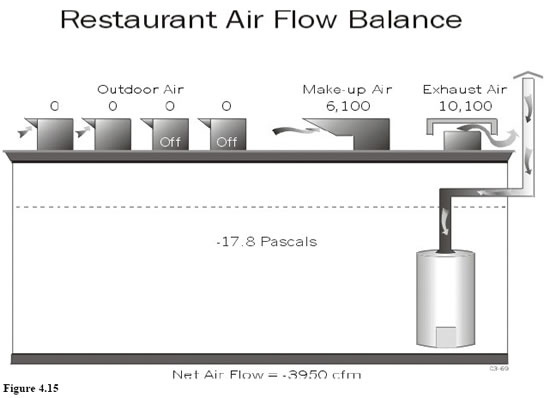
In some buildings, little or no mechanical ventilation was installed
in spite of considerable sources of indoor air contamination. One print
shop had neither outdoor air or exhaust air, and measurement of total
volatile organic compounds (TVOCs) was measured at 700 ppm (measured
by Bruel and Kjaer 1302 multi-gas monitor). By contrast, TVOCs in most
other buildings we have measured were less than 4 ppm. In another print
shop, there was no outdoor air and only 23 cfm/l000 square feet of exhaust.
TVOC levels were also very high, at over 150 ppm. Also in a plastics
fabrication facility, no mechanical ventilation of any kind was provided.
Since these three buildings have considerable air contamination sources,
it is important that adequate ventilation (either spot ventilation or
distributed ventilation) be provided in order to ensure acceptable indoor
air quality.
In other cases, HVAC components may be specified but important information
is left out. The size of the cooling system may be specified, but the
amount of outdoor air or whether there should be any outdoor air is
omitted. In some cases, return transfer windows may be indicated but
the size of the windows may not be specified. Exhaust fans may be indicated,
but not how they are to be controlled. Cooling system capacity may be
specified, but whether it will be two-stage or whether the air handler
blower cycles with the compressor is left to the discression of the
contractor. Therefore, these operation and control decisions then go
by default to the HVAC contractor and/or his technician.
4.12 Test and Balance Issues
In this study, a number of building failure modes have been detected
that relate to test and balance (TAB). The first point is that in a
majority of small commercial buildings, it appears that no test and
balance is done. The system is installed by the HVAC contractor, who
may adjust flows to within reasonable specifications, but no independent
TAB is done. Consequently, air distribution air flows and exhaust/intake
air flows may be considerably out of balance.
The second point is that outdoor air settings seem to be somewhat
random, though it is not clear from our research that the blame rests
with the TAB firms. In some buildings, the outdoor air may be sealed
off or in other cases it may be wide open and providing excessive amounts
of outdoor air. In one dentist office, for example, we found that the
cooling system was greatly oversized (a 10-ton unit serving a 1512 square
foot building and outdoor air was wide open and providing 911 cfhi,
or 32% of the total air handler air flow). Since average building occupancy
was 9 persons, this means there was over 100 cfm of ventilation per
person. As a consequence, cooling energy use and indoor relative humidity
were high.
Several months later we came back to this dentist office in order
to monitor the building for energy savings that would result from reducing
outdoor air. To our surprise, we found that the large roof-top package
unit had been moved about 15 feet from its earlier position, the old
sheet metal duct system (located on the roof) had been replaced by a
completely new duct system (ductboard ducts completely exposed on the
roof with only a mastic coating), and the outdoor air was completely
sealed off. This clearly shows that after-the-fact modifications can
result in significant system changes that are, of course, beyond the
control of both designer and TAB personnel.
The third point is that TAB firms may, in some cases, fail to balance
building air flows or may even create unbalanced air flows because there
may be little room or inadequate provisions made for proper air flow
measurements. The TAB firm may achieve the wrong building pressure because
they often rely too greatly on measurement of air flows to determine
if the building is at positive or negative pressure. Relying upon air
flow measurements to determine building net air flow (whether it is
positive or negative) can lead to significant error because of measurement
inaccuracies, duct leakage (duct leak air flows are not accounted. for),
or air flow imbalances caused .by restricted return air.
Air flow hoods, the primary tool of the TAB industry, often overestimate
air flows being discharged into the room from supply registers. This
is especially true for smaller registers and those that discharge the
air to one side of the hood or the other. Hoods more accurately measure
air flow from larger registers (2 foot x 2 foot) and those that discharge
in all directions or have a diffuse discharge (e.g., perforated screen
with multiple holes). Hoods also tend to more accurately measure air
entering return grills and exhaust grills. Since they sometimes overestimate
air flow entering the conditioned space and generally accurately measure
air leaving the conditioned space, relying upon the balance between
the supply and return measurements can lead one to believe that the
building air flow balance is positive when in fact in may be negative
This bias can cause TAB personnel to sometimes determine that spaces
and buildings are at positive pressure when in fact they are depressurized.
It may also cause them to adjust the speed of exhaust fans, make-up
air fans, and the size of outdoor air openings in order to decrease
net air flow into the building under the mistaken belief that the building
is at positive pressure.
The fourth point is that the air flow measurement approach to building
air flow balance also produces error because duct systems leak. Supply
ducts, return ducts, exhaust ducts, makeup air, and outdoor air ducts
can all have air leakage. When this leakage occurs within the primary
building air barrier, measurements done at grills and registers do not
provide an accurate picture of the air flows across the building envelope.
Figure 4.16 illustrates potential air flows within a building, including
supply, return, outdoor air, exhaust air, and make-up air flows, and
duct leakage which may occur in each of these.
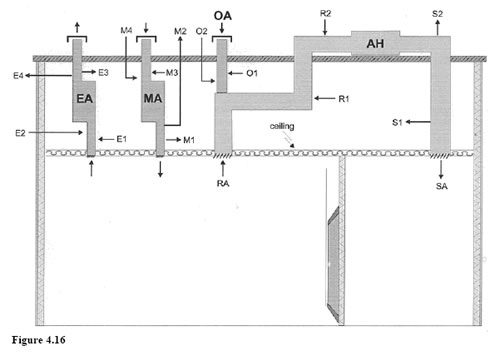
It is important to understand how duct leakage can distort
the picture obtained from measurements of air flows. Lets look at Figure
4.16 in some detail to understand how duct leakage affects building
net air flow. Looking at the exhaust system in specific, note that there
are seven different air flows indicated; EAin is air going into the
exhaust grill, EA out is the air flow discharging, three possible leak
sites on the suction side, and two possible leak sites on the discharge
side If one measures airflow entering the exhaust, grill, this measurement
will not truly reflect air flow out of the building if EAleaki, EAleak2,
EAleak3, or EAleak4 are occurring. If one measures air flow discharging
at the roof level, EAout, this is likely to accurately reflect the exhaust
air flow leaving the building, unless leak EAleak5 is occurring (duct
leak on the discharge side going to outdoors).
These types of leaks occur frequently in commercial buildings. Consider
hotels, for example. It is common for a building shaft to be used as
part of the exhaust duct system, with a large exhaust fan attached at
the top of the shaft. Grills or short ducts go from the rooms to this
shaft. Air is drawn from the building through exhaust grills and through
leakage from this shaft to the building Test and balance personnel may
measure the exhaust flow rate into the grill (typically in the bathroom),
but not account for the leakage. Therefore, the actual exhaust rate
from the building may be much greater than indicated from the exhaust
grill measurements. In one hotel tested in this project (building #68),
air flow into the exhaust grills in 40 guest rooms which composed the
entire building totalled 1324 cfm. Measurement of air flow from the
exhaust fans at the roof totalled 2799, or more than twice as much.
In other words, there is 1475 cfm of air flow that is not accounted
for. The majority (we believe) falls under the category of EAleaki (air
leaking from conditioned space) but there is also an EAleak4 component
as well (air leaking from outdoors into the exhaust shaft).
The importance of not accounting for this leakage, from a TAB perspective,
is that TAB personnel may conclude that the building air flow balance
is positive (keeping the building at positive pressure in hot and humid
climates is important for moisture control) when in actual fact the
building is operating at negative pressure. This is truly important
because the authors have had first-hand experience with TAB contractors
who believed they had achieved positively pressurized buildings when
in fact the building was operating at negative pressure and the subject
building subsequently had serious moisture problems related to uncontrolled
air flow. It is also possible, that misinterpretation of true building
air flow balance can lead TAB personnel to improperly adjust the flow
rate of exhaust fans and outdoor air and cause a building to go to negative
pressure when prior to their testing it was in fact operating at positive
pressure. The same misinterpretation can occur with make-up air, supply
and return ducts, and with outdoor air.
Consider two examples of duct leaks that were occurring in the outdoor
air ductwork in one recently tested commercial building. In one case,
an outdoor air duct on the first floor stopped short of the grill at
the exterior wall of the building leaving a 2 inch gap. As a consequence,
about 75% of the “outdoor air” was actually being pulled
from the building. In the other case, outdoor air ducts went from two
second floor air handlers to panels in exterior walls where there were
supposed to be exterior outdoor air grills. However, there were no grills
-- just a solid brick wall! Nevertheless, the TAB contractor had done
a traverse on the ducts and found flows of 1037 cfm and 897 cfm! In
actual fact, this air flow did exjst, but virtually all the air was
being drawn from the mechanical room from leaks in the ducts and around
the wall panels. (Note that the TAB contractor could not see that there
was no grill because metal panels covered the access to where the exterior
grills were supposed to be.) Therefore, in this building, outdoor air
was being overestimated by over 2000 cfm. As a consequence, the building
was operating with less ventilation and more depressurization than was
thought based on the TAB report.
Pitot tube traverse measurements are subject to error under two conditions.
1-Measurements will be in error where insufficient straight duct section
is available. 2-Measurements may be in error when they do not account
for duct leakage just as was true for air flow hoods.
We recommend, therefore, that determination of whether a space is
at positive or negative pressure with respect to outdoors or to another
zone is best made by direct measurement of pressure differentials using
a sensitive manometer. The alternative -- which is much more difficult
and often impossible -- would be to carefully measure air flows at the
point where they cross the building envelope, thereby accounting for
any duct leakage which exists.
The fifth point is that building air flow imbalance can also occur
because of return air design problems, such as centrally located returns
in conjunction with closed interior doors and restricted return air
through fire walls. The resulting pressure imbalance can cause unbalanced
air flow across the building envelope and thus cause even greater air
flow imbalance. (Stated another way, the high pressure in some zones
pushes air out of the building while the negative pressure in other
zones draws air into the building, and these flows are likely to be
unbalanced.)
The sixth point is that building air flow imbalance can occur when
building cavities are used as portions of air distribution systems.
Pressure differentials in these cavities, especially negative pressure,
can move considerable amounts of air across the building envelope and
thus change or even reverse net building air flow and pressure. TAB
contractors should examine the level of depressurization that exists
in building cavities used as portions of the air distribution systems.
For example, if the ceiling space is used as a return plenum, sufficient
return grills should be provided in the ceiling so that the ceiling
space is not at serious depressurization with respect to outdoors. In
most cases in this study, the ceiling plenum was only about 1 pascal
negative with respect to the occupied space. In one case, however, the
ceiling space was at -6 pascals with respect to outdoors. Simply adding
10 drop-in ceiling grill panels in place of ceiling tiles reduced the
ceiling to -0.8 pascals with respect to the occupied space.
Reiterating, it is important for TAB personnel to not only measure
and adjust air flows, but to also measure pressure differentials between
indoors and outdoors and between various zones/building cavities and
outdoors.
4.13 Strip Malls Have Special Problems
Strip malls, where building units are attached to each other in series,
represent a special case and have special problems because of connectivity.
While adjacent units are separated from each other by interior walls,
which are generally fairly airtight, above the ceiling level these adjacent
units are often well connected, either by having common attic spaces
or significant leak paths through fire walls. Unbalanced air flows caused
by mechanical systems can move air between adjacent units and cause
energy and air quality problems. In one case, a government office (building
#42) located next to a cocktail lounge experienced air quality problems,
including tobacco smoke and smells of cleaners resulting from air transport
between units. Above the suspended tbar ceilings, the ceiling spaces
are well connected to each other by openings in the fire wall that totalled
over 30 square feet in size. In addition, the bathroom exhaust fans
from the bar discharged into the ceiling space of the office. Once in
the ceiling space, air contaminants were transported into the office
space by means of large return leaks.
In two other cases, investigated outside of this project, substantial
air quality problems were experienced because of uncontrolled air flow
in strip malls. In one case, a book store unit located next to a print
shop smelled of printing chemicals. Upon investigation, it was found
that the return air duct for the book store passed through the print
shop and it had considerable duct leakage. In the other case, a national
chain pizza parlor was located next to a dry cleaning/laundromat facility.
The pizza restuarant moved out within one year because of complaints
of smells from the cleaners. The cause was depressurization of the pizza
store by the kitchen exhaust fans.
Wind driven pressure differences can also induce substantial pressure
differentials and uncontrolled air flows, though these uncontrolled
air flows are not unique to strip malls. When wind blows against a building
it generates positive pressure on the windward side and substantial
depressurization on top of the flat roof. In one strip mall, one-foot
round roof vents were scattered intermittently across the flat roof
venting the ceiling space to outdoors. On one particularly windy day,
opening of the front door to a retail store unit caused five or six
ceiling tiles to lift and float several inches above the ceiling level
until the door closed (this event was captured on video tape). In another
case, a unit with a residential style attic and eve vents located only
on one side, pre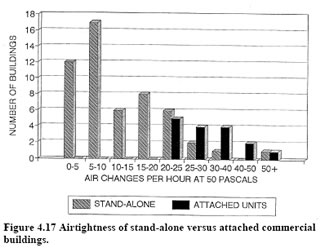 ssure
in the entire office space went to +40 pascals with respect to outdoors
during the approach of a gusty thunderstorm. When strong wind blew toward
the vented side of the attic, pressure in the attic went to a very large
positive pressure, and since the suspended t-bar ceiling was very leaky,
that positive pressure extended down into the occupied space as well.
ssure
in the entire office space went to +40 pascals with respect to outdoors
during the approach of a gusty thunderstorm. When strong wind blew toward
the vented side of the attic, pressure in the attic went to a very large
positive pressure, and since the suspended t-bar ceiling was very leaky,
that positive pressure extended down into the occupied space as well.
As seen by the blower door, strip mall units tend to be considerably more leaky than stand-alone buildings. Seventeen of the 70 buildings were attached (i.e., connected to other buildings units), primarily in strip malls. ACH5O averaged 31.2 in 16 attached units (no blower door test was done in one unit) and 12.6 in 53 stand-alone buildings. This means strip mall units are 2.5 times more leaky than stand-alone units, based on the limited sample examined in this study. These 17 units are located in five different strip malls. It is telling that the tightest measurement from all these units was 21.2 ACH5O. Figure 4.17 shows distribution of building airtightness for stand-alone and attached units. The difference between stand-alone and attached units is striking.
An important reason why the blower door “sees” so much leakage in attached units is that they are often well or fairly well connected to each other above the ceiling level. Since the ceilings are almost always quite leaky, the blower door then “sees” leaks that are in ceiling spaces of adjacent units, which in turn are well connected to other ceiling spaces and all the occupied spaces below those ceiling spaces. Since much of the leakage seen by the blower door is “far away”, located in units that may be one, two, or even more units away, the infiltration and energy impacts of this leakage may be somewhat smaller than that which occurs in stand-alone buildings.
5. Energy and Demand Savings from Repair of UAF
Repair of duct leakage in residences has been identified
as an extremely cost-effective retrofit measure. In 46 central Florida
homes, duct repair reduced cooling energy consumption by 17.2%, or
7.0 kWh per day. The average cost of repair was estimated to be $200.
Given estimated annual space conditioning energy use savings of $110,
this retrofit pays for itself in less than two years (Cummings, Tooley,
and Moyer, 1991).
We expected that repair of duct leakage and other forms of uncontrolled
air flow in small commercial buildings would be cost-effective as well.
From the sample of 70 small commercial buildings tested, 20 were chosen
to be monitored for energy savings from repair of uncontrolled air flow.
Cooling energy savings analysis was successfully done in 19 of the 20
buildings. In the remaining building (#12), analysis was complicated
by the facts that cooling energy use could not be directly metered (cooling
energy was provided to the building by a university-wide chilled water
distribution system) and electric reheat was used to control building
humidity.
5.1 Selection of Buildings for Repair
Twenty buildings were monitored for energy savings from repair of
uncontrolled air flow over single cooling seasons. Two were monitored
during the summer of 1993. Seven were monitored during the summer of
1994. Eleven were monitored during the summer of 1995. The
plan was to monitor cooling energy use for a period of four to six weeks,
make repairs during the middle of the summer, then monitor for another
four to six weeks.
Only a portion of the 70 buildings tested were good candidates for
repair. By “good candidate” we mean that it appeared that
repair could be readily done and would achieve reasonably large energy
savings. Based on our assessment of potential savings, it appears that
45, or 65%, of the 70 buildings would make good repair candidates.
By contrast, it was estimated from an earlier residential duct leakage
study, that duct repair would be justified in about 85% of central Florida
residences. Additional research is needed to determine the repair cost
and the savings which can be achieved in a wider range of buildings
and attempted repairs. Additional development work is needed to identify
repair options for the wide range of uncontrolled air flows, such as
airtightening t-bar suspended ceilings, adding make-up air, and down-sizing
or reducing the run time of exhaust fans. When these additional tasks
are completed, then a better estimate of what proportion of buildings
are good candidates can be made.
An important task for future research, therefore, will be to develop
screening criteria and procedures by which to determine the energy savings
which could be expected from specified UAF retrofits and thereby determine
which buildings should be retrofitted.
Table 5.1 summarizes some building and HVAC characteristics of the
twenty buildings in which repairs were done. Compared to the larger
sample of 70 buildings, the 20 monitored buildings were about two years
older, 23% smaller, 24% more leaky, and had ducts that were 13% tighter.
When deciding whether considerable energy savings were likely to
occur from duct repair, we considered the size of the duct leakage and
where the ducts were located. If ducts were located in the occupied
space or within a ceiling return plenum, we anticipated little or no
savings. If they were located in a ceiling space inside both the building’s
air and thermal barriers, then again, little or no savings were anticipated.
However, if they were located outside the thermal barrier (insulation
on the ceiling tiles), then significant savings would be anticipated
from duct repair. [Note that the savings would still depend upon roof
thermal factors -- how much R-value exists in the roof construction,
the thermal mass of the roof (concrete roof construction, for example,
has high mass), the reflectivity of the roof surface, the presence of
gravel (which does not transfer heat readily downward), and any shading
of the roof surface.]
In the selection process, it was important that the magnitude of
the savings be sufficiently large that the signal (energy savings) to
noise (occupant use and weather variables) ratio be large enough that
clear indication of savings would result. Tn 17 of the selected buildings,
we expected significant energy savings. In three others, only moderate
energy savings were expected (buildings numbers 45, 59, and
60).
5.2 Repairs
Various types of repairs were done. The primary focus, however, was
airtightening of the air distribution system (ADS), including ducts
and building cavities used as ducts. The breakdown of repairs was; duct
repair (16 buildings), repair of building cavities used as ducts (9
buildings), improved return air pathways (4 buildings), reduction of
outdoor air (3 buildings), and tightening of the building shell (3 buildings).
These are indicated by “x” in Table 5.2. Note
that an attic exhaust fan was turned off in one building, though not
shown in the table. Note that two major types of uncontrolled air flow
repairs were not addressed in the repair side of this project even though
considerable savings could be expected from them. These were 1) airtightening
of the ceiling/roof assembly of the building when that portion of the
building is excessively leaky and 2) balancing exhaust air flows. The
latter could be achieved by some combination of reducing exhaust air
flows and increasing intake air flows (make-up air and outdoor air).
A significant number of the 50 buildings not included in the repair
sample had excessive building leakage or exhaust/intake imbalance which
should be remedied. These were not dealt with to any significant extent
because of project budget limitations and lack of knowledge about the
best methods to implement solutions.
In most buildings, more than one type of retrofit was used. The breakdown
of repair packages implemented in this project is as follows.
- Twelve retrofits involved only repair of the ADS.
- Four involved airtightening the ADS and improving return air.
- One involved airtightening the ADS, improving return air, and reducing outdoor air.
- One involved airtightening the ADS, changing out an old, inefficient air conditioner (done independently by the building owner), and turning off an attic exhaust fan.
- One involved tightening the building shell and reducing outdoor air.
- One involved reducing the amount of outdoor air.
Among the 20 repair candidates, some repairs that should have been
done were not done because of diagnostic error (we did not see that
the measure should be done) or because there were insufficient flTnds
to accomplish the repair. Repairs not done that should have been done,
indicated by !!o? in Table 5.2, include return air (2 buildings),
tightening of building shell (5 buildings), adding make-up air (1 building),
and reduction of exhaust (1 building).
After repairs were complete, airtightness, pressure differential,
and air flow tests were repeated. Table 5.3 summarizes some
building and HVAC characteristics of the twenty buildings after repairs
were done. Three tables compare the buildings and duct systems before
and after uncontrolled air flow retrofits. Table 5.4 compares
pre-repair and post- repair building and duct system airtightness and
shows percent tightening which occurred. On average, these buildings
became 13.9% more airtight. For buildings in which duct system airtightening
was done, the duct systems became 58% more airtight. Table 5.5 compares
pre-repair and post-repair building and duct system airtightness, building
ventilation rates, and return leak air flows. The average building ventilation
rate with the mechanical systems operating (ach AHON) decreased by 10%
from 1.03 ach to 0.93 ach. The building ventilation rate (infiltration
rate) with all mechanical systems turned off increased substantially,
from 0.35 ach to 0.46 ach in the 14 buildings for which both prerepair
and post-repair numbers were available. In 11 of the buildings, infiltration
was approximately equal or less after repair. In three cases, however,
post-repair infiltration was dramatically higher (1.13 ach compared
to 0.42 ach pre-repair). Substantially higher wind speed associated
with hurricane Opal explained the disparity in one case (building #45). Investigation
of wind speed and other variables provided no explanation for the substantial
disparity in the other two instances. Table 5.6 compares
pre-repair and post-repair outdoor air+make-up air, return leak flow,
and normal building operating pressure.
Repair of uncontrolled air flow was planned for the middle of summer
so that approximately comparable weather would occur during the pre-repair
and post-repair periods. Schedule conflicts, however, and the initial
lack in availability of candidates caused monitoring starts later than
anticipated for some sites. Most repairs occurred in July and August,
but three buildings were repaired in September and two were repaired
in October. (Note that summer weather occurs May through October in
central Florida.)
For each repair candidate, a repair plan was developed, including
what would be repaired, what materials would be needed, and estimates
of repair time. Repair typically occurred 5 to 6 weeks after monitoring
began. A team of two to three persons with considerable experience in
repair of residential duct leakage usually did repairs. In two cases,
repairs were done by HVAC contractors with the guidance of the research
team.
5.3 Monitoring
The following variables were monitored by datalogger on 15-minute
intervals.
- air conditioner(s) energy use
- room, ceiling space (or attic), and outdoor temperature
- air conditioner temperatures (return, supply are recorded only when the cooling system was operating)
- indoor relative humidity.
At many of the sites carbon dioxide levels and indoor pressure differentials
were monitored, especially in tight buildings and those in which repair
of uncontrolled air flow would significantly reduce ventilation. Outdoor
environment conditions of dewpoint temperature and solar radiation were
collected at several central locations, generally within 15 miles of
the monitored buildings. The number of sensors and meter locations were
planned based on size, airtightness, number of air conditioners, and
location of thermostats, ducts, and air handlers. Monitoring equipment
was assembled partly in the lab and partly in the field.
5.3.1 Data Transfer
All data was stored as 15 minute averages except energy use which
was stored as total kilowatt hours every 15 minutes. Data transfer occurred
through a modem and phone line. A central computer system called each
datalogger daily and downloaded site data to disk storage. Data transfer
was scanned for errors by comparing to prescribed value boundaries.
If bad data was detected, a second attempt to download data from the
datalogger occurred. Suspect data was marked.
Computer programs were created to call each sites datalogger, download
data, and plot up to eight graphs containing up to 20 variables every
twenty-four hours. These plots were automatically produced overnight
and then reviewed daily to see that equipment was working well and to
identif’ any unusual circumstances. Such circumstances could be
unusual thermostat settings for a particular time of day, air conditioning
turned off, faulty sensor, or in a real case, hurricane Erin’s
damage to some sensors. When there was an indication of trouble, the
site would be visited to repair or replace faulty equipment.
5.4 Energy Savings
Energy savings from the repair of uncontrolled air flow has been
determined by comparing cooling system energy consumption for periods
before and after repair. In order to filter out variations caused by
weather and changes in thermostat settings, cooling energy consumption
(kWh) was plotted against the temperature difference between indoors
and ambient. Thermostats were controlled in three manners. 1) At seven
sites, thermostat settings remained constant over 24 hours (building
#s 29, 31, 40, 45, 46, 56, and 61). 2) At ten sites, thermostat settings
were raised (typically to 80°F or higher) after hours. 3) At two
sites, air conditioners were turned off at the end of business (building
#s 2 and 3).
When comparing energy use before and after repair, all data was examined
to make sure the most comparable days (in terms of weather and occupancy
factors) were used for the analysis. For 15 of the buildings, the analysis
includes only weekdays. Weekends were excluded in most cases because
of increased variability in building use on weekends. The analyses for
the remaining four buildings used all days (buildings 29, 31, 40, and
56). Days with unusual cooling system operation or weather conditions
that were not common to both periods were excluded from the data analysis.
Examples of unusual operation would be if the thermostat was not raised
to its typical after-hours setting or if the air conditioner was turned
off for a period during the day. With no control over weather and, in
some cases, relatively limited time for monitoring, some sites have
less data than desired.
As indicated, cooling energy use is plotted versus temperature difference
between indoors and ambient. While ‘ambient” usually means
outdoors, in some cases the dominant thermal environment was a warehouse
or attic space. In the plastic fabrication office, for example, which
is located inside an unconditioned warehouse, energy consumption correlates
better to “warehouse minus office space” temperature difference.
Attic temperature can also have an strong impact on building cooling
load, especially when poor insulation or air transport brings heat into
the building. Energy use in realty office 3 (building #3 9), for example,
correlates better to attic temperature than outside temperature, in
large part because this attic had very little insulation. In these cases,
warehouse or attic temperature was used as the reference temperature
to calculate the energy savings.
The best-fit lines on the plots are produced by least-squares linear
regression. The graphs for 20 building-retrofits are shown in Figures 5.1 - 5.4. Note
that the energy savings for realty office 2 (building #37) is presented
for two UAF retrofits. “Realty 2 duct” is savings from duct
repair only. “Realty 2 fan” reflects cooling energy savings
of 3.1 kWh/day and reductions in attic fan energy use of 11.2 kWh/day
when the attic fan was turned off. Also note that the sports complex
building shows the north and south zones separately, because the two
zones are separated by a common wall and a fire wall, the door between
the zones was always closed, each zone had a separate cooling system,
and the thermostats were controlled separately.
5.4.1 Percent savings and payback calculation
Seasonal energy savings are calculated in the following manner. The
least-squares, best fit lines (energy use vs temperature differential)
are used in conjunction with 10 year meteorological data from the FSEC
weather station to calculate the expected cooling energy use for each
day during a typical cooling season. Percent savings is based on a six
month period May 1 through October 31. Daily energy use was summed over
the entire six month period and divided by 184, the number of days in
this period. Percent savings is calculated by dividing the difference
between pre-repair and post-repair energy use divided by the prerepair
energy use.
To examine the cost-effectiveness of UAF repair, energy consumption
for an 8-month cooling season was computed (again based on the kWh vs
dT best fit curve and the daily 10- year weather database) from mid-March
to mid-November. Adjustments were made to weekend energy use because
10 of 19 commercial buildings were less utilized on the weekends. We
found that cooling energy use was 41.7 percent lower in these 10 buildings
on the weekends, on average. Therefore, weekend cooling energy use in
these 10 buildings was reduced by 41.7 percent for purposes of these
computations.
Some heating energy savings will result from these UAF retrofits.
But since we did not monitor heating energy use, we do not know what
energy savings would be expected. Several factors make this difficult
to predict. First, commercial buildings are more fully conditioned during
day-time hours when temperatures are warmer. Second, they tend to have
greater internal heat generation. Therefore, we have based annual savings
only on an 8-month cooling season.
Some businesses pay only for electricity consumption. Others pay
demand charges as well.
In order to simplifi the analysis, we have assumed a cost of $0.075
per kWh for all buildings. Simple payback was calculated by dividing
the estimated repair cost by the energy savings.
On average, cooling energy consumption decreased from 87.4 kWh/day
to 75.1 kWh/day, or 12.4 kWh/day. On average, cooling energy
use declined by 14.7% from repair of UAF (Table 5.7). Based
on the assumed $0.075/kWh electricity cost, projected annual cooling
energy savings are $182. Given that the average projected retrofit cost
is $454, simple payback is 2.5 years. This indicates
that UAF repairs can be very cost-effective retrofit measures.
5.4.2 Two types of uncontrolled air flow were not repaired
Note that there were two major types of uncontrolled air flow repairs
that were not addressed in the repair side of this project. These were
1) airtightening of the ceiling/roof assembly of the building when that
portion of the building is excessively leaky and 2) balancing exhaust
air flows, by some combination of reducing exhaust air flows and increasing
intake air flows (make-up air and outdoor air).
Substantial exhaust imbalance problems exist in perhaps 20% of the
total 70 building sample. These imbalances cause excessive space ventilation
and elevated cooling energy consumption. In cases where the building
has a leaky ceiling and a vented attic space, the energy penalties can
be very large and therefore the energy savings from repair can be very
large as well. These were not dealt with because of project budget limitations
and/or lack of knowledge about the best methods to implement solutions.
In one of the buildings which we monitored and in which we made extensive
duct repairs (building #31), we tried to get the business/building owner
to install make-up air but he felt he could not afford the cost.
Consider another example. A seven-year old convenience store (building
#69) has a kitchen exhaust fan which draws 1546 cfm from this store
from 5 AM to 7 PM seven days per week, depressurizing the building
to -1.8 pascals. Since the floor and walls are tight (all masonry) and
the ceiling is very leaky (suspended, t-bar construction), most of the
passive makeup air originates from the vented attic space. Since this
space is very hot and humid, unbalanced exhaust air adds tremendously
to the building cooling load. Some ‘back-of-theenvelop&’ calculations
will provide some perspective on the potential savings that may result.
Assume the following:
- Exhaust fan operates from 5 AM to 7 PM seven days per week.
- 80% of passive make-up air comes from attic.
- During period from 5 AM to 7 PM, temperature and dewpoint temperature conditions are 85F/74F outdoors and 1O1F/78F in the attic space, 210 days per year
- Cooling system COP (coefficient of performance) is 1.8.
- A make-up air system is installed to match 80% of the exhaust air flow and assume that 75% of that unconditioned make-up air exhausts directly to outdoors and does not add load to the building.
- Outdoor air, which is currently 11% of exhaust air flow, is increased to 25% of exhaust air flow as a result of cleaning filters. This would cause the building to operate at positive pressure most of the time.
- The cost of installing make-up air is $2500.
Based on these assumptions, cooling energy savings are projected to be $2175 per year and the simple payback period is just over one year.
5.5 Description of Uncontrolled Air Flow Retrofits
Following is a building-by-building discussion of the nature and
impacts of the retrofits. Building numbers refer to the master data
table which may be found in Appendix B.
5.5.1 Auditorium (#2)
One large 25 ton air conditioning system serves this 5000 square
foot, 90000 cubic foot building. Because of the height of the ceiling
(18 feet) and size of the supply grills (6 foot diameter) and the fact
that the ceiling “stucco’ was asbestos, duct system airtightness
was not measured. The supply ductwork was located on the roof in a protective
enclosure which prevented access for inspection or repair. Large return
leaks (26% return leak fraction) were drawing air from an exterior mechanical
room which was vented to outdoors. Repair of the return leaks caused
an 8% reduction in cooling energy use from 130.2 kWh/day to 119.6 kWh/day.
Repairs were accomplished in five person-hours using $180 in materials.
Energy savings pay for the estimated $430 repair cost in 2.1 years.
5.5.2 Dentist 1 (#3)
Two attic-mounted air handlers serve this 2754 square foot building.
The ducts are located in the attic space. Substantial leakage existed
in the ductwork. Repairs, however, were effective in sealing only 53%
of the total leakage. Return leaks were reduced from an average of 5.2%
to 2.7%. Many supply leaks remain. It is clear, in retrospect, that
additional effort should have been put into duct repair. Ideally, duct
repair would have been done with a duct test rig installed on the duct
system (registers and grills masked off) so that airtightness could
be periodically retested in order to gauge progress. However, in nearly
all these buildings, retrofits were done during occupied hours, so the
air conditioning system could not be readily turned off during the repairs.
To optimize the repair process, it would be best to schedule these operations
when the business is closed.
Relative humidity was largely unchanged as a result of the repairs
(58% pre-repair and 60% post-repair). Carbon dioxide levels increased
from an average 588 ppm to 709 ppm, since repair of the duct leaks diminished
the building ventilation rate. Repairs were accomplished in eight person-hours
using $50 in materials. Energy savings pay for the estimated $450 repair
cost in 2.7 years.
5.5.3 Dentist 2 (#9)
A two-stage, 10-ton air conditioner serves this 1512 square foot
building. Unlike most retrofits in this project, no duct repair was
done. Rather, the oversized outdoor air was reduced. When originally
tested, this roof-top package unit had no outside air damper and total
outdoor air flow was 25% of the total 3623 cfh air handler
air flow. This equals 911 cfm, which is about 100 cfm per person or
3.9 air changes per hour. With this high infiltration rate, the owner
experienced difficulty in controlling humidity in the occupied space.
Because the building was thermally very inefficient, the ductwork was
located on the roof in the hot sun, and room temperature was typically
kept at 72°F, the air conditioning system operated nearly continuously
during business hours.
Upon being informed of our findings, the building owner/occupant
requested that outdoor air flow be reduced. Therefore, the pre-retrofit
monitoring occurred with the outdoor air reduced to 65% of
original flow, or 590 cfm. The post-retrofit monitoring occurred
with outside air completely sealed. Before retrofit, building ventilation
was 835 cfm or 93 cfhi per person as measured by tracer gas
decay. This ventilation consists of the 590 cfm of outdoor air plus
approximately 232 cfm of return leakage, primarily from rooftop air
handler panel leaks. After sealing off the outdoor air, ventilation
decreased to 232 cfm (return leaks) or 26 cfh-i per person.
Both carbon dioxide levels and relative humidity were monitored.
Carbon dioxide levels during business hours increased from an average
390 ppm with outside air 65% open to 570 ppm with outside air closed.
(Note that 570 ppm is well below the 1000 ppm maximum recommended by
ASHRAE 62-1989.) This indicates, as was also documented by tracer gas
measurements, that ventilation exceeds 20 cfh-i/person. Relative humidity
decreased from an average 59% to 54% because of the retrofit. One person-hour
is figured for this retrofit and no materials. Cooling energy consumption
decreased by 16.2% from 88.4 kWh/day to 74.0 kWh/day as a result of
downsizing the outdoor air. Energy savings pay for the estimated $50
repair cost in 0.2 years.
5.5.4 City hall (#20)
Two five-ton roof top package air conditioners serve this 2952 square
foot concrete block building. Most of the ductwork was located in the
hot and dry ceiling space. It was hot and dry because the roof deck
is the primary air barrier and the insulation is on top of the ceiling
tiles. About 20% of the ductwork is located on the roof. Substantial
duct leakage existed both below and above the roof.
All of the ductwork on the roof, both return and supply, was replaced
by an HVAC contractor. Return and supply ducts within the building were
sealed by research staff. Duct CFM25 decreased 51% from 1632 to 795.
Much of the remaining duct leakage was in supply ducts located in the
ceiling space and wrapped in exterior duct insulation. These leaks were
not repaired because of the difficult access. Future research should
focus on cost-effective methods to airtighten ductwork that is difficult
to access and which has exterior insulation wrap. (Note that access
to the ceiling space is through ceiling tiles which have insulation
batts on top and that the ducts run through a maze of hangers (wires)
which support the suspended ceiling.)
In addition to duct repair, the duct access hole (through the roof)
was tightened thereby decreasing building leakiness from 7.4 ACH5O to
5.2 ACH5O. Carbon dioxide levels increased slightly from an average
561 to 589 as a result of the repairs. Indoor relative humidity increased
slightly from 47% pre-repair to 49% post-repair. Cooling energy consumption
decreased by 20% from 137.4 kWhlday to 109.9 kWh/day. Total repair time
was sixteen person-hours and $100 in materials. Energy savings pay for
the estimated $900 repair cost in 2.6 years.
5.5.5 Health clinic 2 (#21)
Three air conditioning systems served this 2560 square foot
strip mall space. Air handlers were located in mechanical closets which
were used as return plenums and were depressurized to -12 pascals, -33
pascals, and -17 pascals. Illustration of the second system is shown
in Figure 5.5. Because the closet ceilings were suspended t-bar
construction and were very leaky, return leaks of 48%, 13%, and 48%
were being drawn from the hot attic space above, which was as hot as
120°F. This means that, on average, these three systems were drawing
36% of their return air from the attic. Even with 10 tons of air conditioning,
it is not surprising that this building was often uncomfortable. Repairs
were made by “hardducting” the system, that is, installing
continuous ducting from the air handlers to the return ductwork in the
attic, so that the closets were no longer plenums. Significant supply
leaks at register connections were also repaired.
Duct CFM25 decreased 91% from 2576 to 227 (most of that leakage was
in the return plenum closets). Relative humidity decreased from an average 57% to 52% as
a result of repairs. Carbon dioxide levels increased from an average
498 ppm to 539 ppm. Cooling energy consumption decreased by 25.6% from
96.7 kWh/day to 72.0 kWh/day. Twenty person-hours and $300 in materials
were used in this repair. Energy savings pay for the estimated $1300
repair cost in 3.9 years.
5.5.6 Sports building (#12)
Four air conditioning systems served this 16,713 square foot university
building. Air handlers were located in two mechanical rooms which are
located inside the ceiling space. Air handler #1 serves zone #1. Air
handlers #s 2-4 serve zone #2. These two zones are separated by a fire
wall and doors between the two zones are closed most of the time.
Mechanical room #1 acts as a return plenum for air handler #1. The
other three air handlers have “hard-ducted” returns. Air
handler #1 draws air from the mechanical room and depressurizes the
mechanical room to -10 pascals, and in turn the mechanical room draws
air through “windows” from the ceiling space which is a
return plenum. Exhaust fans in bathrooms and locker rooms depressurized
zone 1 (that portion of the building served by air handler #1) to -1.7
pascals.
The ceiling plenum, which served only zone #1 had large leakage to
outdoors. A three inch gap existed where the top of the exterior walls
met the sloped roof deck. Considerable return leakage occurred through
this gap in spite of the insulation batts which were stuffed into the
gap. Not being an air barrier, these batts did not stop the air flow
but rather filtered the air as it entered the building.
The uncontrolled air flow retrofit on this building consisted of sealing this gap, using foil- backed fibrous board and class 1 foam. A repeat of the building airtightness test found that 22% of the total building leakage was eliminated by this repair alone. Since cooling energy was delivered to this building by chilled water from a central plant, energy consumption was measured by monitoring air handler air flow rate, temperature drop, and humidity drop.
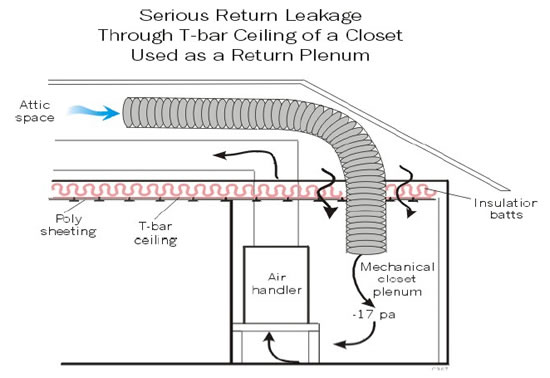
Energy consumption of the electric reheat was monitored by a power
meter, and it was found that reheat was consuming about $10,000 per
year on air handler #1 alone!
Cooling energy savings were less than expected. Savings may have
been reduced by and analysis made more complicated by the fact that
electric reheat was used to control building humidity. The reheat is
controlled by relative humidity, such that on cooler summer days the
reheat operated more of the time, and therefore the cooling load did
not respond as expected to changes in external weather conditions. Savings
were also compromised by diagnostic failure. After the previously described
repairs (sealing the return plenum) were made and only 7% energy savings
were identified, we reevaluated our diagnosis and concluded that this
building had an “exhaust air vs intake air” imbalance problem.
Exhaust fans operate continuously and have larger air flow than the
outdoor air. While we had stopped leak pathways and made the building
more airtight, the driving forces of the exhaust fans were still operating
and depressurization of zone #1 increased from -1.7 pascals to -3.4
pascals as a result of the this tightening.
The following observations and recommendations were given to the
building owner based on the reevaluated diagnosis.
“First, exhaust fans continue to draw 2230 cfm of air from the
building, causing the average building pressure to be about -1.2 pascals
(area weighted average of zones 1 and 2). This is consistent with the
fact that exhaust fans are drawing about 750 cfm more air
from the building than outdoor air ducts are bringing into the building
(outdoor air = 1477 cfm and exhaust fan air = 2230 cfh).
Second, a significant portion of the supply air from air handler
#1 is delivered to zone 2 (about 3700 cfm), and the return air path
is inadequate and is returning only about 1200 cfm (this means there
is a net pumping of 2500 cfm of air from zone 1 to zone 2). Therefore,
zone 2 (about 60% of the building) operates at about +0.2 pascals (all
pressures with respect to outdoors), while zone 1 operates at about
-3.4 pascals. Therefore, while zone 1 was made much more airtight (about
22% of the total building leak area was eliminated by the repair of
the ceiling return plenum), it is now under much greater negative pressure
(it was -1.7 pascals), and so considerable ambient air is still being
drawn into the building.
Third, air handler #1 receives very little “outdoor air”.
While air handlers 2, 3, and 4 receive 457 cfm, 538 cfhi, and 420 cfm,
respectively, air handler #1 receives only 62 cfi-n. Zone 1 has 500
cfm of exhaust air operating continuously, or 438 cfm net loss, and
consequently, this further depressurizes zone 1.
Recommendations
Based on these observations, the following recommendations are made.
The ultimate objective of these recommendations is to reduce humidity
levels in the building so that the electric reheat may be turned off.
Based on one week of reheat energy use data, we project that AH#1 reheat
is using about $10,000 per year (assume $0.08/kwh), and the cooling
energy required to meet the reheat cooling load may be about $3500.
Therefore, if the humidity can be controlled without reheat, savings
from AH#1 alone could be $13,500 per year.
First, we recommend creating a larger return window in mechanical
room #1 to allow a greater amount of return air to get back to AH# 1.
This window should be about three times larger than the presently existing
window. This will reduce pressure imbalance between the two zones.
Second, we recommend that several exhaust fan flow rates be reduced
in the building. Following are the current exhaust flow rates (as measured)
and what we suggest for reduced flow:
current |
proposed |
|
| locker room shower | 850 |
850 |
| locker room bathroom | 600 |
300 |
| coaches locker room | 280 |
100 |
| office area bathrooms | 500 |
200 |
| total | 2230 |
1450 |
This would reduce exhaust flow from 2230 cfm to 1450 cfm. Furthermore,
we suggest that the middle two (locker room bathroom and coachers locker
room) be placed on occupancy sensor control with an appropriate (15, 30,
or 60 minute) time delay.
Third, we recommend that the outdoor air be increased to air handler
#1, to about 500 cfrn. This would bring zone 1 to positive pressure.
When these first three steps are taken, nearly all the air entering
the building will enter through the outdoor air ducts and therefore,
the air will be conditioned by the outdoor air cooling coil before it
reaches the air conditioning system. This will produce much improved
dehumidification control.
Fourth, we recommend that the flow rate on the air handlers be reduced
-- to levels that are just adequate to meet the cooling load on the
hottest afternoons. This might mean the flow rates would need to be
reduced by 70%. This reduction in air flow would cause the average cooling
coil temperature to be colder and therefore remove more moisture.
Alternatively, the control of the chilled water could be changed.
Currently, the water temperature is modulated to adjust to the cooling
load as sensed by the thermostats. The recommended change would be to
cycle the chilled water. In this mode, the water would be sent through
the coil at full coldness, and then cycled off when the thermostat senses
the setpoint has been satisfied. If this is done, it will be important
that the “on” cycles be of sufficient length to allow good
dehumidification (say 15 minute on cycles, at the very least) and it
will be important that the drain pan not hold much water, because this
water will evaporate during the “off’ cycle, thus adding
moisture back to the room air.”
By reducing the flow rate and run time of exhaust fans, and increasing
the outdoor air so the building operates at a slight positive pressure,
building ventilation rates would decrease and dehumidification would
improve. Moisture removal from air coming into the building would be
enhanced because it would all (or at least virtually all) pass through
the cooling coils on the outdoor air intake ducts. This yields a superior
latent removal performance compared to trying to remove the moisture
after it has already mixed with the room air as it passes through the
air handlers -- especially since the air handlers are considerably oversized.
These recommendations had not yet been implemented by the fall of
1995 when monitoring ended. When they are implemented, we expect that
relative humidity, which typically runs around 57% with the aid of the
electric reheat, could be kept under control without the use of reheat
and annual HVAC savings of $15,000 to $25,000 per year could be anticipated.
5.5.7 Recreation center (#25)
Two air conditioners (4 tons and 5 tons) serve this 2708 square foot
building. A suspended t-bar ceiling is below a residential-style ventilated
attic space. Insulation balls are attached to the bottom members of the attic
truss system; some batts are missing and some have fallen. The air handlers
are situated on enclosed support platforms located in closets. Return leaks
of 12.2% south zone) and 19.4% (north zone) exist in each return plenum because
the plenums are built into the closet corners and the walls are partially open
to the inside of the plenum. Air is drawn down closet walls from the attic
space, from above the ceiling tiles but below the suspended insulation bails.
Voids between insulation bails allowed this space to become as hot as 91°F
when the attic space above the bails was 118°F. Return leaks created slight
positive pressure in the building, pushing room air into the space above the
ceiling and thus keeping it from being much hotter than outdoors. Return leak
flow was a total of 555 cfm from the two systems. The inside of the
support platform return plenums and through-the-wall grill penetrations were
sealed using fiberglass mesh and mastic. Supply leaks were sealed at some grill
to duct connections.
Duct CFM25 was reduced by 81% from 788 to 154. Relative humidity
was largely unchanged; 53% pre-repair and 52% post-repair.
Cooling energy use decreased by 17.4% from an average 77.3 kWh/day to 63.9 kWh/day.
Repair time was 8 person-hours and materials cost was $50. Energy
savings pay for the estimated $450 repair cost in 2.2 years.
5.5.8 University office 1 (#29)
Four roof-top package air conditioners serve this 5040 square foot
manufactured office space. Ductwork is located in the ceiling space.
Insulation bails are located at the bottom of the roof deck. The ceiling
space is warm and humid because it is well ventilated to outdoors. Vented
soffit is located at the eaves on three sides of this buildings. Only
vertical insulation bails separated this ventilated soffit space (outside
the building) from the ceiling space (inside the building), and these
bails allowed substantial air flow. Building airtightness was 24.9 ACH5O
largely because of the ceiling space ventilation. Two retrofits were
employed; airtightening the ceiling space and reducing outdoor air.
After identifjing that the ceiling space was leaky to outdoors, it
was decided that tightening the ceiling space would be preferable to
sealing the rather leaky ductwork. Though the ducts are located inside
the building thermal barrier (insulation attached to the bottom of the
roof deck), they are effectively outside the building air barrier. The
retrofit consisted of sealing the exterior walls above the ceiling level
with fibrous ductboard, mastic, and foam. Airtightening of the ceiling
space resulted in reduction of building ACH5O by 74% to 6.4. The second
retrofit was reduction of outdoor air from 1296 cfm (86 cfln per person)
to 588 cfm (39 cfm per person). In addition, panel leaks on the package
air conditioners were sealed with metal tape.
As a result of tightening the ceiling space and reducing the outdoor
air, relative humidity in the occupied space declined from an average
53% to 48%. Relative humidity in the ceiling space declined from 50%
to 41%. Cooling energy use decreased from an average 211 kWh/day to
170 kWh/day, or 19.3%. Repair time was 24 person-hours and $80 in materials.
Energy savings pay for the estimated $1280 repair cost in 2.2 years.
5.5.9 Bar and grill (#31)
Two four-ton air conditioners serve this rather leaky (17.5 ACH5O)
2400 square foot restaurant/bar. The air handlers and ductwork are located
in the attic space. The ductwork was very leaky; 655 CFM25. Large return leaks
(505 cfmn) were drawing hot attic air into the building. There were substantial
supply leaks as well, but return leaks dominated. A kitchen exhaust fan pulled
987 cfm of air from the building throughout most of the day, and there was
no make-up air. The building was depressurized to -0.8 pascals when both exhaust
and air handlers were operating.
Based on the size of the duct leaks and the fact that they were drawing
in hot attic air, cooling energy savings of 30% or more could have been
expected. To our surprise, monitored savings were only 10.6%. In hind-sight
two problems were identified. First, only 58% of the duct
leaks were sealed. Second, we had mis-diagnosed the building UAF problems,
or more accurately we only got it half right. We believed that sealing
the large return leaks would reduce the amount of hot attic being brought
into the building. It turned out that for the most part this was not
true because the exhaust fan would continue to draw nearly 987 cfm of
hot attic air into the building for 8 to 10 hours per day. (Most of
the air would come from the attic since nearly all of the shell leakage
of this slab-on-grade, concrete block building existed in the ceiling.)
As a result of duct repair, building pressure went from -0.8 pascals
to -2.0 pascals. After repair, less attic air was being drawn into return
leaks, but more attic air was being pulled into the building by space
depressurization.
We believe that substantially greater energy savings could have been
realized if make-up air were installed in the kitchen. Alternatively,
the large leak paths between the attic and occupied space (above the
bar) could have been sealed. This would have reduced the amount of air
drawn from the hot attic and increased the amount drawn from the relatively
cooler outdoors. To make this second approach even more effective, a
passive make-up air vent could be installed in the kitchen, in the proximity
of the cooking area and the exhaust fan. This would minimize the impact
of the make-up air by causing it to “short circuit” -- go
almost directly from the make-up grill into the exhaust intake. This
case illustrates how important correct diagnosis is and the importance
of taking all uncontrolled air flows into account when specifying repairs.
As a result of these repairs, duct CFM25 decreased 59% from 655 to
272. Relative humidity in the occupied space declined from an average
63% to 57%. Cooling energy use decreased from an average
142.4 kWh/day to 127.3 kWhlday, or 10.6%. Repair time was 18 person-
hours and materials totalled $75. Energy savings pay for
the estimated $975 repair cost in 4.2 years. Calculations indicate that
installation of make-up air could save over $1000 per year.
5.5.10 Realty office 2 (#37)
This was one of the most interesting retrofit cases. An old, inefficient
(estimated 6.0 SEER) five-ton air conditioner served this 1845 square
foot building. Major breaks and offsets of sections of supply duct located
in the attic had occurred as a result of foil tape adhesive failure
producing very large supply leaks. An attic exhaust fan was pulling
730 cfm from the attic space throughout the day. It was depressurizing
the attic space, which has only two small eave vents, to -10.0 pascals
and the occupied space to -10.6 pascals (Figure 5.6). (Note that these
pressures were with the air handler also operating and that the supply
leaks were depressurizing the occupied space relative to the attic space.)
It is also interesting to note that a new roof was put on the building
after our initial testing and before the duct repairs were done. A new
attic exhaust fan was also installed and it depressurized the attic
space to -16.0 pascals and the occupied space to -15.6 pascals. (Note
that the attic space is now more depressurized than the occupied space
because the supply leaks had been repaired at this stage.)
Retrofits to this building were completed in three phases. The first retrofit was duct repair. CFM25 in the ducts was reduced by 80% from 571 to 112. Cooling energy consumption declined 31% from 99.6 kWh/day to 69.1 kWh/day as a result of this repair. The second retrofit was replacement of the air conditioner by a 12 SEER unit. (This replacement was done entirely at the initiative and expense ($2800) of the owner.) Cooling energy consumption was reduced by 43% from 69.1 kWh/day to 39.7 kWh/day. The third retrofit was turning off the attic exhaust fan. Energy consumption (including the exhaust fan motor) was reduced by 36% from 39.7 kWh/day to 25.4 kWh/day. In total, the three retrofits cut cooling energy consumption 74% from 99.6 kWh/day to 25.4 kWh/day.
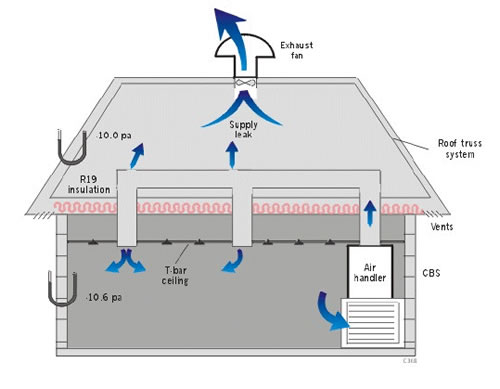
In addition to reducing cooling energy consumption by 36%, turning
off the attic exhaust fan lowered building pressure from -16.0 pascals
to -0.4 pascals and decreased the building ventilation rate from 0.79
ach to 0.24 ach. Carbon dioxide concentration increased from an average
620 ppm to 1150 ppm during weekday afternoon hours. Since concentrations
above 1000 ppm is indicative of ventilation below 20 cfh/person, it
would be recommended that additional ventilation be installed. One option
would be to downsize the attic exhaust fan from its current 730 cfm
to perhaps 200 cfm. This would draw hot air from the attic space, slightly
depressurize the attic with respect to the occupied space, and ensure
that air was flowing from the occupied space to the attic and not vice
versa. Note that air entering the occupied space from outdoors has much
less heat than air entering from the attic. Therefore, the direction
of flow across the leaky ceiling plane is very important from a cooling
load point-of-view.
Indoor relative humidity increased from 72% pre-duct repair to 76%
post-duct repair. Relative humidity remained at 76% when the air conditioner
was replaced. However, when the attic exhaust fan was turned off, indoor
relative humidity decreased from 76% to 58%, as a result of
the decrease in ventilation rate from 0.79 ach to 0.24 ach.
The energy savings in this building were dramatic. The total retrofit
package -- duct repairs, AC change-out, and turning off the exhaust
fan -- reduced cooling energy use by an estimated $1114 per year. Given
the total retrofit cost of $3180, the simple payback period is 2.9 years.
Looking at the individual measures, duct repair pays for itself in 0.7
years, AC change-out pays for itself in 6.5 years, and shutting
off the attic exhaust fan pays for itself in 0.2 years (assume $50 service
call). Duct repairs required six person-hours and $30 in materials.
5.5.11 Realty office 3 (#39)
This building is a 50-year-old converted residence
served by two air conditioners. Ductwork is located in the attic. The
air handlers are in one closet and are located on support platforms
that act as return plenums. Considerable return leakage (414 cfm as
operated) comes from the attic by way of walls. It is interesting to
note that the attic insulation had been compressed and badly soiled
by rodent infestation, and the air drawn from the attic was contributing
to indoor air quality complaints. The attic was a very difficult environment
in which to spend any time because of the pungent odor.
A number of flaws lead to considerable return leakage associated
with the support platforms that were enclosed to form return plenums.
One plenum had two through-the-wall return grills and another return
grill drawing air from inside the closet, thus making the closet act
as a return plenum. There was a return transfer in the closet door,
but it was undersized. As a result, the mechanical closet was substantially
depressurized and was drawing air from the attic. The second plenum
had one transfer through a wall and some leakage through a hole in the
wood floor over a small crawispace. Unsealed return transfers in the
closet walls allowed hot attic air to be drawn down the walls from the
attic.
Supply leakage was minor and due to time constraints was not repaired
(repairs were begun after close of business, two hours were spent cleaning
up a condensate leakage problem which interfered with the repair, and
post-repair testing work was completed at 1 AM!). Leakage in the closet
was also not repaired, due to oversight. Post repair testing showed
that only 45% of the duct leakage had been sealed. Return leak fractions
decreased from 10.5% to 5.2% on the west system
and from 2 1.6% to 5.6% on the east system. Overall return leakage decreased
by 66%.
Relative humidity in the occupied space did not change as a result
of the repairs, remaining at 56%. Cooling energy use decreased
by 7.5% from an average 117.7 kWh/day to 108.9 kWh/day. Repair
time was 4 person-hours and $35 in materials. Energy savings
pay for the estimated $235 repair cost in 2.0 years.
5.5.12 Safety class (#40)
Two roof-top air conditioners with combined capacity of 9 tons serve this 2460 square foot unit located in the same strip mall as the court office and school supply. This space had some of the worst uncontrolled air flows of the entire sample, yet repairs produced only modest savings. Following is a brief list of the failures.
- For outdoor air, a grill had been installed in the return duct of the west system in the unconditioned ceiling space. This outdoor air was drawing 750 cfm of air into the return duct from the space between the insulation (located on the ceiling) and the roof deck. Since the roof deck was the primary air barrier of the building, this “outdoor air” was not providing significant ventilation and was drawing large amounts of unwanted heat into the space (Figure 5.7).
- There were substantial other duct leaks, including a 1 inch by 30 inch leak at the west system air handler to main supply trunk duct connection which was drawing air into that leak (Figure 5.7)! Note that leaks in supply ducts sometimes draw air into the duct because of venturi forces.
-
Closed doors caused major pressure and flow imbalances since
the returns and supplies were located in mutually exclusive zones.
The return for one system was located in a closet positioned between
depressurized to -13 pascals.
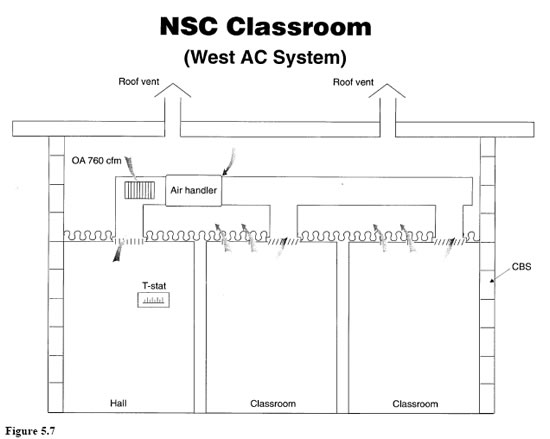
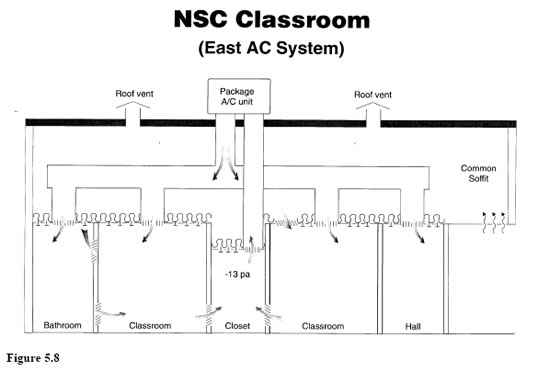
-
Transfer grills were located in the doors going to the adjacent classrooms, allowing some return air flow. However, since this closet has a suspended, t-bar ceiling and was depressurized to -13 pascals, it was pulling considerable air from the unconditioned ceiling space above. The return for the other air conditioner was located in the hall while the supplies for that system were located exclusively in the classrooms. Thus, the classrooms were operating at positive pressure and the closet and hallway where the return grills were located were operating at negative pressure. Therefore, room air was moving from the room, through the suspended t-bar ceilings and batt insulation, through the ceiling space where it picked up heat, and then down through the insulation and suspended ceilings in the closet and hallway. -
Each of the air conditioners served both classrooms, causing virtually identical cooling energy use whether one or both classrooms was in use. The east thermostat was located in one of the two classrooms while the west thermostat was located in the hallway, a space that had no supply registers. Since the west system thermostat was not sensing the cooling that was occurring in the classrooms, the majority of the cooling for both classrooms was done by the west system.
Repairs included sealing 51% of the duct leaks, installing return
transfer ducts (two 2’x4’ grills in each classroom), adding
an additional return duct to the south classroom, installing an additional
return transfer grill from the closet to the north classroom, airtightening
the tbar ceiling in the depressurized closet, and
moving the thermostat from the hall to a classroom. Surprisingly, energy
savings were only 17% when 50% savings could have been imagined.
Two factors may explain the savings shortfall. 1) Moving the west thermostat
shifted much of the cooling systems run time from the west unit to the
less efficient east unit. 2) Considerable recapture of lost cooling
may be occurring because the uncontrolled air flows occur primarily
within the ceiling space. Though it is outside the primary thermal barrier
(insulation located on the ceiling), it is inside the primary air barrier
(the roof deck) and the roof deck may have significant insulation value
(thermal resistance).
Relative humidity in the occupied space declined from 55% to
51% as a result of the repairs.
Cooling energy use decreased by 17.0% from an average 50.8 kWh/day
to 42.1 kWh/day.
Repair time was 8 person-hours and $60 in materials. Energy savings
pay for the estimated
$460 repair cost in 2.5 years.
5.5.13 School supply (#45)
One 7.5-ton roof top package air conditioner serves this strip mall
business. Supply leaks at panel connections and panel knockouts were
sealed on the air handler. Difficulties were experienced in gaining
access to the remaining duct leakage. Large return leaks were sealed
by squeezing one person into the air handler on the return side and
coating the interior of the plenum ductboard with mastic. Leakage in
the remainder of the supply ductwork was not repaired because finding
and repairing all the duct leaks would have been extremely time consuming,
largely because of exterior insulation wrap. Finding the leak sites
requires removing the insulation wrap and replacing it after sealing
air leaks. Since access to the ceiling space requires standing on a
ladder and moving the ladder from one ceiling tile location to another,
such a process is difficult and time consuming, especially considering
the office furniture. The fact that the ceiling tiles have insulation
batts and dust on them makes the process even more difficult and makes
it likely that fibers and dust will fall onto people and furnishings
below. In general, the ceiling access issue represents a significant
barrier to efficient duct repair in a significant proportion of commercial
buildings.
Repairs to this system decreased CFM25 by 55% from 418 to 190. Relative
humidity in the occupied space declined from 48% pre-repair to 46% post-repair.
Cooling energy use decreased 6.9% from an average 69.8 kWh/day to 64.8
kWh/day. Repair time was 2.5 person-hours and $30 in materials. Energy
savings pay for the estimated $155 repair cost in 2.4 years.
5.5.14 Court office (#46)
Two roof-top air conditioners with combined capacity of 11.5 tons
serve this 3735 square foot strip mall unit located next to the school
supply store. Sixty-five percent of total leakage in this leaky duct
system was sealed. Repairs were made to the return ducts at the grill
connections and the east system return was sealed by coating the interior
of the ductboard with mastic. The suspended ceiling had not been hung
very securely, and over time the panels began to sag. As a result the
supply grills pulled away from the ducts in some locations. The only
supply side repair was at the supply-register-to-ceiling tile connections,
since the ducts were wrapped metal. Even though 65% of the duct leakage
was repaired, cooling energy consumption actually increased by 6.6 percent!
(This was the only retrofit which did not show energy savings.)
In retrospect we have tried to determine why energy use would increase.
The one factor that may provide some explanation is leakiness of the
building shell. This office is the leakiest of the seventy buildings
tested and has an ACH5O of 52.8. It may be that because the very leaky
ceiling and vented roof deck allows wind to move air across it, air
exchange may not change significantly as a result of duct repair. Note
that the plastics office, which showed an unexpectedly small savings
of 4% also had a very leaky building shell (ACH5O=50.0). It may be that
leaky buildings will often yield only small energy savings from duct
repair. More research is required to answer that question.
Repairs decreased duct CFM25 by 65% from 830 to 292. Relative humidity
in the occupied space declined slightly from 49% pre-repair to 47% post-repair.
Cooling energy use increased by 6.6%from an average 137.8 kWhlday to
147.0 kWh/day. Repair time was 4 person-hours and $25 in materials.
5.5.15 Metal building company (#53)
Two cooling systems with total capacity of 9 tons serve this 3672
square foot metal building. Ceiling insulation is located both on top
of the ceiling tiles and on the bottom of the sloped metal deck above.
Some moderate sized supply leaks existed. The large duct leaks, however,
occurred because the mechanical room for one of the larger of the two
systems was used as a return plenum, and the ceiling of that room is
suspended t-bar. Of the total 1453 CFM25 in the two duct systems, 49%
existed in the ceiling of that mechanical room.
Repairs consisted of repairing one major supply leak, sealing return
ducts, airtightening the t-bar ceiling in the mechanical room, and reducing
the mechanical room pressure from -19.1 pascals to -4.2 pascals by installing
a louvered door in place of the solid door. Return leak fraction for
the mechanical room decreased from 28% to 4% as a result. Cooling energy
use declined by 10.8% as a result of the retrofit. Larger savings might
have been expected, except that the building has two thermal barriers
-- insulation on top of the ceiling and insulation at the roof deck.
All of the duct leakage occurs inside the building air barrier and inside
one of the two thermal barriers. If the roof deck insulation had not
been there, these duct leak repairs might have produced energy savings
of 25% or more. Another way of saying this is that this building was
saved from the full effects of uncontrolled air flow by having a second
thermal barrier at the roof deck.
A general lesson can be stated here. If the ductwork and ceiling
spaces are located inside the primary air barrier and thermal barrier,
then the consequences of uncontrolled air flow are largely obviated.
Repairs to this system decreased CFM25 by 43% from 1453 to 833. Relative
humidity in the occupied space was at 41% before and after repairs.
Cooling energy use decreased from an average 87.2 kWh/day to 77.8 kWh/day,
or 10.8%. Repair time was 5 person-hours and $90 in materials. Energy
savings pay for the estimated $340 repair cost in 2.2 years.
5.5.16 Realty office 4 (#54)
Two air conditioning systems serve this 2635 square foot building.
The air handlers are located in closets which act as return plenums.
The east closet was depressurized to -19 pascals and the west closet
to -16 pascals, but only when the closet doors were closed. The ceiling
of the east closet was moderately leaky (one foot square tongue-in-groove
ceiling tiles) and the ceiling of the west closet was gypsum board.
The east closet door was closed at all times thereby causing substantial
return leaks. The west closet door was open all the time, so there was
no return leakage into that mechanical closet and no tightening of the
closet was done. The east mechanical closet was repaired primarily by
tightening the ceiling and walls. Some supply leaks were repaired. Repairs
decreased duct CFM25 from 885 CFM25 to 289 CFM25. Relative humidity
in the occupied space increased from 54% prerepair to 55% post-repair.
Cooling energy use decreased 13.7% from an average 61.9 kWhlday to 53.4 kWh/day.
Repair time was twelve person-hours and $75 in materials. Energy
savings pay for the estimated $675 repair cost in 4.9 years.
5.5.17 Plastic fabrication office (#56)
This was the most simple yet most perplexing retrofit. While large
duct leaks were repaired, energy savings was a meager 4%. A single two-ton
air conditioner serves the small 360 square foot office space of this
plastics manufacturing warehouse facility. The office itself, the air
handler, and the ductwork are all located inside an unconditioned warehouse
space. Significant leakage existed at the return support plenum and
filter access causing 26% of the return air to originate in this hot
warehouse. Supply leaks also exist at the supply register connections.
Total duct leakage was reduced by 70% from 186 CFM25 to 55 CFM25. Return
leaks declined from 26% to 2%. The small energy savings was a surprise.
Several factors were examined to determine why the savings were so
small. The temperature drop from the return to supply increased from
10.0°F (5.6°C) to 12.2°F (6.8°C) when repaired. Based
on this, the authors would expect at least an 18% reduction in cooling
energy use. Variations in room temperature were examined; the thermostat
setting remained constant throughout the monitoring period. A later
experiment was done to look at creating a new return duct leak (19%
return leak fraction); this increased energy used by 2.8%.
One variable which may offer explanation is the extreme leakiness
of the space; ACH5O equals 50.0. This office was the second leakiest
of all sites monitored, nearly three times as leaky as the average for
the entire 70 building sample. It may be that shell leaks allow considerable
air transport between the occupied space and the warehouse, even when
the duct leaks are not operating. An additional factor may be that since
most of the shell leakage is to the unconditioned warehouse, perhaps
some of the energy lost from duct leaks is recovered by cooling and
drying the warehouse space.
Relative humidity in the occupied space increased from 54% pre-repair
to 55% post-repair.
Cooling energy use decreased 4.3% from an average 22.8 kWh/day to
21.8 kWh/day.
Repair time was four person-hours and $25 in materials. Energy savings
pay for the
estimated $225 repair cost in 11.5 years.
5.5.18 Carpet store (#59)
A 3-ton air conditioner serves this 1584 square foot converted automotive
service station. The air handler and return are completely within the conditioned
space. Moderate supply leaks exist. This site was chosen even though the potential
for savings was not expected to be great. Only supply grill connections and
one elbow seam were repaired. These repairs reduced total duct leakage by 45.6%, from
158 CFM25 to 86 CFM25. Relative humidity decreased from 53% pre-repair
to 51% post-repair. Cooling energy use decreased 11.9% from an average
21.7 kWh/day to 19.1 kWh/day. Repairs were completed in one person- hour using
only $8 in materials. Energy savings pay for the estimated $58 repair
cost in 1.5 years.
5.5.19 Manufactured office 3 (#60)
One ground-mounted 3-ton package air conditioner served this single-wide
commercial trailer. Duct repairs were made to the main return duct at the air
handler and the floor register, and to supply register connections in the floor.
Some package air conditioner panel leaks could not be sealed. Duct CFM25 decreased 45% from
251 CFM25 to 138 CFM25. Relative humidity increased from 54% pre-repair
to 57% post-repair. Cooling energy use decreased 14.3% from an average
31.4 kWh/day to 26.9 kWh/day. Repairs were completed in five person-hours using
only $10 in materials. Energy savings pay for the estimated $260 repair cost
in 4.7 years.
5.5.20 Manufactured office 4 (#61)
The two wall-mounted air conditioning package units serve this modular
office. Part of the exterior wall cavity is used for return air for both systems.
Return leakage was repaired in the wall cavity and at the duct board connections
at the air handler. Supply ducts were located in the small space between the
ceiling and roof deck, and were therefore largely inaccessible. Therefore,
only supply leaks accessible through the registers were repaired. Only 30%
of the total duct leakage (as seen by the duct test rig) was repaired. As a
consequence, energy savings was only 4%. Greater savings would be expected
if the ductwork was more accessible.
Duct CFM25 decreased 30% from 793 CFM25 to 554 CFM25. Relative humidity
decreased from 46% pre-repair to 45% post-repair. Cooling energy use
decreased 4.3% from an average 70.74 kWh/day to 67.6 kWh/day. Repairs
were completed in four person-hours using only $25 in materials. Energy
savings pay for the estimated $225 repair cost in 4.7 years.
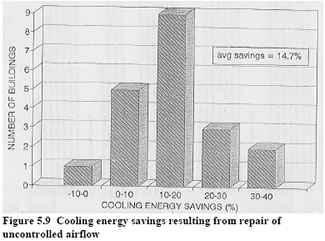 5.6
Discussion of Energy Savings
5.6
Discussion of Energy Savings
Energy savings were found in 18 of 19 buildings in which uncontrolled
air flow was repaired. In one building, energy use increased by 6.7%.
In the 18 which showed energy use reduction, savings ranged from 4.3%
to 36% (Figure 5.9). For 19 buildings (including the one which showed
an increase in energy use), cooling energy consumption declined by
an averaged 14.7%, or 12.4 kWh/day during the hottest six months
of the cooling season. Over an eight month period, savings would be $0.75/day savings
or $182 per year (based on 7.5 cents/kWh). Since the average
repair cost was $454, the average simple payback period was 2.5 years.
While 14.7% savings is substantial and the payback periods are attractive,
it is the authors opinion that greater energy savings could be available.
In retrospect, we see that only 59% of the duct system leaks
were sealed (in buildings where the ducts were the target of repair).
With added attention to achieving more complete repair, we estimate
that 70% or more of the leakage could have been sealed.
There are several reasons why we believe that considerably more repair
savings can be achieved:
- Some repairs were not as comprehensive as they could have been because of project budget limitations.
- For efficiency reasons, we usually attempted to retest the building and HVAC systems on the same day as repairs were done. This places additional demands on time available for repairs.
- Business owners are sensitive to interference with the normal activities of their employees or their customers. Therefore, there was usually some pressure on repair personnel to finish quickly and considerable resistance to turning off the HVAC systems so that duct test rigs could be installed (the duct test rig could then be used to monitor duct airtightening progress).
- In buildings that have ceiling spaces (as opposed to attic spaces), repairs are generally done by lifting ceiling tiles. The process of finding the leaks and then making the repairs is made more complicated by the need to move ladders incrementally around the room while avoiding furniture and people. Scheduling repairs outside of business hours is the best way to avoid these problems. When ducts are located in an attic space, repair is considerably easier because persons can move around within the attic space without significant bother to persons in the occupied space.
- Additional savings may also be available with repair technologies which have not yet been developed. A prime example is very leaky ceiling planes in many commercial buildings. When methods are developed to either airtighten suspended ceilings or move the air barrier to another building plane (preferably where the thermal barrier is located), then considerably more savings will result. New aerosol deposition technologies which are currently under development may prove to be useful in sealing ducts located in ceiling spaces, especially those with exterior insulation wrap.
- There is a learning curve associated with repair of uncontrolled air flow. There is a learning curve for diagnosis -- accurately determining what is going on and what should be done. There is also a learning curve for repair -- what to repair, what repair technologies can be used (for example, how to airtighten ceilings), and how to accomplish the repair. In this project, staff were on the early stages of the learning curve regarding diagnosis and repair of uncontrolled air flow. In several cases, repair was incomplete because of incomplete understanding of the interacting relationships between 1) duct repair and exhaust fans and 2) interacting relationships between duct repair and very leaky building shells. Having completed repairs on 20 buildings, the authors now better understand these interacting relationships and can prescribe (and train) improved retrofits. There is still more to be learned, especially in the areas of exhaust/intake imbalance, building envelope airtightening, improved return air, and proper sizing of ventilation.
If more of the duct leakage had been repaired and more complete addressing
of the exhaust fan and building leakage had occurred, then savings would
have been considerably greater. If it is assumed that 75% of
duct leaks can be repaired and that repair technologies for providing
make-up air and airtightening buildings is available, then we project
that about 25% cooling energy savings could have been realized
in these 19 buildings.
5.6.1 Commercial savings compared to residential savings
While the energy savings in these commercial buildings was less than
that found in residences on a percentage basis (14.7% for commercial
versus 17.2% for residential duct repair), the savings are larger in
absolute terms, 12.4 kWh/day savings versus 7.2 kWh/day savings. Even
normalizing to building size, the savings are larger in commercial buildings.
In 48 residences, pre-repair cooling energy consumption was 24.6 kWh/day
per 1000 square feet and savings were 4.24 kWh/day per 1000 square feet
(Cummings, Tooley, Moyer, 1991). By comparison, in these 19 commercial
buildings (average floor area 2541 square feet), pre-repair cooling
energy consumption was 34.4 kWh/day per 1000 square feet (or 40% greater
than in residences) and savings were 4.84 kWh/day per 1000 square feet.
From an electrical demand point of view, commercial buildings cooling
energy consumption is focussed more intensely on daytime periods of
weekdays, which is also the time when most utilities experience peak
demand. Therefore, it might be expected that commercial buildings UAF
retrofit programs should provide disproportionate benefit to demand
management. In the following section we will look at the monitored demand
savings which resulted from repair of uncontrolled air flow.
5.7 Peak Electrical Demand Analysis
Compared to residences, commercial building cooling energy consumption
is more concentrated during weekday daytime hours, because that is the
period of maximum occupancy. In 63% of the 20-building sample, thermostats
were raised or turned off during evening or weekend hours. In the remaining
37%, set-points remained constant throughout the entire week. Based
on questionnaire results, the average business was occupied from 7:30
AM to 6 PM on weekdays and open about 4 hours per weekend, for a total
of 56.5 hours per week. By contrast, average residential occupancy may
be on the order of 130 hours per week (of a total 168 hours per week).
Therefore, internally heat generation and cooling systems operation
is much more focussed on weekday, daytime periods, which also coincides
with periods when summer electrical demand is at a peak.
Reduction in peak electrical cooling demand was analyzed for these
19 buildings. Peak electrical demand was evaluated by selecting pre-repair
and post-repair days which are approximately comparable, and then creating
a 24-hour composite energy use plots. Following is a discussion of the
criteria used for selecting days for analysis.
5.7.1 Criteria for selecting peak demand days
Analysis of power demand reduction was done by choosing the warmest
sets of days for which comparable pre-repair and post-repair outside
temperature, solar radiation, and “outdoor - indoor temperature
difference” data were available. Typically the sample size was
six to twelve days. These sets of days were then converted to composite
days -- that is, the data is averaged for each hour of the day. This
results in 24 values, for temperature, power, and solar radiation for
both pre-repair and post-repair periods. Since the FSEC VAX computer,
which collects all off-site data, operates using Eastern Standard Time,
the results are plotted in Eastern Standard Time. A business which operates
from 9 AM to 5 PM DST will be reflected on the peak demand
reduction graphs as operating from 8 AM to 4 PM EST.
Florida utilities experience summer peak demand in the window of
2 PM to 6 PM EST, with a maximum around 3:30 EST. In the 19 buildings
monitored for energy savings, business hours typically ran from 7 AM
to 4 PM EST, though some deviated from that. For our analysis, we identified
the peak demand period for each building, usually a two or three hour
period, and used that period for comparison of electrical demand. In
10 of the 19 cases, the period 1 PM to 3 PM EST was the peak. The average
peak demand period for these 19 buildings was 1:10 PMto 3:16 PMEST (which
is 2:10 PM to 4:16 PMDST).
5.7.2 Peak demand results
The results of the peak demand analysis before and after repairs
are shown in Table 5.8. The number of days used for comparison
are shown as “# Days”. On average, 8.7 days of prerepair
and 9.7 days of post-repair data were included in the peak demand analysis.
The temperature and solar radiation data are 24-hour averages while
peak demand is the cooling energy consumption rate for the indicated
peak demand period. Solar radiation appears as a low number because
it is a 24 hour average.
Composite 24 hour demand profiles were developed for the 18 buildings
for which sufficient pre-repair and post-repair data was available.
These are presented as Figures 5.10 - 5.14.
If more than one retrofit was employed at a building, they were all
done at the same time and monitored as if one repair. The exception
to this was Realty 2 (building #3 7). In this case, three retrofits
were implemented in three phases and the energy savings due to each
was monitored. The first was duct repair, the second was replacing an
old inefficient air conditioner with a new high efficiency one (this
measure was taken at the initiative and expense of the business owner),
and turning off an attic ventilation fan. The demand reduction shown
in Table 5.8 for this building represents only the duct repair and turning
off the attic exhaust fan (measures related to uncontrolled air flow),
and does not include the demand savings from installing the new air
conditioner. Note that it also includes the fan power savings (0.468
kW) when the attic fan was turned off.
The demand savings from all three phases of retrofit in Realty 2 are
shown in Table 5.9 and Figure 5.12. (Note that the
second retrofit phase, replacement of the air conditioning system is
not an uncontrolled air flow retrofit.) Repairing the substantial duct
leaks reduces peak demand by 1.07 kW. Replacing the air conditioning
system reduces peak demand by 1.84 kW. Turning off the attic exhaust
fan, which was depressurizing the entire building to -15 pascals, lowered
cooling energy demand by 0.28 kW and fan power by 0.47 kW. In total,
peak electrical demand was reduced by 3.66 kW. Since the cost of the
three retrofits was $3180, avoided demand cost was $870 per kW. Since
the uncontrolled air flow retrofits (duct repair and turning off the
attic exhaust fan) cost was $380, avoided demand cost was $104 per kW.
For the entire sample of 18 buildings (data for buildings 3 and 12
was insufficient for analysis), average demand savings were 0.71 kW,
or 9.4% of total cooling demand. Since the average cost of these retrofits
was $454, this means the cost of avoided electrical generating capacity
was $767 per kW, approximately in line with the cost of building new
generation capacity. When one considers the combined demand savings
and energy savings, repair of uncontrolled air flow can be seen as a
very cost-effective measure.
The average 24-hour outdoor temperature on these days was 80.7F,
or about 3F cooler than the hottest summer days. Therefore, we could
expect even greater demand reduction on the hottest summer days when
the utilities are experiencing their system-wide peak demand.
Thirteen of the 18 buildings had 6% or greater peak cooling energy
demand reduction, ranging from 6.5% to 28% and averaging 13.4%. Five
of the 18 buildings had less than 2% peak demand reduction, ranging
from +1.4% to -2.5% and averaging -0.9% savings. Essentially, we can
say that five buildings showed no demand reduction while 13 buildings
showed an average 13.4% demand reduction. Let’s look at the five
that had no demand reduction to see what factors could account for the
poor results.
One of them, the Bar and Grill (building #31) had a significant UAF
problem which was not dealt with because of diagnostic oversight, as
discussed earlier in this report in the energy savings section. That
problem was a large exhaust fan, with no designed make up air, pulling
attic air into the building for about eight hours per day. Three of
the other four buildings had very little insulation in the ceiling/attic
spaces. This insulation deficit tends to cause a sharp (solar radiation
induced) spike in cooling load during the hot hours of the day. Transport
of heat from the hot attic/ceiling space operates in parallel to the
conductive heat transfer through the poor insulation. Therefore, addition
of insulation in these buildings may have produced both substantial
energy savings and demand savings. The fifth is the court office (building
#46). We cannot identify reason why energy savings did not occur.
5.8 Energy Savings and Peak Demand Savings Conclusions
Repair of uncontrolled air flow in 19 buildings produced cooling
energy savings of 14.7%. It is estimated that better diagnosis and more
complete repair would yield 25% cooling energy savings. The average
cost of repair was $454. Average daily cooling energy savings were 12.4
kWh per day. Projected annual savings, excluding the heating season,
were $182. The energy savings pay for the repairs in 2.5 years.
Peak electrical demand savings from uncontrolled air flow repairs
in 18 buildings produced peak demand savings of 9.4% or 0.71 kW. Based
on an estimated $700 cost of bringing new generation capacity on line,
this retrofit displaces the need for about $500 in new capacity.
When energy and demand savings are considered together, the cost
benefits of uncontrolled air flow retrofits are extremely promising.
1f for example, a utility were willing to pay half the cost of the retrofit
($227), then the utility would in essence be getting new system capacity
at a cost of $320/kW and the customer would be obtaining $182/year energy
savings which provide a 1.2 year simple payback. Add to this possible
comfort and indoor air quality benefits, such a program is a win-win
situation for all parties.
Table 5.1
Building Airtightness, Duct Airtightness, Infiltration rates, Air
Flows and Pressures Before Repair
| BUILDING | Bldg CFM5O |
Bldg ACH5O |
Bldg C |
Bldg n |
Bldg r |
Duct CFM25 |
ach AHON |
ach AHOFF |
OA & MA cfm |
RLF1o w din |
exh cfm |
dP ON |
| 2 Auditorium | 10265 |
6.84 |
1230.18 |
0.54 |
0.9993 |
N/A |
1.83 |
0.20 |
206 |
2700 |
686 |
1.1 |
| 3 Dentist 1 | 8826 |
21.37 |
876.95 |
0.59 |
0.9867 |
846 |
0.75 |
0.33 |
0 |
206 |
337 |
0.1 |
| 9 Dentist 2 | 3265 |
15.24 |
865.77 |
0.34 |
0.9948 |
396 |
3.91 |
0.26 |
911 |
232 |
325 |
5.2 |
| 12 Sports Building | 22383 |
8.46 |
1763.55 |
0.65 |
0.9932 |
N/A |
0.78 |
0.21 |
1426 |
592 |
2052 |
-0.3 |
| 20 City Hall | 3296 |
7.44 |
331.16 |
0.59 |
0.9988 |
1632 |
0.60 |
0.32 |
0 |
284 |
209 |
0.2 |
| 21 Health Clinic 2 | 9005 |
24.83 |
714.22 |
0.65 |
0.9958 |
2576 |
0.84 |
0.17 |
0 |
1292 |
386 |
1.8 |
| 25 Sports Complex | 12987 |
31.45 |
913.76 |
0.68 |
0.9983 |
788 |
0.71 |
0.50 |
0 |
555 |
155 |
1.5 |
| 29 Mfg Office 2 | 16727 |
24.89 |
929.37 |
0.74 |
0.9925 |
1418 |
1.10 |
0.65 |
1297 |
602 |
357 |
-0.5 |
| 31 Bar and Grill | 6651 |
17.50 |
628.79 |
0.60 |
0.9999 |
655 |
2.34 |
0.64 |
0 |
505 |
987 |
0.8 |
| 37 Realty 2 | 2241 |
9.30 |
214.79 |
0.60 |
0.9972 |
571 |
0.20 |
0.19 |
0 |
0 |
730 |
-14.3 |
| 39 Realty 3 | 5879 |
17.51 |
409.45 |
0.68 |
0.9952 |
1276 |
0.59 |
0.34 |
0 |
414 |
76 |
-0.5 |
| 40 Safety Class | 10646 |
25.97 |
1243.23 |
0.55 |
0.9964 |
1268 |
0.61 |
0.33 |
0 |
2034 |
0 |
2.0 |
| 45 School Supply | 9133 |
21.49 |
696.39 |
0.66 |
0.9924 |
418 |
0.57 |
0.24 |
0 |
288 |
0 |
0.0 |
| 46 Court Office | 32886 |
52.83 |
704.52 |
0.98 |
0.995 1 |
830 |
0.46 |
0.42 |
0 |
600 |
0 |
0.0 |
| 53 MetalBldgCo | 3545 |
7.04 |
268.64 |
0.66 |
0.9977 |
1453 |
0.28 |
0.18 |
0 |
567 |
67 |
-2.1 |
| 54 Realty 4 | 7673 |
21.84 |
387.61 |
0.76 |
0.9977 |
885 |
1.15 |
0.67 |
0 |
92 |
416 |
0.1 |
| 56 Plastic Fabricate | 2401 |
50.02 |
236.84 |
0.59 |
0.9998 |
186 |
N/A |
0.15 |
0 |
193 |
0 |
-0.6 |
| 59 Carpet Store | 5338 |
18.38 |
309.70 |
0.73 |
0.9939 |
158 |
0.63 |
0.61 |
0 |
0 |
194 |
-0.8 |
| 60 MfgOffice3 | 1281 |
12.20 |
118.17 |
0.61 |
0.9992 |
251 |
1.28 |
0.35 |
0 |
106 |
0 |
-0.6 |
| 61 Mfg Office 4 | 3592 |
20.41 |
360.65 |
0.59 |
0.9953 |
793 |
1.01 |
0.45 |
0 |
128 |
0 |
-0.2 |
| AVERAGE | 8901 |
20.75 |
660.19 |
0.61 |
0.9960 |
911 |
1.03 |
0.36 |
192 |
570 |
349 |
0.1 |
Table
5.2
Types of Uncontrolled Air Flow Repair That Were Implemented (X) and Were Not
Implemented (O)
Building |
Duct Leaks |
Building Cavities |
Return Air |
Outdoor Air |
Building Shell |
Make
Up Air |
Reduced Exhaust |
|
2 |
Auditorium | . |
X |
. |
. |
. |
. |
. |
3 |
Dentist 1 | X |
. |
. |
. |
X |
. |
. |
9 |
Dentist 2 | . |
. |
. |
X |
. |
. |
. |
12 |
Sports Building | . |
X |
O |
. |
. |
. |
O |
20 |
City Hall | X |
. |
. |
. |
X |
. |
. |
21 |
Health Clinic 2 | X |
X |
X |
. |
. |
. |
. |
25 |
Sports Complex | X |
X |
. |
. |
. |
. |
.. |
29 |
Manuf Office 2 | . |
. |
. |
X |
X |
. |
. |
31 |
Bar and Grill | X |
. |
. |
. |
O |
O |
. |
37 |
Realty 2 | XX |
. |
. |
. |
. |
. |
X |
39 |
Realty 3 | X |
X |
O |
. |
. |
. |
. |
40 |
Safety Class | X |
X |
X |
X |
O |
. |
. |
45 |
School Supply | X |
. |
. |
. |
O |
. |
. |
46 |
Court Office | X |
. |
. |
. |
O |
. |
. |
53 |
Metal Bldg Co | X |
X |
X |
. |
. |
. |
. |
54 |
Realty 4 | X |
X |
X |
. |
. |
. |
. |
56 |
Plastic Fabricate | X |
X |
. |
. |
O |
. |
. |
59 |
Carpet Store | X |
. |
. |
. |
. |
. |
. |
60 |
Manuf Office 3 | X |
. |
. |
. |
. |
. |
. |
61 |
Manuf Office 4 | X |
. |
. . |
. |
. |
. |
. |
Table
5.3
Building Airtightness, Duct Airtightness, Infiltration rates, Air Flows, and
Pressures After Repair
| BUILDING | Bldg CFM5O |
Bldg ACH5O |
Bldg C |
Bldg n |
Bldg r |
Duct CFM25 |
ach AHON |
ach AHOFF |
OA & MA cfm |
RLFIo w cfm |
exh cfm |
dP ON |
| 2 Auditorium | N/A |
N/A |
N/A |
N/A |
N/A |
N/A |
1.47 |
0.18 |
206 |
N/A |
686 |
0.4 |
| 3 Dentist 1 | 9857 |
23.86 |
650.96 |
0.69 |
0.9986 |
396 |
0.66 |
0.3 |
98 |
337 |
0.7 |
|
| 9 Dentist 2 | 3265 |
15.24 |
865.77 |
0.34 |
0.9948 |
396 |
0.30 |
0.26 |
0 |
232 |
325 |
0.4 |
| 12 Sports Building | 17749 |
6.71 |
1350.48 |
0.66 |
0.9917 |
N/A |
0.48 |
N/A |
1426 |
569 |
2052 |
-1.3 |
| 20 City Hall | 2304 |
5.20 |
298.28 |
0.52 |
0.9966 |
795 |
0.79 |
0.35 |
0 |
188 |
209 |
0.0 |
| 21 Health Clinic 2 | 9208 |
25.39 |
774.06 |
0.63 |
0.9994 |
227 |
0.68 |
0.28 |
0 |
30 |
386 |
0.3 |
| 25 Sports Complex | 11900 |
28.82 |
1316.61 |
0.56 |
0.9945 |
154 |
0.70 |
0.54 |
0 |
84 |
155 |
0.6 |
| 29 Mfg Office 2 | 4330 |
6.44 |
282.98 |
0.70 |
0.9979 |
1418 |
0.69 |
0.41 |
589 |
238 |
357 |
0.8 |
| 31 BarandGrill | 6317 |
16.62 |
646.10 |
0.58 |
0.9973 |
272 |
2.47 |
N/A |
0 |
57 |
987 |
-2.0 |
| 37 Realty 2 | 2033 |
8.43 |
213.47 |
0.58 |
0.9852 |
112 |
0.33 |
0.15 |
0 |
0 |
730 |
-0.6 |
| 39 Realty 3 | 4869 |
14.50 |
413.05 |
0.63 |
0.9911 |
700 |
0.67 |
N/A |
0 |
123 |
76 |
0.4 |
| 40 Safety Class | 8744 |
21.33 |
763.72 |
0.62 |
0.9890 |
621 |
0.92 |
0.24 |
0 |
478 |
0 |
0.2 |
| 45 School Supply | 8991 |
21.15 |
585.82 |
0.70 |
0.9941 |
190 |
1.12 |
0.86 |
0 |
0 |
0 |
0.3 |
| 46 Court Office | 32072* |
52.83* |
N/A |
N/A |
N/A |
292 |
1.49 |
1.23 |
0 |
215 |
0 |
1.3 |
| 53 MetalBldgCo | 3419 |
6.79 |
273.43 |
0.65 |
0.9907 |
833 |
0.25 |
0.18 |
0 |
249 |
67 |
-2.0 |
| 54 Realty4 | 7580 |
21.57 |
518.59 |
0.69 |
0.9904 |
289 |
0.96 |
N/A |
0 |
131 |
416 |
-2.0 |
| 56 Plastic Fabricate | 2208** |
46.00** |
N/A |
N/A |
N/A |
55 |
1.6 |
0.76 |
0 |
18 |
0 |
1.1 |
| 59 Carpet Store | 4974 |
17.13 |
315.12 |
0.71 |
0.9950 |
86 |
0.71 |
1.31 |
0 |
0 |
194 |
-0.1 |
| 60 Mfg Office 3 | 1119 |
10.66 |
84.78 |
0.66 |
0.9968 |
138 |
1.11 |
N/A |
0 |
52 |
0 |
-0.2 |
| 61 Mfg Office 4 | 2795 |
15.88 |
254.7 |
0.61 |
0.9996 |
554 |
0.7 |
0.24 |
0 |
71 |
0 |
-0.0 |
| AVERAGE | 7565 |
19.19 |
565.17 |
0.62 |
0.9943 |
418 |
0.90 |
0.48 |
111 |
149 |
349 |
-0.1 |
*
Pre-repair test data is used here because no building shell tightening
was done and duct repairs were done inside the primary air narrier.
** Test not available. Ceiling is primary air barrier and ducts
are located
outside this air barrier, so the change between pre- and post-duct
CFM
was subtracted from the pre-building total CFM5O.
Table
5.4
Building and Duct Airtightness Before and After Repair
| BUILDING | Pre
Bldg CFM5O |
Post
Bldg CFM5O |
Percent Reduction |
Pre
Bldg ACH5O |
Post
Bldg ACH5O |
Percent Reduction |
Pre
Duct CFM25 |
Post
Duct CFM25 |
Percent Reduction |
| 2 Auditorium | 10265* |
N/A |
N/A |
6.84* |
N/A |
N/A |
N/A |
N/A |
N/A |
| 3 Dentist 1 | 8826 |
9857 |
-11.7 |
21.37 |
23.86 |
-11.7 |
846 |
396 |
53.2 |
| 9 Dentist 2 | 3265 |
3265* |
0.0 |
15.24 |
15.24** |
‘ |
396 |
396 |
** |
| 12 Sports Building | 22383 |
17749 |
20.7 |
8.46 |
6.71 |
20.7 |
N/A |
N/A |
N/A |
| 20 City Hall | 3296 |
2304 |
30.1 |
7.44 |
5.20 |
30.1 |
1632 |
795 |
51.3 |
| 21 Health Clinic 2 | 9005 |
9208 |
-2.3 |
24.83 |
25.39 |
-2.3 |
2576 |
227 |
91.2 |
| 25 Sports Complex | 12987 |
11900 |
8.4 |
31.45 |
28.82 |
8.4 |
788 |
154 |
80.5 |
| 29 MfgOffice2 | 16727 |
4330 |
74.1 |
24.89 |
6.44 |
74.1 |
1418 |
1418* |
** |
| 31 Bar and Grill | 6651 |
6317 |
5.0 |
17.50 |
16.62 |
5.0 |
655 |
272 |
58.5 |
| 37 Realty2 | 2241 |
2033 |
9.3 |
9.30 |
8.43 |
9.3 |
571 |
112 |
80.4 |
| 39 Realty 3 | 5879 |
4869 |
17.2 |
17.51 |
14.50 |
17.2 |
1276 |
700 |
45.1 |
| 40 Safety Class | 10646 |
8744 |
17.9 |
25.97 |
21.33 |
17.9 |
1268 |
621 |
51.0 |
| 45 SchoolSupply | 9133 |
8991 |
1.6 |
21.49 |
21.15 |
1.6 |
418 |
190 |
54.5 |
| 46 Court Office | 32886 |
32886 |
0.0 |
52.83 |
52.83 |
0.0 |
830 |
292 |
64.8 |
| 53 MetalBldgCo | 3545 |
3419 |
3.6 |
7.04 |
6.79 |
3.6 |
1453 |
833 |
42.7 |
| 54 Realty 4 | 7673 |
7580 |
1.2 |
21.84 |
21.57 |
1.2 |
885 |
289 |
67.3 |
| 56 Plastic Fabricate | 2401 |
2208 |
8.0 |
50.02 |
46.00 |
8.0 |
186 |
55 |
70.4 |
| 59 Carpet Store | 5338 |
4974 |
6.8 |
18.38 |
17.13 |
6.8 |
158 |
86 |
45.6 |
| 60 Mfg Office 3 | 1281 |
1119 |
12.6 |
12.20 |
10.66 |
12.6 |
251 |
138 |
45.0 |
| 61 Mfg Office 4 | 3592 |
2795 |
22.2 |
20.41 |
15.88 |
22.2 |
793 |
554 |
30.1 |
| AVERAGE | 8829 |
7608 |
12.5 |
20.75 |
19.19 |
12.5 |
911 |
418 |
58.2 |
* This
average excluded from colunm average to make values comparable.
** Pre-repair test data is used here because no repairs were made
relating to
this measurement. These numbers not included in averages.
Table
5.5
Building and Duct System Airtightness, Infiltration Rates,
and Return Leak Airflow Rates Before and After Repair
| BUILDING | Before Repair | After Repair | ||||||||
| Bldg ACH50 |
Duct CFM25 |
ach AHON |
ach AHOFF |
RLF1ow cfm |
Bldg ACH5O |
Duct CFM5O |
ach AHON |
ach AHOFF |
RLF1ow cfm |
|
| 2 Auditorium | 6.84 |
N/A |
1.83 |
0.20 |
2700 |
N/A |
N/A |
1.47 |
0.18 |
N/A |
| 3 Dentist 1 | 21.37 |
846 |
0.75 |
0.33 |
206 |
23.86 |
396 |
0.66 |
0.30 |
98 |
| 9 Dentist 2 | 15.24 |
396 |
3.91 |
0.26 |
232 |
15.24 |
396 |
0.30 |
0.26 |
232 |
| 12 Sports Building | 8.46 |
N/A |
0.78 |
0.21 |
592 |
6.71 |
N/A |
0.48 |
N/A |
569 |
| 20 City Hall | 7.44 |
1632 |
0.60 |
0.32 |
284 |
5.20 |
795 |
0.79 |
0.35 |
188 |
| 21 HealthClinic2 | 24.83 |
2576 |
0.84 |
0.17 |
1292 |
25.39 |
227 |
0.68 |
0.28 |
30 |
| 25 Sports Complex | 31.45 |
788 |
0.71 |
0.50 |
555 |
28.82 |
154 |
0.70 |
0.54 |
84 |
| 29 MfgOffice2 | 24.89 |
1418 |
1.10 |
0.65 |
602 |
6.44 |
1418 |
0.69 |
0.41 |
238 |
| 31 BarandGrill | 17.50 |
655 |
2.34 |
0.64 |
505 |
16.62 |
272 |
2.47 |
N/A |
57 |
| 37 Realty 2 | 9.30 |
571 |
0.20 |
0.19 |
0 |
8.43 |
112 |
0.33 |
0.15 |
0 |
| 39 Realty 3 | 17.51 |
1276 |
0.59 |
0.34 |
414 |
14.50 |
700 |
0.67 |
N/A |
123 |
| 40 Safety Class | 25.97 |
1268 |
0.61 |
0.33 |
2034 |
21.33 |
621 |
0.92 |
0.24 |
478 |
| 45 SchoolSupply | 21.49 |
418 |
0.57 |
0.24 |
288 |
21.15 |
190 |
1.12 |
0.86 |
0 |
| 46 CourtOffice | 52.83 |
830 |
0.46 |
0.42 |
600 |
52.83 |
292 |
1.49 |
1.23 |
215 |
| 53 MetalBldgCo | 7.04 |
1453 |
0.28 |
0.18 |
567 |
6.79 |
833 |
0.25 |
0.18 |
249 |
| 54 Realty 4 | 21.84 |
855 |
1.15 |
0.67 |
92 |
21.57 |
289 |
0.96 |
N/A |
131 |
| 56 Plastic Fabricate | 50.02 |
186 |
N/A |
0.15 |
193 |
46.00 |
55 |
1.60 |
0 |
18 |
| 59 Carpet Store | 18.38 |
158 |
0.63 |
0.61 |
0 |
17.13 |
86 |
0.71 |
1.31 |
0 |
| 60 Mfg Office 3 | 12.20 |
251 |
1.28 |
0.35 |
106 |
10.66 |
138 |
1.11 |
N/A |
52 |
| 61 MfgOffice4 | 20.41 |
739 |
1.01 |
0.45 |
128 |
15.88 |
554 |
0.70 |
0.24 |
71 |
| AVERAGE | 20.75 |
911 |
1.03 |
0.36 |
570 |
19.19 |
418 |
0.93 |
0.46 |
149 |
* Comparable test not available.
Table
5.6
Building Airfiows and Pressure Differentials Before and After
Repair
| BUILDING | Pre OA+MA cfm |
Post OA+MA cfm |
Percent Reduction |
Pre RLF1ow cfm |
Post RLF1ow cfm |
Percent Reduction |
Pre dP ON |
Post dP ON |
| 2 Auditorium | 206 |
206 |
0.0 |
2700 |
N/A |
N/A |
1.1 |
0.4 |
| 3 Dentist 1 | 0 |
0 |
0.0 |
206 |
98 |
52.3 |
0.1 |
0.7 |
| 9 Dentist 2 | 911 |
0 |
100.0 |
232 |
232 |
0 |
5.2 |
0.4 |
| 12 Sports Building | 1426 |
1426 |
0.0 |
592 |
569 |
3.9 |
-0.3 |
-1.3 |
| 20 City Hall | 0 |
0 |
0.0 |
284 |
188 |
33.9 |
0.2 |
0.0 |
| 21 HealthClinic2 | 0 |
0 |
0.0 |
1292 |
30 |
97.7 |
1.8 |
0.3 |
| 25 Sports Complex | 0 |
0 |
0.0 |
555 |
84 |
84.9 |
1.5 |
0.6 |
| 29 Mfg Office 2 | 1279 |
589 |
54.6 |
602 |
238 |
60.5 |
-0.5 |
0.8 |
| 31 Bar and Grill | 0 |
0 |
0.0 |
505 |
57 |
88.7 |
-0.8 |
-2.0 |
| 37 Realty 2 | 0 |
0 |
0.0 |
0 |
0 |
0.0 |
-14.3 |
-0.6 |
| 39 Realty 3 | 0 |
0 |
0.0 |
414 |
123 |
70.2 |
-0.5 |
0.4 |
| 40 Safety Class | 0 |
0 |
0.0 |
2034 |
478 |
76.5 |
2.0 |
0.2 |
| 45 School Supply | 0 |
0 |
0.0 |
288 |
0 |
100.0 |
0.0 |
0.3 |
| 46 Court Office | 0 |
0 |
0.0 |
600 |
215 |
64.1 |
0.0 |
1.3 |
| 53 MetalBldgCo | 0 |
0 |
0.0 |
567 |
249 |
56.1 |
-2.1 |
-2.0 |
| 54 Realty 4 | 0 |
0 |
0.0 |
. |
131 |
. |
0.1 |
-2.0 |
| 56 Plastic Fabricate | 0 |
0 |
0.0 |
193 |
18 |
90.7 |
-0.6 |
1.1 |
| 59 Carpet Store | 0 |
0 |
0.0 |
0 |
0 |
0.0 |
-0.8 |
-0.1 |
| 60 Mfg Office 3 | 0 |
0 |
0.0 |
106 |
52 |
50.8 |
-0.6 |
-0.2 |
| 61 Mfg Office 4 | 0 |
0 |
0.0 |
128 |
71 |
44.2 |
-0.2 |
0.0 |
| AVERAGE | 192 |
111 |
7.7 |
595 |
149 |
57.3 |
0.1 |
-0.1 |
* No
repairs were made relating to this measurement.
** The pre test measurement underestimated the return leak
Table
5.7
Cooling Energy Savings and Cost Payback
| BUILDiNG | Pre kWh/Day |
Post kWh/Day |
kWh/Day Saved* |
Percent Savings |
8
Month kWh Saved* |
8
Month $ Saved** |
Repair Costs $ |
Payback Years |
| 2 Auditorium | 130.2 |
119.6 |
10.6 |
8.1 |
2769 |
208 |
430 |
2.1 |
| 3 Dentist 1 | 54.0 |
39.9 |
14.1 |
26.1 |
2251 |
169 |
450 |
2.7 |
| 9 Dentist 2 | 88.4 |
74.0 |
14.3 |
16.2 |
3557 |
267 |
50 |
0.2 |
| 20 City Hall | 137.4 |
109.9 |
27.5 |
20.0 |
4689 |
352 |
900 |
2.6 |
| 21 HealthClinic2 | 96.7 |
72.0 |
24.7 |
25.6 |
4448 |
334 |
1300 |
3.9 |
| 25 Sports Complex | 77.3 |
63.9 |
13.4 |
17.4 |
2779 |
208 |
450 |
2.2 |
| 29 MfgOffice2 | 211.2 |
170.5 |
40.8 |
19.3 |
7620 |
571 |
1280 |
2.2 |
| 31 BarandGrill | 142.4 |
127.3 |
15.1 |
10.6 |
3129 |
235 |
975 |
4.2 |
| 37 Realty 2 Duct | 99.6 |
69.1 |
30.6 |
30.7 |
5938 |
445 |
330 |
0.7 |
| 37 Realty 2 Fan | 39.7 |
25.4 |
14.3 |
36.0 |
3208 |
241 |
50 |
0.2 |
| 39 Realty3 | 117.7 |
108.9 |
8.8 |
7.5 |
1551 |
116 |
235 |
2.0 |
| 40 Safety Class | 50.8 |
42.1 |
8.7 |
17.0 |
2496 |
187 |
460 |
2.5 |
| 45 School Supply | 69.7 |
64.8 |
4.8 |
6.9 |
855 |
64 |
155 |
2.4 |
| 46 Court Office | 137.8 |
147.0 |
-9.2 |
-6.6 |
-2762 |
-207 |
225 |
. |
| 53 Metal Bldg Co | 87.2 |
77.8 |
9.4 |
10.8 |
2041 |
153 |
340 |
2.2 |
| 54 Realty 4 | 61.9 |
53.4 |
8.5 |
13.7 |
1854 |
139 |
675 |
4.9 |
| 56 Plastic Fabricate | 22.8 |
21.8 |
1.0 |
4.3 |
260 |
19 |
225 |
11.5 |
| 59 Carpet Store | 21.7 |
19.1 |
2.6 |
11.9 |
511 |
38 |
58 |
1.5 |
| 60 MfgOffice3 | 31.4 |
26.9 |
4.5 |
14.3 |
732 |
55 |
260 |
4.7 |
| 61 MfgOffice4 | 70.7 |
67.6 |
3.1 |
4.3 |
521 |
39 |
225 |
5.8 |
| AVERAGE | 87.4 |
75.1 |
12.4 |
14.7 |
2422 |
182 |
454 |
2.5 |
* hWk/day
savings based on May-October.
** Annual cooling savings based on March 15-November 15, and sasumes
cost of $0.075/kWh.
Table
5.8
Cooling Energy Peak Demand (kW) Before and After Repair for
Periods Indicated
Outdoor Temperature, Solar Radiation, and dT (T outdoors - T indoors)
are 24 Hour Averages.
| BUILDING | Pre
Repair |
Post
Repair |
Peak Demand Period E.S.T. |
Peak Demand Reduction kW |
Percent Reduction |
||||||||
#
Days |
T
out |
dT |
Solar (W/m2) |
Peak
kW |
#
Days |
T
out |
dT |
Solar
(W/m2) |
Peak kW |
||||
| 2 Auditorium | 7 |
81.6 |
4.0 |
208.3 |
15.96 |
9 |
81.0 |
3.0 |
205.1 |
13.89 |
1-3 |
2.07 |
13.0 |
| 9 Dentist 2 | 4 |
80.7 |
4.7 |
176.5 |
7.90 |
3 |
80.3 |
5.3 |
218.0 |
6.77 |
12-2 |
1.13 |
14.3 |
| 20 City Hall | 3 |
79.9 |
4.1 |
259.4 |
9.70 |
3 |
80.0 |
3.2 |
216.0 |
8.17 |
1-3 |
1.53 |
15.8 |
| 21 Health Clinic 2 | 3 |
80.8 |
3.2 |
220.3 |
8.93 |
3 |
80.3 |
3.3 |
200.9 |
7.20 |
12-2 |
1.73 |
19.4 |
| 25 Sports Complex | 4 |
79.3 |
2.3 |
262.2 |
7.53 |
5 |
80.3 |
0.6 |
227.1 |
6.48 |
1-3 |
1.05 |
13.9 |
| 29 Mfg Office 2 | 12 |
76.0 |
1.2 |
168.1 |
10.68 |
15 |
75.8 |
1.1 |
176.1 |
9.99 |
1-3 |
0.69 |
6.5 |
| 31 Bar and Grill | 6 |
78.8 |
1.3 |
203.5 |
8.53 |
9 |
76.7 |
1.8 |
186.0 |
8.74 |
1-5 |
-0.21 |
-2.5 |
| 37 Realty 2 | 15 |
81.4 |
5.0 |
299.8 |
6.50 |
14 |
82.0 |
5.2 |
289.7 |
4.68 |
1-3 |
1.82 |
28.0 |
| 39 Realty 3 | 9 |
81.4 |
8.6 |
279.4 |
10.39 |
17 |
82.6 |
8.4 |
248.5 |
10.24 |
2-4 |
0.15 |
1.4 |
| 40 Safety Class | 11 |
80.6 |
1.2 |
229.7 |
3.37 |
13 |
80.2 |
1.2 |
233.8 |
2.86 |
5-7 |
0.51 |
15.1 |
| 45 School Supply | 16 |
81.9 |
6.1 |
227.5 |
8.01 |
13 |
81.9 |
6.1 |
280.7 |
7.01 |
1-3 |
1.00 |
12.5 |
| 46 Court Office | 6 |
82.7 |
7.6 |
258.9 |
11.82 |
8 |
82.8 |
7.3 |
261.0 |
11.86 |
1-3 |
-0.04 |
-0.3 |
| 53 Metal Bldg Co | 15 |
81.0 |
4.2 |
261.0 |
8.18 |
14 |
79.8 |
4.1 |
247.2 |
7.53 |
1-4 |
0.65 |
7.9 |
| 54 Realty 4 | 7 |
82.2 |
2.5 |
283.6 |
7.21 |
7 |
82.2 |
2.6 |
230.9 |
6.69 |
1-3 |
0.52 |
7.2 |
| 56 Plastic Fabricate | 13 |
79.7 |
11.5 |
285.9 |
1.87 |
10 |
79.8 |
11.3 |
287.8 |
1.71 |
1-4 |
0.16 |
8.6 |
| 59 Carpet Store | 10 |
83.3 |
4.5 |
271.0 |
1.89 |
12 |
84.1 |
4.5 |
216.4 |
1.66 |
1-3 |
0.23 |
12.2 |
| 60 Mfg Office 3 | 8 |
81.9 |
4.1 |
278.3 |
3.45 |
10 |
82.4 |
4.7 |
263.2 |
3.51 |
1-3 |
-0.06 |
-1.7 |
| 61 Mfg Office 4 | 17 |
79.6 |
2.2 |
280.0 |
5.14 |
9 |
81.0 |
2.1 |
278.1 |
5.22 |
2-4 |
-0.08 |
-1.6 |
| AVERAGE | 9 |
80.7 |
4.3 |
247.4 |
7.61 |
10 |
80.7 |
4.2 |
237.0 |
6.90 |
1-4 |
0.71 |
9.4 |
Table
5.9
Cooling
Energy Peak Demand (kW) Before and After Repair for Periods Indicated
Outdoor Temperature, Solar Radiation, and dT (T outdoors - T
indoors) are 24 Hour Averages.
BUILDING |
Pre
Repair |
Post
Repair |
Peak Demand Period E.S.T. |
Peak Demand Reduction kW | Percent
Reduction |
||||||||
# Days |
T
out |
dT |
Solar (W/m2) |
Peak kW |
# Days |
T
out |
dT |
Solar (W/m2) |
Peak kW |
||||
| 37
Realty 2 duct repair |
10 |
81.6 |
5.1 |
297.5 |
6.5* |
6 |
81.3 |
4.8 |
283.9 |
5.4* |
1-3 |
1.07 |
16.5 |
| 37
Realty 2 duct repair |
6 |
81.3 |
4.8 |
283.9 |
5.4* |
5 |
81.1 |
4.9 |
302.1 |
3.6* |
1-3 |
1.84 |
34.1 |
| 37 Realty 2 attic fan off | 5 |
81.1 |
4.9 |
302.1 |
3.6* |
8 |
82.7 |
5.7 |
295.6 |
2.9 |
1-3 |
0.75 |
20.8 |
| AVERAGE | 7 |
81.4 |
4.9 |
294.5 |
5.2 |
6 |
81.7 |
5.1 |
293.9 |
3.9 |
1-3 |
||
| CUMULATIVE | 3.66 |
71.4 |
|||||||||||
* Peak demand includes AC and attic fan power.
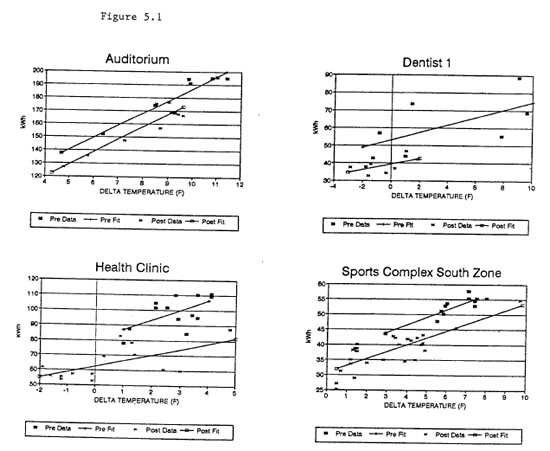
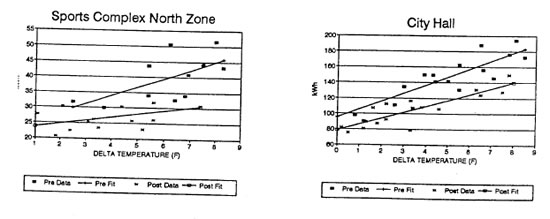
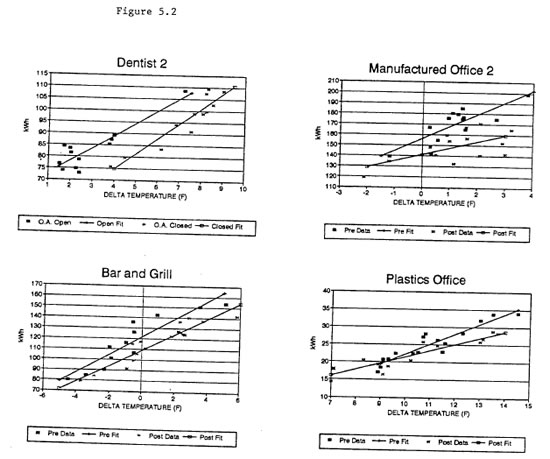
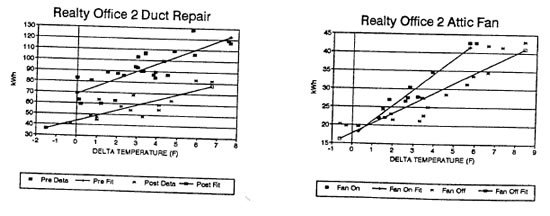
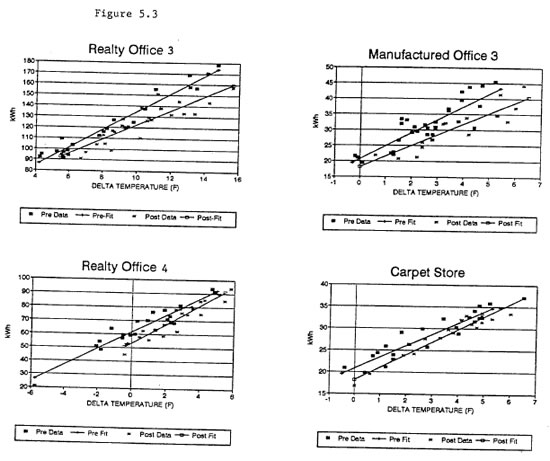
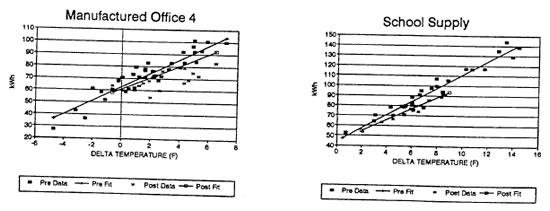
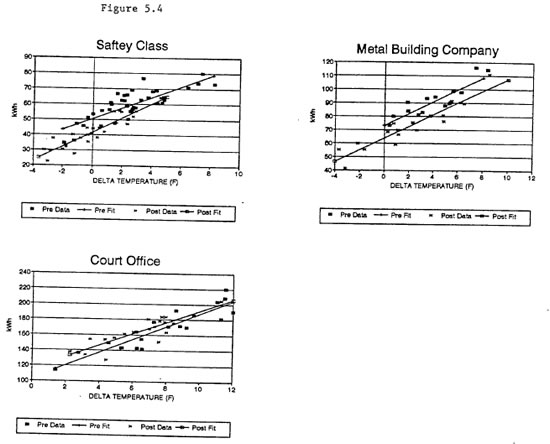
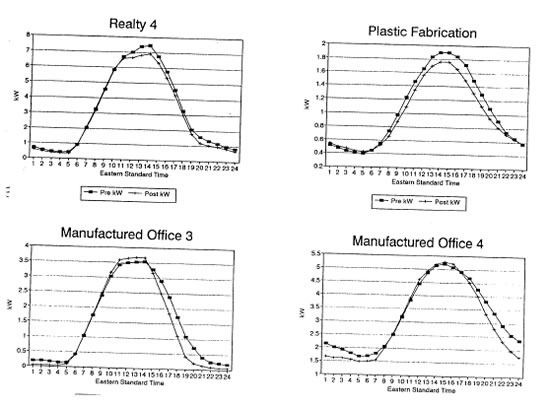
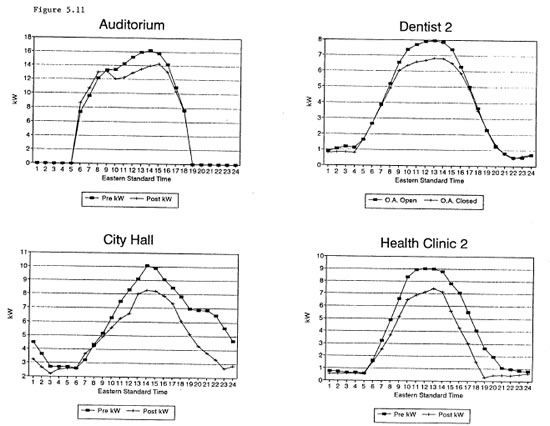
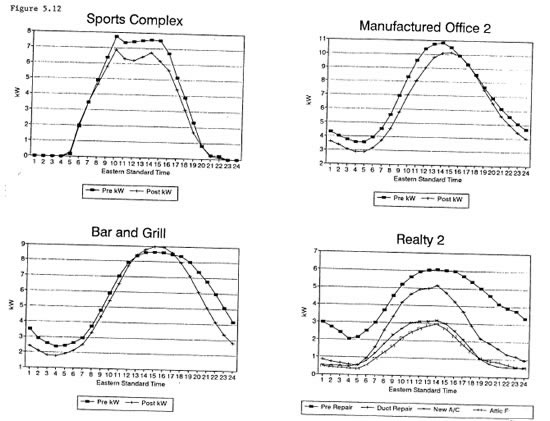
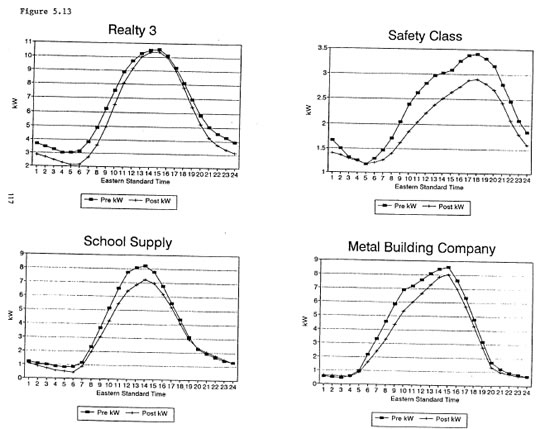
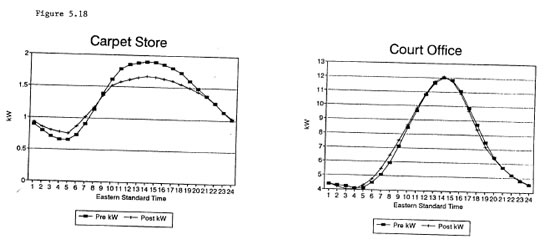
6.
Characteristics of a Good Building
Virtually
all commercial buildings have air flow control problems. In this
sample of 70 small commercial buildings, only one building was
identified as a “good building”, in which there was
essentially no uncontrolled air flow. A good building is hard
to find!
6.1 A Good Hardware Store
The one building examined in this study that had good control
of air flow was a hardware store. What made this a good building?
This two-year old, 4600 square foot hardware store had essentially
no duct leakage. It is, perhaps, no coincidence that the HVAC
contractor that installed the space conditioning system had
been through the Florida Solar Energy Center duct repair school.
All the ductwork was assembled with mastic and embedded fabric.
A building cavity, an enclosed support platform, was used as
the return ductwork, but it was carefully isolated from wall
cavities which could cause it to leak from outdoors or attic.
While duct CFM25 was a fairly large 422, virtually all of this
was leakage from the return plenum and air handlers to the
conditioned space. The lack of duct leakage is confirmed by
the fact that return leak fraction was 0.0% and infiltration
went from only 0.15 ach to 0.19 ach when the air handler was
turned on.
Pressure pan tests were done, also confirming duct tightness.
When the building was at -50 pascals (wrt outdoors),
delta-pressure across the pan was on the order of 0.3 pascals
for nearly all the registers, indicating that there was virtually
no duct leakage. (See section 3.5.2 for an explanation
of the pressure pan test.)
In fact, the only serious problem noted was that building ventilation
was too small. Even if there were no significant pollutant
sources, additional ventilation would still be needed; either 0.35 ach
or 20 cfiui per person, which ever is greater. Since containers
of pesticides, chemicals, and other products are sold in the
store and emit contaminants into the air, even higher levels
of ventilation are required.
The interior was almost completely open, except for two small
office spaces and two bathrooms. Therefore, there is almost
no pressure imbalance due to closed doors. The building shell
is quite airtight, with ACH5O of 4.3. It is tight because it
has a concrete slab floor, concrete block walls with stucco
exterior, and a gypsum board ceiling. The same construction
with a t-bar ceiling (and vented attic) might have been ACH5O
of 15 or more. Insulation in the attic space is located on
top of the gypsum board, so the primary air and thermal barriers
are in the same plane.
What are the characteristics of a good building? How can we
design and build a good building? Following is our best assessment
of how to achieve a good building.
6.2 Criteria for a good building
Uncontrolled air flow can have serious negative consequences
in buildings. These consequences can include too much or too
little ventilation, too high or too low humidity, occupant
thermal discomfort, elevated energy use, damage to building
materials, microbial growth, backdrafting of combustion equipment,
transport of pollutants, and indoor air quality problems. Therefore,
it is important to design, build, commission, and maintain
buildings so that air flows are under control. How can this
be done?
6.2.1 Tight ducts
Ducts should be airtight, especially those located outside
either the building air barrier or the building thermal barrier,
or which can draw air from outside those barriers. SMACNA (Sheet
Metal and Air Conditioning Contractors National Association)
has developed a duct leakage classification chart (Figure 6.1).
Class 6 ductwork (which can apply to sealed metal ductwork,
ductboard ducts, and flex ducts) is rated to leak at 1.2 cfm
per 100 square feet of duct surface area when depressurized
to -25 pascals (this can also be stated as 1.2 CFM25).
By contrast, the air distribution systems measured in this
project had leakage of about 80 CFM25, or 70 times more leakage
than expected by the standard. Based on work being done in
North Carolina, the SMACNA duct tightness standards can be
achieved when contractors receive training and feedback.
In general, building cavities should not be used as ducts,
unless provisions are made to ensure that these cavities are
quite airtight to outdoors or that pressure differentials between
that building cavity and outdoors is small. In general, building
cavities are quite leaky, so connecting them to the pressures
induced by the air handler blower generally produces substantial
air leakage. If special measures are taken to airtighten the
building cavity, then major leakage can be avoided.
Building cavities may also be used as ducts without significant
penalty, even if they are moderately leaky, if they operate
at approximately neutral pressure with respect to outdoors.
Consider the example of building number 6. Building airtightness
of 3.7 ACH5O and outdoor air of 870 cfm produces positive pressure
in the building of +4.2 pascals. The ceiling space of the first
floor is used as a return plenum, and it is depressurized to
-1.0 pascals with respect to the occupied space. Therefore,
the ceiling space is at +3.2 pascals with respect to outdoors.
Or consider building number 17, a special education school.
It has a similar situation where the occupied space operates
at +2.0 pascals wrt outdoors while the ceiling return plenum
operates at + 1.2 pascals wrt outdoors. Though this 16,700
square foot plenum has leakage equal to 8234 CFM25, it experiences
relatively little leakage because it is under only small pressure.
In fact, because it is at a smaller absolute pressure than
the occupied space, it leaks less than if it were not a plenum.
In general, ceiling spaces may be used as return plenums without
serious penalty if the roof deck is fairly airtight and has
a good thermal barrier, and the pressure in the plenum is designed
to be small in absolute terms with respect to outdoors.
In general, all other types of building cavities used as ducts
or plenums may create substantial problems, primarily because
these cavities often operate at significant depressurization.
When mechanical rooms or mechanical closets are used as return
plenums, that space is often seriously depressurized (on the
order of -10 pascals to -40 pascals). This can cause several
types of problems, including drawing air in from outdoors or
an attic space, drawing radon from the ground below the slab,
drawing sewer gases from drain lines, and drawing humid outdoor
air into wall cavities where moisture accumulation may occur.
Walls, chases, or shafts used as ducts can cause air to drawn
in from outdoors or from the attic space. Panned floor joists,
though not common in Florida commercial buildings, can draw
contaminated air (radon, pesticides, and high humidity air)
into the building from the crawl space.
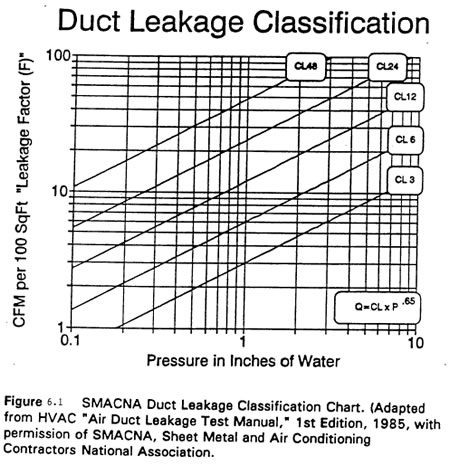
6.2.2
Tight building envelope
Building
envelopes should be reasonably airtight. As indicated previously,
many commercial buildings are very leaky, and the majority
of the leakage in most cases is in the ceiling/attic/roof
assembly. Because suspended t-bar ceilings are leaky, it
is the airtightness of the ceiling space or attic space to
outdoors that determines, to a large extent, what the overall
building airtightness will be. Since most commercial buildings
use suspended t-bar ceilings, and will probably continue
to do so, because of cost, flexibility, and accessibility
factors, the best solution is to make the roof deck the primary
air barrier. This means that the roof deck should not be
ventilated and the wall above the ceiling should not be vented,
either intentionally or unintentionally. It should be noted
that installation of insulation batts in the vertical plane
between the ceiling space and soffitted eave space does not
constitute an air barrier. Though the backing on the insulation
batts is airtight, batts are not installed in a manner that
achieves a continuous air barrier.
The combination of an attic space and suspended t-bar ceiling
creates the potential for an energy disaster, especially
when driving forces exist to move air from the hot attic
space into the occupied space. Since attics are ventilated
and the ceiling is very leaky, the ceiling/roof plane of
the building is very leaky. Even if the remainder of the
building is very airtight, this combination would produce
a very leaky building. One solution would be installation
of insulation at the roof deck and eliminating the attic
ventilation. In this way the attic space would be inside
the air and thermal barriers of the building, and would
remain cool and dry.
6.2.3 Thermal barrier at air barrier
In many commercial buildings, the thermal barrier is not
located at the primary air barrier. As a consequence, either
naturally or mechanically driven air flow may occur through
or around the insulation system. To achieve good energy
efficiency, a good building should have the air barrier
and thermal barrier located in the same plane. In most
commercial buildings, this would mean the roof deck will
be the air barrier (no venting of the ceiling space) and
the insulation will be integral to the roof construction
or attached to the bottom of the roof deck. If the air
barrier is at the roof and the thermal barrier is at the
ceiling tiles or attached to the bottom of the roof trusses
(suspended or “floating”), then the ceiling
space will be hot and dry. If the air barrier is at the
ceiling and the thermal barrier is located at the roof
deck, the ceiling will be warm and humid. Air leakage from
the ceiling/attic space to the occupied space will have
undesirable impacts.
If the ceiling space or attic space is enclosed within
both the air and thermal barriers of the building, then
this space will remain cool and dry. This has important
implications for many forms of uncontrolled air flow. Duct
leakage that occurs to and from this space will cause minimal
energy penalties. When interior doors are closed (with
central returns), air drawn into the occupied space by
depressurization of the central zone will draw air from
a cool and dry space and thus cause minimal energy penalties.
Depressurization of the occupied space by the operation
of exhaust fans will draw air from a cool and dry space
rather than a hot and humid space and thus cause minimal
energy penalties.
6.2.4
Balanced return air
Adequate return air pathways should be provided. Without adequate
return air pathways, air flow and pressure imbalances can result
and cause comfort, energy, demand, moisture, and air quality problems.
Providing adequate return air pathways can mean several things.
1) If return ducts are run to the individual rooms or zones which
can be closed off from other portions of the building, the returns
should be sized to approximately match the supply air to that space.
2) If returns are not provided to individual rooms or zones which
can be closed off from other portions of the building, then pathways
need to be provided for return air to get back to the central return
location(s). These pathways can be transfers through the wall, through
the door, or a transfer duct between two ceiling registers. 3) If
a ceiling space is used as a return plenum and fire walls subdivide
the plenum, then properly sized “cross-over windows” need
to be provided in the fire walls (with fire dampers) in order to
allow the passage of return air and avoid pressure imbalance. A
pressure differential across fire walls of 1 pascal would seem to
be a reasonable target for avoiding excessive pressures and infiltration.
6.2.5 Balancing exhaust and intake air flows
Exhaust and intake air flows should be balanced so that buildings
operate at positive (or at least neutral) pressure, especially in
hot and humid climates. An important first step in achieving air
flow balance is sizing exhaust fans so they are no larger than needed.
Another way to achieve downsizing is targeted ventilation -- spot
ventilation (locating the exhaust fans right at the source that
is to be removed from the building) or source containment ventilation
(enclosing the space where the source is located, and then exhausting
that zone). Another sizing strategy is use of multiple speed fans
that can be set to a lower setting when full exhaust is not needed.
When large exhaust fans operate in buildings, make-up air or
outdoor air should be provided, otherwise the building will operate
at negative pressure. Negative pressure can draw dust and pollutants
into buildings, draw untreated humid air into the building general,
draw humid air into building cavities (especially wall cavities)
where moisture accumulation can occur on cool surfaces, and cause
backdraffing of combustion equipment. Providing mechanically induced
intake air can alleviate these problems. Providing intake air by
means of make-up air (especially when the make-up
air is not conditioned) can dramatically reduce cooling/heating
energy consumption and greatly reduce the building ventilation rate.
Providing intake air by means of outdoor air allows
filtering and dehumidifying (or humidifying during dry conditions)
the air before it enters the building. Both methods can alleviate
the negative pressure, moisture problems, and indoor air quality
consequences. Make-up air, however, where it can be used, has the
advantage of greatly reducing building ventilation rates, downsizing
of cooling/heating equipment, and large energy savings.
An important aspect of balancing exhaust and intake air flows
is control over the exhaust fans and control over the intake fans.
Exhaust fans should be designed so they operate only when needed.
Unless the exhaust fan operation is needed all the time, it should
be controlled so it operates only when needed. Options for control
include timers that activate the fans only during portions of the
day; onloff switches under the control of the occupants; sensors that
activate the fans in response to some other equipment or activity
occurring; sensors that detect levels of humidity, carbon dioxide,
or other substance; or occupancy sensors with timed delay.
Control of intake air is also important. Make-up air fans are
usually interlocked with the exhaust fan control, so they operate
whenever the exhaust fans operate. This ensures proper exhaust/intake
balance. Outdoor air is not so reliable. In many cases, the air
handlers cycle on and off in response to building cooling/heating
loads, and thus outdoor air cycles on and off as well. In other
cases, the air handlers are variable air volume (VAV). Air handler
and outdoor air flow rates vary according to load and building
thermostat schedule. In either case, outdoor air can vary and
therefore building pressure and air flow balance can vary.
If outdoor air is to be used to balance exhaust air flow, consider
the following. It is generally not a good idea to operate the
air handler blower continuously, for several reasons. First, it
uses considerable fan power. Second, duct air leakage and conduction
heat gains (losses) can add considerably to cooling/heating loads
and draw considerable humidity into the building (humid climates).
Third, continuous fan operation causes re-evaporation of moisture
from the cooling coil and drain pan, causing considerable reduction
in cooling system dehumidification performance. This last point
can be very important, since high humidity can lead to severe
building and air quality problems.
We suggest that the best solution for using outdoor air to
balance exhaust air flow is to remove the “V” from
HVAC. That is, provide ventilation through a separate system that
is not used for normal heating and cooling of the space. A dedicated
space conditioning unit can be used to provide continuous outdoor
air. It would cool/dehumidify or heat the incoming air, but would
operate in response to operation of the exhaust fans.
If this approach is not used, a two-stage cooling system can
be used. This could involve designating one of the cooling systems
to be the first stage unit. It would have a large outdoor air
fraction (perhaps 35% or more) and would operate at
a lower temperature setting (cooling mode) than the other units,
so it would be operating virtually all the time. The other cooling
units would not have outdoor air and would cycle on depending
upon the need for additional cooling. This can also be achieved
by use of two-stage air conditioning systems, where the air handler
operates whether one or two compressors are running.
Be aware of the interacting relationships between attic exhaust
fans and building ventilation rates, energy consumption, comfort,
humidity, and pressure. As was noted in Realty 2 (building #3
7), an attic exhaust fan can depressurize not only the attic but
the entire building, especially in cases where the ceiling is
suspended t-bar. This space depressurization can lead to excessive
ventilation rates, high relative humidity (humid summer weather),
low relative humidity (winter weather), moisture problems in building
cavities, increased space conditioning energy use, and combustion
safety problems.
6.2.6 Effective test and balance
The probability of obtaining a good building is increased if
commissioning is implemented. Test and Balance (TAB) is a form
of commissioning of the HVAC systems. There are problems
with standard TAB practice, as discussed in section 4.12, including
errors in air flow measurement, not taking duct leakage into account
when determining the building air flow balance, and not assessing
and correcting some return air flow imbalance problems (especially
those related to centralized returns and firewalls in ceiling
plenums). Good TAB practice should be aware of the limitations
of air flow measurements, evaluate and correct return air problems,
and check building and zone pressure relationships with digital
micromanometers (preferably with time averaging capabilities).
6.2.7 Maintenance requirements
A good building will only remain a good building
if operated and maintained properly. Note that this is a big
issue in most building -- filters, coils, condensate drain
lines, etc. in a large majority of commercial buildings are
not well maintained. Dirty filters can reduce system efficiencies,
reduce air flow rates, create building air flow imbalance,
and increase duct leakage. Improperly sized filters can cause
dirt by-pass. Dirty coils can reduce system air flow rates,
efficiency, and capacity. Poorly designed, damaged, or missing
condensate traps can lead to re-entrainment of moisture back
into the conditioned space. This can lead to high relative
humidity, dampness in duct systems, and microbial growth that
can cause indoor air quality complaints.
To achieve good operation and maintenance practice, operations
and maintenance documents and training should be provided to
facilities maintenance personnel.
To assist facilities managers and HVAC contractors in assessing
the performance of HVAC systems, various types of low-cost monitoring
equipment could be installed in new buildings to enhance both
maintenance and trouble-shooting. These can include temperature
probes in return and supply ducts, zone humidity sensors, carbon
dioxide sensors (to indicate relative ventilation rates), and
zone pressures.
6.2.8 Balanced air flow in modified buildings
If buildings are modified, air flow imbalance may result.
These modifications can include change-out of HVAC equipment
which can lead to changes in air flow rates, outdoor air damper
settings, and air flow resistance of filtration. Building modifications,
such as erecting or moving interior walls, can cause restrictions
to return air flow, returns being in the wrong zone, pressure
imbalance, and thermostats being located outside of that cooling
zone. There are an almost infinite number of ways that a building
or HVAC system can be modified, and in many cases the modifications
create uncontrolled air flow. In some cases, some provision
needs to be made for commissioning modifications. Just as a
new building needs commissioning, modifications to buildings
need a process for assuring that air flows are under control.
Therefore, building modification plans need a TAB specification,
and facilities managers need to be trained to oversee the TAB
process and be familiar with any air flow changes that result.
7. Recommendations
for Implementation of Project Findings
A contract deliverable is to “work closely with
the advisory group in developing a marketing and implementation
plan.” (project contract) Section 7 of this report, then,
is the resulting implementation plan. This plan is based on the
experience of the research team and advice from the advisory
committee.
Where do we go from here? What should be done with the information
gained in this project? We suggest three pathways: 1) development
of technology transfer materials, 2) additional research, and 3)
development of standards related to uncontrolled air flow.
7.1 Technology Transfer
With regard to technology transfer, much has been learned in
this project, and therefore there is much that needs to be communicated
to those involved in designing, building, commissioning, operating,
maintaining, diagnosing, and repairing commercial buildings.
We propose, therefore, that a training and technology infrastructure
be developed. This effort would include the following:
7.1.1 Develop protocols and additional testing methods
In this project, protocols were developed to identify and quantify
uncontrolled air flows, building and distribution system airtightness,
and pressure differentials. Also incorporated and developed were
testing methods which can accurately and comprehensively characterize
air flows, airtightness, and pressure differentials. These test
protocols and test methods have been employed in a research manner
to gain a comprehensive picture of what is going on in buildings.
It is necessary now to identify protocols and test methods that
work from a field diagnostics point of view. The basic issue is,
how can we accurately and quickly come to an understanding of what
is going on and specifically what is going wrong in this building,
so that a diagnosis of what is wrong and what to do can be made?
A diagnostic protocol will almost certainly be less extensive than
the research protocols that were used in this project.
7.1.2 Develop materials that can be used in
training
Training manuals for improved design and construction of new
buildings should be produced. Training manuals for diagnosis and
repair of uncontrolled air flow in existing buildings should be
produced. Visual presentation materials, such as diagrams, slides,
and overhead transparencies, should be developed. Over 800 slides
and several hours of hi-8 video were taken during the project and
they can be developed into standard presentation packages. Additionally,
the airtightness, air flow, and pressure differential interactions
which occur in commercial buildings can be very effectively demonstrated
using table-top and even larger scale models. A number of different
models should be developed illustrating various building construction
configurations and the air barrier and thermal barrier permutations
which can exist in real buildings. These models make excellent classroom
demonstration tools and can also be used effectively in air flow
and pressure diagnostic labs.
References/Bibliography
American
Society for Testing and Materials (ASTM). 1987. Standard test
method for determining air leakage rate by fan pressurization. ASTMStandardE779-87.
American Society for Testing and Materials (ASTM). 1983. Standard
test method for determining air leakage rate by tracer dilution. ASTM
Standard E741-83.
Cromer, C.J., and J.B. Cummings. 1987. Field data delivery, thermal
performance field monitoring of various conservation construction
techniques. FSEC-CR-1 72-8 7. Florida Solar Energy Center,
Cape Canaveral, FL.
Cummings, J.B. 1988. Central air conditioner impact upon infiltration
rates in Florida homes. Proceedings of American Solar Energy
Society 13,h National Passive Solar Conference. Cambridge,
MA.
Cummings, J.B., and J.J.Tooley. 1989. Infiltration and pressure
differences induced by forced air systems in Florida residences. ASHRAE
Transactions Vol.95, Part 2.
Cummings, J.B., and J.J.Tooley, J.J. June, 1989. Infiltration
rates and pressure differences in Florida homes caused by closed
interior doors when the central air handler is on. Proceedings
of American Solar Energy Society j4th National Passive
Solar Conference. Denver, CO.
Cummings, J.B., J.J. Tooley, N.A. Moyer, and R. Dunsmore. 1990.
Impacts of duct leakage on infiltration rates, space conditioning
energy use, and peak electrical demand in Florida homes. Proceedings
of the ACEEE 1990 Summer Study. Pacific Grove, CA.
Cummings, J.B., J.J.Tooley, and N. Moyer. 1990. Recommended Florida
radon building code -- HVAC section. FSEC-CR-332-90. Florida
Solar Energy Center, Cape Canaveral, FL.
Cummings, J.B., J.J. Tooley, and N. Moyer. 1991. Investigation
of Air Distribution System Leakage and Its Impact in Central Florida
homes. FSEC-CR-397-91. Florida Solar Energy Center, Cape
Canaveral, FL.
Cummings, J.B., J.J. Tooley, N.A. Moyer. 1993. Duct doctoring;
diagnosis and repair of duct system leaks. Florida Solar Energy
Center, Cape Canaveral, FL.
Cummings, J.B., C.R. Withers, N. Moyer, P. Fairey, and B. McKendry.
1995. Field measurement of uncontrolled air flow and depressurization
in restaurants. To be published in ASHRAE Transactions.
Davis, Bruce E. 1991. The impact of air distribution system leakage
on heating energy consumption in Arkansas homes. Report submitted
to the Arkansas Energy Office.
Gammage, R.B., A.R. Hawthorne, and D.A. White. 1984. Parameters
affecting air infiltration and airtightness in thirty-one east Tennessee
homes. Measured Air Leakage of Buildings. Philadelphia: ASTM.
Grieve,
P.W. 1991. Measuring ventilation using tracer-gases. Bruel & Kjaer,
BR 0608-12.
Kao, J.Y., D.B. Ward, and G.E. Kelly. 1988. Flame roll-out Study
for gas fired water heaters. NBSIR 88-3724. National Bureau
of Standards, Gaithersburg, MD.
Khattar, M.K., M.V. Swami, and N. Ramanan. 1987. Another aspect
of duty cycling: effects on indoor humidity. FSEC-PF-118-87. Florida
Solar Energy Center, Cape Canaveral, FL.
Lambert, L.A. and D.H. Robison. 1989. Effects of ducted forced-air
heating systems on residential air leakage and heating energy use. ASHRAE
Transactions Vol. 95, Pt. 2.
Lstiburek, J.W., and John Carmody. 1991. Moisture Control Handbook, ORNL/Sub/89-
SD350/1, Oak Ridge National Laboratory, Oak Ridge, TN.
Modera, M.P. 1990. Residential duct system leakage; magnitude,
impacts, and potential for reduction. ASHRAE Transactions. Vol.95, Part
2.
Modera, M.P., Darryl Dickerhoff, Richard Jansky, and Brian Smith,
1992. Improving the efficiency of residential air-distribution systems
in California, Phase I. Research Report Series 5, California
Institute for Energy Efficiency.
Moffatt, Sebastian. 1988. Backdrafting woes. Progressive Builder.
Offerman, F.J., J.B. Dickinson, W.J. Fisk, D.T. Grimsrud, C.D.
Hollowell, D.L. Krinkel, G.D. Roseme, R.M. Desmond, J.A. DeFrees,
and M.C. Lints. 1982. Residential air-leakage and indoor air quality
in Rochester, NY. LBL-13100. Lawrence Berkeley Laboratory,
Berkeley, CA.
Orlando, J.A., M.G. Gamze, N. Malik, R. Crews, G. Michaels, and
J. Christie. 1980. Analysis of residential duct losses. PB8O-228000. Gas
Research Institute, Chicago, TL.
Palmiter, L., and T. Bond, 1990. Modeled and measured infiltration;
A detailed case study of four electrically heated homes. Prepared
for Electric Power Research Institute Under Contract RP 2034-40.
Parker, Danny. 1991. Monitored energy use characteristics of
a Florida residence. FSEC-RR23-91. Florida Solar Energy
Center, Cape Canaveral, FL.
Parker, D.S. 1989. Evidence of increased levels of space heat
consumption and air leakage associated with forced air heating systems
in houses in the Pacific Northwest. ASHRAE Transactions. Vol. 95, Pt.2.
Parker, Danny, Philip Fairey, and Lixing Gu. 1993. Simulation
of the effects of duct leakage and heat transfer on residential
space cooling energy use. Energy and Buildings.
Proctor, J., B. Davids, F. Jablonski, and G. Peterson. 1990.
Pacific Gas and Electric Heat Pump Efficiency and Super Weatherization
Pilot Project. Building Resources Management Company.
Proctor,
J., 1990. PG&E Appliance Doctor Pilot Project. Proctor Engineering
Group, San Francisco, CA.
Robison, D.H. and L.A. Lambert. 1989. Field investigation of
residential infiltration and heating duct leakage. ASHRAE Transactions. Vol. 95, Pt.
2.
Sheet Metal and Air Conditioning Contractors National Association,
Inc (SMACNA)., 1985. HVAC Air Duct Leakage Test Manual, 1st Edition.
Tooley, J.J., and N. Moyer. 1989. Mechanical air distribution
and interacting relationships. Presented at Symposium on Improving
Building Systems in Hot and Humid Climates. Dallas, TX.
Tooley, J.J., J.B. Cummings, and N.A. Moyer. 1991. Pressure differential,
the measurement of a new decade. Presented at the 9th Annual International
Energy Efficient Building Conference and Exposition, Indianapolis,
iN.
Trent, W. and C. Trent. 1994. Indoor air quality and the condensate
trap. Presented at the Ninth Symposium on Improving Building Systems
in Hot and Humid Climates. Arlington, TX.
© 2007-2014 University of Central Florida. The Florida Solar Energy Center (FSEC)
is a research institute of the
University of Central Florida.
For more information about FSEC, please contact us or learn more about us.
Find us on Facebook!