

Reference Publication: Charles R. Withers, Jr. and James B. Cummings. "Unbalanced Return Air in Commercial Buildings". ASHRAE Transactions Vol 112, Part 1, January 2006. Disclaimer: The views and opinions expressed in this article are solely those of the authors and are not intended to represent the views and opinions of the Florida Solar Energy Center. |
Unbalanced Return Air in Commercial Buildings
Charles
R. Withers, Jr. and James B. Cummings
Florida
Solar Energy Center (FSEC)
FSEC-RR-139-06
AbstractResearch in 88 central Florida commercial buildings during the last decade has found that 26% of the air distribution systems had substantially unbalanced return air. Unbalanced return air occurs when there is a restriction to air flow between the supply discharge and the return air, creating positive and negative pressure fields throughout the building. Severe consequences in commercial buildings can occur as a result of unbalanced air flows. This paper examines unbalanced return air and its consequences in three commercial buildings, and explains why balancing air flow in buildings is a critical part of maintaining a healthy and energy efficient building.
IntroductionDuring the last decade, significant airflow problems in commercial buildings have been identified and reported. In 1993, a research project funded by the Florida Energy Office was begun in order to characterize duct leakage and other types of uncontrolled air flow in 70 commercial buildings (Cummings et al. 1996). It was found that there were four primary causes of uncontrolled air in commercial buildings: duct leakage, unbalanced exhaust air, unbalanced return air, and leaky building air envelopes. In 1998 a follow up study was conducted to further investigate uncontrolled air problems in 20 more commercial buildings and found the same types of problems as the previous study (Cummings et al. 2000). This paper reports the causes and impacts observed from unbalanced return air in three different commercial building constructions with two generally classified as light-commercial and the other as large commercial.
Significant unbalanced return air problems were identified in 26% of 88 commercial buildings studied during the last decade in central Florida. Only one of these buildings would be considered large commercial. There are two primary types of unbalanced return air. In one case, an air flow imbalance occurs when interior doors are closed when the return(s) are located only in a central zone. In the other case, fire walls can restrict return air when a ceiling space is used as a return plenum.
In the first case, return air can be restricted when an air distribution system has a centrally located return with supply air dropped into rooms with doors as shown in Figure 1. The closed room becomes pressurized and the central zone, where the return is located, becomes depressurized. The positive pressure pushes air out of the building, some through door, window, and wall assemblies, but the greater amount will move directly through the tile ceiling into the ceiling space. Likewise, in the central zone, negative pressure will pull some air into the building through doors, windows, and wall assemblies, but most will enter through the suspended T-bar ceiling.
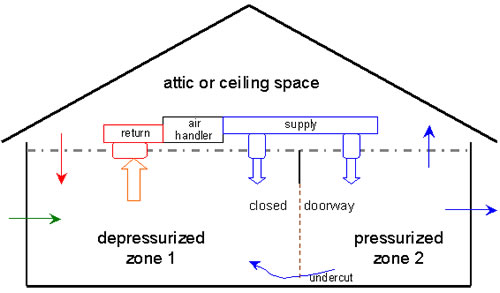
Figure 1: Air Flow and Pressure Impacts from Closed Doors
With Central Return
Controlling moisture and energy use can be much more difficult if this ceiling space is leaky to outdoors.
In the case of fire walls subdividing a ceiling space used as a return plenum, return air may be restricted when transfers are undersized (as shown in Figure 2). When the door to zone 2 is closed, air from that zone travels into the ceiling space, then through a transfer opening in the fire wall. If the fire wall transfer is too small, all of zone 2, including the ceiling space of zone 2, will be under positive pressure, while the occupied space and ceiling space associated with Zone 1 will be depressurized. The positive pressure in zone 2 will cause exfiltration to outdoors and the negative pressure in zone 1 will cause infiltration from outdoors.
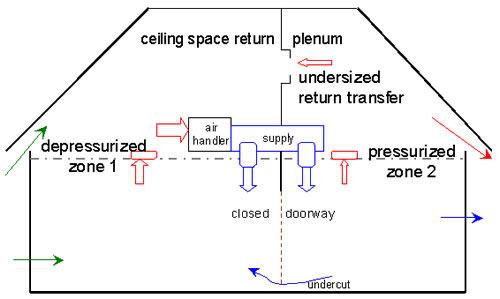
Figure 2: Ceiling Space Return Plenum With Undersized Return
Transfer
Limited research has found typical suspended tile ceilings to have a leakiness of 5 CFM50 per square foot, which is about 10 times more leakage than residential gypsum board ceilings (Withers and Cummings 2000). While the amount of tightness will vary by type and condition of tiles, it should be clear that this type of ceiling is very leaky. Even with small pressure differentials across the ceiling, large airflows can move across this plane. Unbalanced return air in combination with suspended T-bar ceilings yields the potential to readily move air to and from the ceiling space. Therefore, the nature of the air in the ceiling space has consequences on the air quality and air conditioning energy load.
Temperature and humidity conditions in the ceiling space are affected by the location of air and thermal barriers. Figure 3 shows eight types of ceiling spaces identified in Florida buildings that may help explain why some buildings experience greater impacts from unbalanced air than others. The letter “A” represents the primary air barrier location and “T” represents the primary thermal barrier location. Note that a primary barrier (either air or thermal) does not mean this barrier performs well, only that it performs more effectively than the other components of the building assembly. For example, a building with a Type 3 ceiling space has a roof deck and ceiling space walls that resist air flow better than the ceiling, but it does not guarantee this space is very tight. While this type of space would be hot during the summer, it may also be humid if there are significant pathways to outside such as leaky roof curb penetrations and roof deck to wall connections.
Ceiling space type 1 has no ceiling and the roof deck can be seen from the floor. This type is common in large retail and some restaurants and theatres. Ceiling space types 2-7 have suspended acoustical tile ceilings. Type 2 is similar to type 1, except for the lay-in ceiling. Since suspended tile ceilings are leaky, the ceiling space is not vented, and the insulation is at the roof, the primary air and thermal barriers are located at the roof. During summer weather, this ceiling space is warm and dry. Type 3 is similar to type 2 except that insulation is at the ceiling (typically batt insulation on top of the ceiling tiles). During summer weather, this ceiling space is hot and dry. Type 4 is an intentionally vented type 3. Because the vents make the ceiling space leakier to outside, the ceiling is typically the primary air boundary because it resists airflow better than the ceiling space envelope. During summer weather, this ceiling space is hot and humid. Type 5 ceiling space is an unusual configuration, with vented ceiling space and insulation at the roof deck. During summer weather, this ceiling space is warm to hot and humid. Types 6 and 7 would be found in buildings with wood roof truss construction when batt insulation is stapled to the bottom of the trusses some distance above the ceiling. During summer weather, these ceiling space configurations will be hot and dry and hot and humid, respectively, though temperatures will be substantially higher above the insulation level. Type 8 has gypsum board ceiling construction (or other comparable tight construction). This is similar to single-family residential units and results in a much tighter conditioned space.
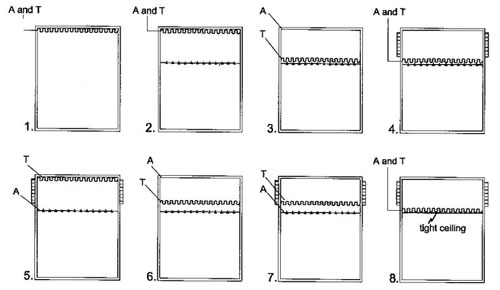
Figure 3: Eight Ceiling Spaces Based on Air and Thermal
Barrier Location
Types 1 and 2 would be the best construction (most forgiving) if unbalanced return air or duct leakage exists. This is because air transferred across the ceiling plane will be more similar to conditioned space than outdoors. Type 4 would be the worst type since the air transferred across the ceiling will be hot and humid during hot and humid summer weather and cold and dry during winter weather. The most common ceiling space in Florida is type 4, with 29% of 70 commercial buildings studied having this type, while only 37% had the more benign ceiling spaces of type 1 and type 2 (Cummings et al. 1996).
Three case studies follow to demonstrate impacts from unbalanced return air. The first example is a non-profit light commercial retail store/office that was monitored in detail before and after repairing an unbalanced return air problem. The second example is a much larger multi-story building that shows how return plenum restrictions caused by firewalls can cause elevated radon concentrations. The third study is a manufactured office/classroom building that shows how a type 2 ceiling space configuration might save you from the worst uncontrolled air problems.
Lock the Door and Heat the Store: Impacts at a Charity Thrift Shop
A non-profit business was identified as having thermal comfort complaints. It was a light-mass building with metal skin walls with R-11 insulation on three sides and concrete block with stucco construction on the west wall. The roof deck was metal with R-3 insulation batts against the roof decking with a suspended acoustical tile ceiling and R-19 insulation batts on the ceiling tiles. Since there is no intentional venting, this would be a type 3 ceiling space (Figure 3). Cooling is provided by split DX systems. One 5-ton and one 2.5-ton unit serve this 4000 ft 2 (371.6 m 2) facility which houses office space, a thrift shop retail floor, and an inventory storage and preparation space. The supply ductwork was located in the ceiling space above the insulation and below the metal roof deck. The space cooling equipment was set at 76ºF (24º C) in auto fan mode and turned off about 5:30 pm until 7:30 am.
Building energy issues were evaluated using visual inspections, infrared camera, building and air duct tightness testing, system air flow measurements and air conditioner performance testing. Several comfort and energy conservation factors were identified: Install awnings over west facing store-front glass, have both AC units serviced including cleaning very dirty evaporator coils, balance return air, paint metal roof and walls with reflective white paint and seal leaky duct work. Only impacts from the balanced return air will be discussed here.
One difficulty in quantifying the impacts of unbalanced return air was related to the building having a greater cooling load than cooling capacity. The thermal inefficiency of the building and relatively low cooling capacity resulted in 100% run time of both units with an interior rise in temperature throughout the day to about 86º F (30º C) on hot summer days. Another challenge was making effective low first-cost improvements.
Prior to balancing the return air, the building was painted with a reflective white paint (previously a cream color) and the AC units were serviced. This was not enough to reduce the cooling load to permit the unit to maintain a 76ºF (24º C) set-point. A thermostat program was used to allow the building to pre-cool starting 3 AM and run until 6 PM when both units would be turned off overnight. Thermostats were set to cool auto fan at 76º F (24º C). This improved comfort, but space conditions would begin to climb past set-point by 2 PM to about 81ºF by 5:00 pm.
A datalogger was installed on site to monitor cooling energy use and interior door closure status. Temperature and relative humidity were also measured at 5 indoor locations, outdoors, and in the ceiling space. Conditions were sampled every 10 seconds then averaged into 15 minute data and stored. Daily data collection occurred automatically through a central computer system that called the datalogger through phone and modem, downloaded data, and screened it for “out of range” errors. Automatically generated plots were reviewed daily. Monitoring before the return balance retrofit occurred from August 13 to October 12, when the retrofit was made and then for several more weeks after the retrofit.
Retrofit Description
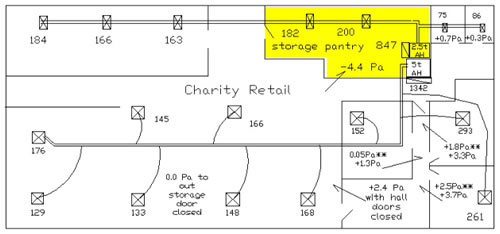
Figure 4:
Floorplan With Grille Flows (cfm) and Room Pressure (Pa) Across
Closed Doors
** pressure in room wrt hall with hall door closed.
Return air for the 2.5-ton system was located entirely in the storage pantry room shown as a shaded area at the top of Figure 4. Measured airflow through the grille was 847 cfm (399.7 l/s) with approximately 50 cfm (23.6 l/s) in return leakage from the room into the air handler. This room has two doors that are often closed for security reasons. When closed, they cause room depressurization of –4.4 pascals (-0.0177 in w.g.). Observation of the air flow balance in this room illustrates the uncontrolled return air problem. Two supply grilles deliver a combined 382 cfm (180.3 l/s) into the room. (However, supply air measurements on these supply registers overestimate flow – see discussion in following paragraph.) We estimate supply air to be 306 cfm (144.4 l/s). A transfer grille in one door and minor door undercuts allow about 250 cfm (118.0 l/s) to pass into the room. The remaining air flow into the room, of about 341 cfm (160.9 l/s) (38%), is drawn from the hot ceiling space through the ceiling. Simultaneously, room air from the main zone of the building is pushed into the ceiling space.
It may be noticed that the total for all supply air (2.5-ton) is 1056 cfm (498.4 l/s), substantially higher than the total return air flow of about 897 cfm (423.3 l/s). This is not due to unaccounted return leakage. All of the supply grilles on the 2.5-ton system were rectangular with air throw to one direction. The authors have found that flow from this type of register causes the flowhood to overestimate supply readings 15%-30%. Return readings and supply registers with 4-way throw do not have this problem.
Return air for the 5-ton system is located entirely in the central hallway. An office suite, containing three offices and a central foyer can be closed off from the retail area shown on the right side of Figure 4. Since there is no return air to this suite, it operates at positive pressure when the suite door is closed. Individual offices within the suite operate at positive pressure even if the suite door is open. This positive pressure pushes air through the ceiling, and air is then drawn from the ceiling space into the central hallway area in order to return to the return grille.
The office suite is only closed about 10% of the time during business hours. It was determined that the office suite doors were not closed a sufficient fraction of the time to make the retrofit worthwhile. Although it was closed during 3 AM to 8 AM when the air conditioners are scheduled to turn on, the ceiling space would be at its coolest, resulting in relatively small energy impacts from door closure during this time.
Balancing the return air for the 2.5 ton system was completed October 21, 1998. Retrofit on the 2.5 ton system involved two efforts. First a second return grille, 18 in x 18 in (0.46 m x 0.46 m), was installed in the central hallway. Second the return for the 2.5 ton system located in the storage room was constricted by means of a restrictor plate inserted behind the filter at the grille so that the return air exactly matched the supply air in that room (this created neutral room pressure with respect to the hallway and ceiling space).
Cooling energy use was monitored for a period of 6 months, however only 22 days of pre-repair data were available and much of the post repair data was not used over winter months due to minimal cooling required. Cooling energy use as a function of the temperature difference between outdoors and indoors was used to develop a linear regression. The linear regression was used to predict cooling energy savings. Developing the linear regression involved three steps. First, monitoring data was screened so that only comparable days were used. Comparability was based on similar outdoor dry bulb temperature, outdoor dew point temperature, solar radiation, wind, rain, door closure, and thermostat settings. Second, 24-hour total cooling kWh electricity consumption was plotted against the 24-hour average temperature difference between outside and inside. Plotting against the temperature difference helped to account for changes indoors such as t-stat setting changes (business and non-business hours settings). Third, a least-squares best-fit linear regression was performed on each series of data. The best-fit line provided the equation used to predict the cooling energy when the temperature difference was known. These results are shown in Figure 5.
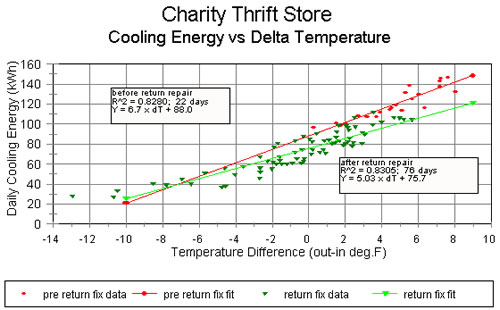
Figure 5: Total Cooling Energy Per Day vs Daily Average
dT (out-in)
Energy savings for a particular type of day can be calculated directly from the best-fit lines of the regressions. If a day with an outside temperature that represents the average temperature over 8 months is chosen along with an average indoor temperature, then a simple estimate for the average daily savings over 8 months can be obtained. This type of analysis assumes all days over an 8 month period are exactly the same.
A better way to represent typical weather conditions over a period of time is to use typical meteorological year data. TMY2 outdoor data was used to predict savings for a typical cooling season accounting for more realistic variations in daily conditions. The temperature difference between indoors and outdoors was derived using the outdoor 24 hour average from TMY2 and the average 24 hour interior temperature based on pre and post monitoring data. These two variables were used to derive the temperature difference for each day of the year. Then the temperature difference is used with the linear regression models to calculate cooling energy used for each day. The difference between the pre and post retrofit cooling energy is calculated for each day, then summed over eight months. While cooling does occur more than 8 months per year, it was found that there is miniscule savings for this building during November through February.
Analysis of the AC energy consumption data predicts cooling energy savings of 1773 kWh (11.3%) as a result of this retrofit for a typical 8 month cooling season.
In addition to cooling energy savings, a reduction in indoor temperature attributed to undersized cooling capacity was observed. Table 1 compares the environment in certain zones before and after the return retrofit. Days with similar summer-like meteorological conditions were chosen for comparison. Another important consideration was similar use and activity in the store. The amount of time and the time of day that interior doors were closed was also considered. It is noted here that the periods chosen for comparison have outdoor dew point temperatures in the mid 60’s, which is substantially lower than the typical mid 70’s during most summer months. While other days with higher outdoor dew point temperature are available for comparison, they were not used since the door closure time, outside temperature, solar, and relative humidity were not as comparable.
TABLE 1
Average Conditions Outside and Inside
Before and After Balance Retrofit 7:30am-5:30pm
| Outside
conditions |
Inside
conditions |
|||||||
| Out T ºF |
Out RH % |
Solar Whr/m 2 |
In T ºF |
In RH % |
Ceiling space T ºF |
Ceiling space RH % |
% time door closed |
|
| Pre retrofit |
90.3º |
39.4 |
5270 |
77.6º |
46.9 |
85.2 |
50.8 |
43.6 |
| Post retrofit |
90.3º |
41.9 |
5885 |
75.8º |
54.1 |
88.7 |
48.9 |
43.4 |
Monitoring found the storage room is closed 60% over a long-term
average, however, it is only closed about 43% during the business
hours of 7:30 am to 5:30 pm. Typically one door is left open several
hours in the morning when supplies are stored or removed, then closed
and locked later in the day.
The air conditioners were allowed to run from 3:00 AM to 6:00 PM, and then turned off from 6 PM to 3 AM. Typically from 3 AM to 5 AM, the air conditioners would run 100%. Then the units would cycle on and off from about 5:00 AM - 11:00 AM after which both would be running 100% again as the cooling load exceeded the delivered cooling. It can be seen in Table 1 that the indoor temperature declined by 1.8º F as a result of the retrofit to the 2.5 ton system. Notice that this drop occurred while the ceiling space temperature was 3.5º F warmer than the pre retrofit period. The warmer ceiling is most likely due to more solar radiation during the post-retrofit period. However, balancing return air eliminates conditioned air delivery to the ceiling space air from pressurized zones. About half of the indoor relative humidity increase occurs due to a drop in interior temperature and the other half from an increase in the humidity ratio during post repair period.
Peak period conditions from 3:00 pm to 5:00 pm are shown in Table 2. Although the post repair ceiling space temperature is 5.0º F higher due to more solar energy, the peak indoor temperature still declined 2.4º F. It is interesting to see the doors are closed all the time during the period from 3pm-5pm when ceiling space conditions are the hottest. The storage doors were usually closed during the period from about 1 PM - 8 AM the next day. This period shows a greater increase in relative humidity mostly due to the decrease in temperature, although a modest increase in humidity ratio accounts for a minority of the increase. It should be noted that the exact same days were not used in Table 1 and Table 2, therefore humidity ratios are slightly different. Had the humidity ratio remained constant at about 0.0102, then Table 1 pre indoor humidity would be about 51.1% and 54.3% for post humidity. Table 2 indoor humidity would be about 47.1% before repair and 51.0% after repair.
TABLE 2
Average Peak Conditions Before and After Return Retrofit 3:00pm-5:00pm
| Outside Conditions |
Inside Conditions |
|||||||
| Out T ºF |
Out RH % |
Solar Whr/m 2 |
In T ºF |
In RH % |
Ceiling space T ºF |
Ceiling space RH % |
% time door closed |
|
| Pre retrofit |
92.4º |
36.3 |
1022 |
80.1º |
47.1 |
88.9 |
39.4 |
100 |
| Post retrofit |
93.7º |
35.6 |
1171 |
77.7º |
52.5 |
93.8 |
35.2 |
100 |
Cost and Simple Payback
Measured cooling energy savings results in a total calculated savings of 1773 kWh (11.3%) or $142 over a typical 8 month cooling season. Given a total retrofit cost of $200, this retrofit has a simple payback of about 1.4 years. Greater savings would be expected if doors are closed for a longer period of time or the air conditioners were allowed to run 24 hours per day.
No peak electric cooling energy savings can be derived since the air conditioners were not sized large enough to handle the cooling load of the building. The observed drop in indoor air conditions after retrofit indicate that conditions were made much more comfortable and that there would certainly be measurable peak load reduction had there been more cooling capacity.
Block the Flow and Start to Glow: Administration Building
This study involves a 149,000 ft 2 (13,842 m 2) building spread over five stories. The first four floors have separate zones with a common central atrium. The fifth floor was isolated from the lower floors. The building has a type 2 ceiling space (Figure 3) that was used as a return plenum. Fortunately this type of ceiling minimizes any energy-associated penalties from uncontrolled air flows. The building was very air tight as determined by door fan pressurization testing. CFM50 was found to be 42,034 (19.8 m 3/s). This can also be expressed as 1.17 ACH50, indicating that this is a very tight building. The average of 69 other small commercial buildings in Florida was 16.7 ACH50 (Cummings et al. 1996).
The structure was built in 1988 on land with elevated radium ( 226Ra) concentrations. Radium decays into radon a colorless, odorless, radioactive gas. Radon measurements found indoor air concentrations on the first floor typically between 6 and 16 pico Curies per litre (pCi/l) (Williamson et al. 1994). This is above the EPA action guideline of 4 pCi/l and methods of remediation were sought. While the upper floors were investigated, this study focused on the first floor since radon enters through first floor slab on grade. It was expected that controlling radon concentrations could be addressed by first floor ventilation, airflow and pressure differentials.
Controlling pressure is a key to controlling radon in existing structures. Radon is a soil gas that will move from under the slab into the conditioned space through any unsealed slab penetrations such as plumbing and electrical. Creating a condition where the air pressure below the floor slab on grade is less than above the slab is enough to reverse the airflow and diminish radon intrusion in almost all cases (Tyson and Withers 1995).
A project to monitor radon was conducted by a team of researchers in 1994. A series of tests and short-term monitoring was performed to assess building and zone airtightness, airflows, and pressures. Long term monitoring of ventilation, zone pressure, and radon concentrations began in late spring 1994 and continued for several weeks through the summer. Williamson et al. 1994 reported lower radon concentrations at higher floors.
TABLE 3
Average Radon Concentrations on Five Floors
| 1st floor |
2nd floor |
3rd floor |
4th floor |
5th floor |
|
| Radon (pCi/l) |
8.1 |
4.2 |
4.3 |
2.5 |
2.5 |
It is not surprising to find radon in the upper floors since there is a central atrium open to the first 4 floors and elevator shafts open to all five floors.
Figure 6 shows typical pressure (with respect to outdoors) and radon levels in one of six first-floor zones during a 24-hour period on a weekday. Note that the pressure in this zone is about 2 Pa (0.0080 in w.g.) more negative during the period from 6 AM to 6 PM, and radon concentrations are always above EPA standards. It is the consistent negative pressure that transports radon gas entry into boardroom. The decrease in concentration as depressurization increases can be explained as a relation of radon entry rate and ventilation dilution rate. Greater cooling load from 6am-6pm results in more ventilation air delivered to indoors. Although greater negative pressure would increase the radon entry rate, increased ventilation delivers a higher fraction of outside ventilation air (presumably without significant level of radon) and causes dilution of radon.
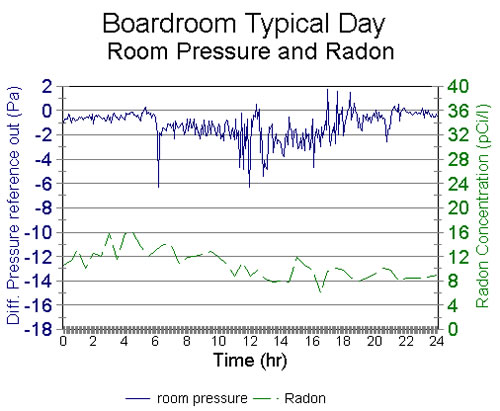
Figure 6: Boardroom Zone Pressure and Radon Levels
Repeatable patterns in zone pressures due to typical patterns in VAV system operation were observed in all six first-floor zones.
It was found that some first-floor zones were pressurized and others depressurized with reference to outside (Figure 7). The northwest zone, for example, operates at +17.1 Pa (0.0686 in w.g.) while the northeast zone operates at –7.8 Pa (0.0313 in w.g.). The cause of these pressure differentials is unbalanced or restricted return air. There are three air handlers serving the six zones of the first floor. The ceiling space is used as a return plenum. The fire walls that separate the zones intersect the return plenum, creating restriction to return air flow. Return transfer “windows” with fire dampers were provided to allow transfer of return air from one zone to the next. However, these transfers were undersized, in many cases, by a factor of four (Figure 8). In fact one fire damper into the Boardroom had failed in the closed position. Figure 8 shows the “as found” size of the transfer windows and the additional transfer window area required to reduce pressure differential across the fire wall to 2 Pa (0.0080 in w.g.) when the air handlers were at maximum variable air volume setting (VAVmaximum). As of 2003, the Florida Mechanical code requires pressure drops across interior partitions to be no greater than 2.5 Pa (0.0100 in w.g.).
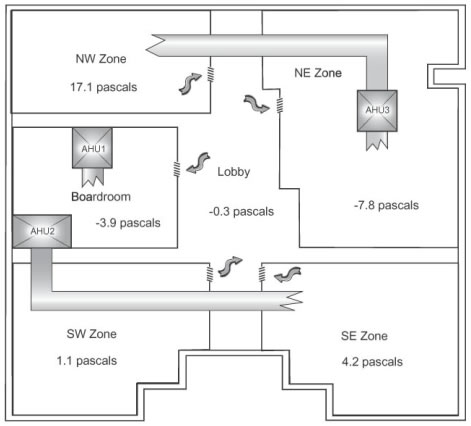
Figure 7: First Floor Plan Showing Return Air Crossover
and Zonal Pressures
The variable air volume system (VAV) has dramatic impact on air flow imbalance. At VAV maximum, pressure differentials of as much as 25 Pa (0.1004 in w.g.) from one zone to another were observed. However, at VAV minimum, the zonal pressure differences were less than 2 Pa (0.0080 in w.g.) between zones. Because the VAV setting continuously adjusts up and down throughout each day, and throughout the week, building pressure is in a continuous state of flux.
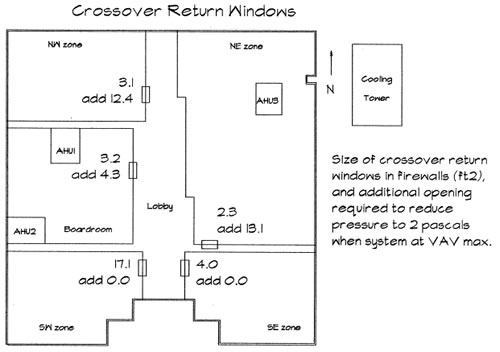
Figure 8: Transfer Area (ft2) Needed to Balance Return
Air at VAV Max
Not only do pressures go up and down, but the building ventilation rate is subject to wild variations. The amount of outdoor air drawn into the return side of the system is a function of the return side pressure, and this pressure is a function of VAV setting. As VAV is reduced, outdoor ventilation air is reduced which in turn decreases building pressure (with respect to outdoors) and the building ventilation rate, thereby increasing indoor radon levels. Outside air was only 35% of design when the system was at VAV maximum. However, the system rarely operates at VAV maximum even during the middle of summer. This means outside air was significantly lower than design all of the time. In a hot and humid climate, the outside air should equal or exceed exhaust air flow to produce neutral or slight positive pressure (+1 Pa or 2 Pa with reference to outdoors).
Per design, exhaust air flow for the first four floors (which operate as a separate open zone separate from the fifth floor) have total exhaust of 2,880 cfm (1359 l/s) and total OA of 3,949 cfm (1864 l/s). This is reasonable excess of outside air for pressurizing the building, but only occurs when the VAV is at maximum. However, there will not be enough outside air most of the time when VAV operates considerably less than maximum. The TAB report shows that OA declines to 3,108 cfm (1467 l/s) at VAV 60%. Below this level, the building will operate at negative pressure.
As a retrofit, powered fans were installed on two first floor outside air ducts to increase outside air during normal VAV operation during the day. This was found to decrease the first floor average radon concentration from 8.1 pCi/l to 4.8 pCi/l, a 41% reduction. Increasing the outside air will reduce indoor radon levels by diluting radon (as long as the outside air itself is free of radon) and by increasing pressure inside the building (this resists radon entry through slab penetrations). Additional retrofits were implemented. Slab penetrations were sealed to reduce soil pathways and some outside air ducts were increased in size to improve ventilation.
First floor zones with significant negative pressures were found that create the pressure differential required to drive radon into the building. Establishing pressurized zones required increasing the size of the return transfer window especially when VAV was at maximum. Often VAV operated at less than maximum, resulting in much less outside air than exhaust causing a second source of building depressurization. Increasing the amount of outside ventilation air beyond the building exhaust rate will increase pressurization and ventilation causing indoor radon levels to drop if the outside air source is radon free. It is important in hot and humid climates to bring the outside air through a cold cooling coil to remove moisture before distribution or high interior relative humidity will result.
This one-story manufactured building contained university social science faculty offices and one classroom. It is composed of seven units assembled into one integrated building with a flat roof over 4,920 ft 2 (457 m 2) of conditioned space. Seven wall-hung package cooling units, each with 2.5-tons of cooling capacity, were located on the west wall of the building. Building airtightness testing measured 3,875 CFM50 (1829 l/s @ 50 Pa). Normalized by volume this is 6.3 ACH50 and is considered reasonably tight. Batt insulation was located up against the roof deck, placing the primary thermal barrier and the primary air barrier at the roof deck, resulting in a type 2 ceiling space.
Figure 9 shows a floor plan with the AC units at the top and with pressure measurements taken while office doors were closed. Arrows point from high to low pressure.
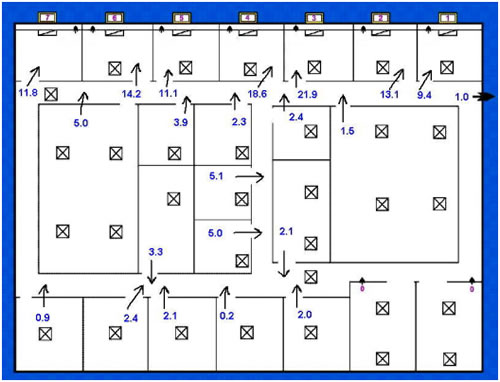
Figure 9: Floorplan and Pressure Differentials (Pa) Across
Closed Doors
Each AC unit has a single return located in the exterior wall of seven west offices. Supply ducts run through the ceiling space eastward to serve the various spaces. A transfer grille was located in the door of each west office to transfer air when the door is closed. This 9 in x 9 in (0.2286 m x 0.2286 m) grille (with approximate 0.40 net area fraction) is undersized by a factor of 8, under the assumption that 70 square inches (0.0452 m 2) of net free area transfer is required for each 100 cfm (47.2 l/s) of return air. The actual free area required depends upon the transfer grille design. The simplest design with a high percentage of net free area would likely need about 70 square inches per 100 cfm. A transfer grille with a lower percentage of net free area may need as much as 100 square inches (0.0645 m 2) per 100 cfm. There is a 14.3 Pa (0.0574 in w.g.) drop in pressure on average from main building to each west office when the office door is closed.
The airflow distribution for a typical unit is shown in Figure 10. The sum of outside air, return leakage, and return grille flow, is 665 cfm (313.8 l/s), while supply grille flows sum to 541 cfm (255.3 l/s). Given flow hood measurement accuracy of +/- 3%, we conclude that the difference of about 120 cfm (56.6 l/s) is primarily due to supply duct leakage (The supply diffusers are 2 ft x 2 ft four-way throw which the flowhood measures reasonably well, unlike single throw diffusers discussed earlier.) Duct leakage testing on this unit measured Q 25,total =252 which is quite leaky for this small system. Our Q 25,total measurement is based on ASHRAE Standard 152-2004 where the total system leakage in cubic feet per minute is measured using a calibrated fan to depressurize the return and supply ducts to 25 Pa (0.1004 in.w.g.) of pressure. Fortunately the supply leakage is easily “regained” since it is lost into a type 2 ceiling space.
The total lack of air balance becomes more obvious when examining the air flow balance on one of the west offices. With the door closed, the following air flows were measured; 234 cfm (110.4 l/s) from the supply, 50 cfm (23.6 l/s) through door transfer, and 44 cfm (20.8 l/s) through door undercut. This only totals 328 cfm (154.8 l/s), which is only 53% of the return grille flow. Based on the premise that the walls and floor are fairly tight, and that the suspended T-bar ceiling is very leaky, we conclude that most of the remaining 287 cfm (135.4 l/s) balance comes from the ceiling space.
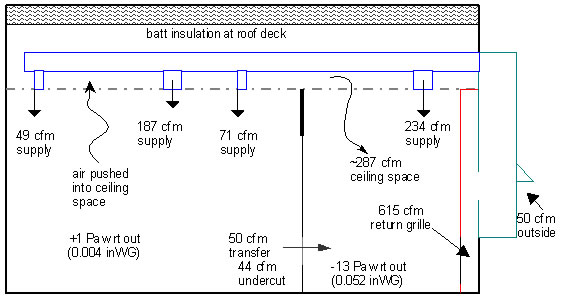
Figure 10: Typical Zone Flow Balance With Office Door Closed
Served by AHU#2
The estimate of return air through ceiling tiles was tested by opening one 2 ft x 1 ft (0.61m x 0.30m) ceiling tile in the office. Office pressure changed from –13.0 Pa (-0.0521 in w.g.), to –2.2 Pa (-0.0088 in w.g.), supply air decreased to 216 cfm (101.9 l/s), door transfer went to 39 cfm (18.4 l/s), door undercut went to 34 cfm (16.0 l/s), and return grille flow increased to 656 cfm (309.6 l/s). The expected balance would be 367 cfm (173.2 l/s) through the ceiling when sum of supply air, door transfer and undercut are subtracted from return grille flow. When a flow hood was placed over the open tile, the measurement was 383 cfm (180.8 l/s), or 4% higher than expected for the hole plus remainder of the ceiling.
Measurements found similar unbalance in the other six west offices, and it was concluded that overall more than 45% of the return air comes from the ceiling space when all office doors are closed. No monitoring was done to determine the actual amount of time that the west office doors were closed; however, it is estimated that they are only open a small percentage of time since they are professor offices. In conclusion, this is a building with extreme uncontrolled air flows caused by unbalanced return air. The type 2 ceiling space, however, minimized the energy impacts of these huge uncontrolled air flows in this building. On the other hand, if this building had had a type 4 ceiling space (hot and humid vented attic), then the impacts would be great and occupants would not need researchers to tell them they had a problem.
Air distribution should be planned and controlled from the supply back to the return side of the air handler. This means providing ducted returns or air transfer from spaces that can be closed off from other sections by walls and doors. Ducts and air transfers must be sized correctly for the airflow to maintain zonal air balance. When ducted, return air to a zone must closely match the supply air to that zone. When employing return transfers, the cross sectional area of the transfer must be large enough to avoid excessive pressure differentials. The Florida Mechanical Code has adopted 2.5 pascals (0.0104 in w.g.) as the maximum pressure drop across partitions that separate supply air from the return side of the air handler. As a basic rule of thumb, open transfers with no duct or grilles require about 55 square inches (0.0355 m 2) of opening for each 100 cfm (47.2 l/s) of return air. For through-the-wall transfers or ducted transfers, 70 to 100 square inches (0.0452 to 0.0645 m 2) of net free area is normally required to meet the 2.5 Pa objective.
Research in Florida has shown that unbalanced return air is common and has the potential to cause very severe problems.
The severity of impact from unbalanced return air depends upon the quality and amount of uncontrolled air from ceiling or other non-conditioned space. A vented ceiling space with insulation on tiles will have very high sensible and latent heat contents in hot and humid climates resulting in large heat gains. Buildings with this type of ceiling in cold climates will experience very high heat losses. Quality will also be degraded if pollutants are present in ceiling space or below slab on grade as they are transported into conditioned space. The quantity of uncontrolled air related to unbalanced return air is determined by the length of time interior doors are closed while the air handler is operating. The unbalanced air flow ceases once the door is opened or when the air handler shuts off.
References
Cummings, J.B., C.R. Withers, N. Moyer, P. Fairey, and B. McKendry. 1996. Uncontrolled Air Flow in Non–Residential Buildings; Final Report FSEC-CR-878-96. Florida Solar Energy Center, Cocoa, FL, April 1996.
Cummings, J., D. Shirey, C. Withers, R. Raustad, and N. Moyer. 2000. Evaluating the Impacts of Uncontrolled Air Flow and HVAC Performance Problems on Florida's Commercial and Institutional Buildings; Final Report FSEC-CR-1210-00. Florida Solar Energy Center 1679 Clearlake Road, Cocoa, FL, October 31, 2000.
Tyson, James and C. Withers. 1995. Demonstration of Radon Resistant Construction Techniques Phase II; Final Report EPA-600/R-95-159. United States Environmental Protection Agency, Office of Research and Development, Washington, D.C., November 1995.
Williamson, A., B. Pyle, S. McDonough, and C. Fowler. 1994. Florida Large Building Study 1994 Demonstration Report SRI-ENV-94-603-7400.93.41.1. Southern Research Institute 2000 9 th avenue South, Birmingham, Alabama August 2, 1994.
Withers, Charles and Cummings, James. 2000. Building Envelope Air Leakage Failure in Small Commercial Buildings Related to the Use of Suspended Tile Ceilings. 12th Symposium on Improving Building Systems in Hot and Humid Climates. San Antonio, Texas March 2000.
© 2007-2014 University of Central Florida. The Florida Solar Energy Center (FSEC)
is a research institute of the
University of Central Florida.
For more information about FSEC, please contact us or learn more about us.
Find us on Facebook!