

Reference Publication: Cummings, J. B., C.R. Withers, P. Fairey, B. McKendry, and N.A. Moyer, 1995, "Indoor Air Quality Impacts of Uncontrolled Air Flow and Depressurization in Eight Commercial Buildings in Central Florida". Proceedings of the Eighth Annual Indoor Air Pollution Conference. Tulsa, OK, September, 1995. Disclaimer: The views and opinions expressed in this article are solely those of the authors and are not intended to represent the views and opinions of the Florida Solar Energy Center. |
Indoor
Air Quality Impacts of Uncontrolled Air Flow and
Depressurization in
Eight Commercial Buildings in Central Florida
James
B. Cummings, Charles
R. Withers, Philip W. Fairey,
Bruce McKendry, and Neil Moyer
Florida
Solar Energy Center (FSEC)
FSEC-PF-414-95
Abstract
Field investigations were done in 68 commercial buildings to identify uncontrolled air flows and pressure imbalances. Results from eight buildings (six restaurants and two sports facilities) are reported in this paper. Testing included building airtightness tests, identification of building air barrier location, duct system airtightness, characterization of pressure differentials, building air flow balance, and infiltration/ventilation rates. Six restaurants and one sports facility were found to operate at negative pressures which ranged from -0.003 inWC (-0.8 Pa) to -0.173 inWC (-43 Pa) and averaged -0.051 inWC (-12.7 Pa) under normal operation. A second sports facility operates partially at positive pressure and partially at negative pressure. Variables which affect depressurization include large exhaust fans, missing or undersized make-up air, intermittent outdoor air caused by the cycling of air handlers, dirty outdoor air and make-up air filters, ceiling return plenums leaking to outdoors, undersized return air pathways, and building airtightness. These uncontrolled air flows and pressure imbalances impact energy use, ventilation rates, sizing of heating and air conditioning systems, indoor comfort, relative humidity, moisture damage to building materials, mold and mildew growth, operation of combustion equipment, and indoor air quality.
Introduction
Uncontrolled air flows and pressure imbalances, resulting from duct leakage, return design problems, closed interior doors, and operation of exhaust equipment and fans, have been identified in residential and commercial buildings by Florida Solar Energy Center staff. These uncontrolled air flows and pressure differentials have important implications for energy use, peak electrical demand, ventilation rates, sizing of heating and air conditioning systems, indoor comfort, and indoor relative humidity. They also have important potential impacts upon mold and mildew growth, drafting of combustion equipment, and indoor air quality.
Because commercial buildings are larger and more complex and have greater internal heat generation, greater ventilation requirements, and larger air moving equipment than residences, we have found that commercial buildings have greater uncontrolled air flows and pressure imbalances. In order to understand the nature, extent, and impacts of UAF in small commercial buildings, testing has been done in 68 small non-residential, non-industrial buildings.
There are a great variety of building construction types, HVAC system designs and modes of operation, and building use among commercial buildings. The variety is much greater than is found among residential buildings. One parameter which distinguishes many commercial buildings from residential buildings is widespread use of exhaust fans, especially in certain types of commercial buildings, including restaurants and sports facilities. This paper reports research from eight buildings, including field testing methods, building and duct system airtightness, building air flow balance, pressure differentials, and the causes and impacts of pressures in buildings.
Diagnostic Methods and Testing Protocols
In order to understand the air flow and pressure differential dynamics which often cause or interact with indoor air quality, newly developed specialized tools are available and necessary to obtain a complete picture of how the building is operating, what the ventilation rates are, what is causing various pressure differentials, and how the building is working as a system. Following is a review of diagnostic methods used in this research project to diagnose uncontrolled air flow problems in buildings.
Building Airtightness Testing
The first step in the diagnostic process is building airtightness testing. The building is prepared by turning off air moving equipment, including air handlers, exhaust fans, make-up air fans, and clothes dryers. Outdoor air, exhaust fans, and make-up air openings are sealed off.
A multi-point airtightness test is performed (ASTM E 779-87, "Standard Test Method for Determining Air Leakage Rate by Fan Pressurization"), using from one to six calibrated fans (blower doors), depending upon the building airtightness and size, and generally obtaining air flow at six to eight building pressures in the range from -0.040 inWC (-10 Pa) to -0.241 inWC (-60 Pa) depressurization. (Note that all pressures expressed in this paper are with respect to outdoors unless otherwise indicated). Knowledge of building airtightness assists in interpretation of other field testing, especially pressure differential measurements.
Identification of Building Air Barriers
With the building depressurized to -0.201 inWC (-50 Pa) by the calibrated fan, pressures in various zones of the building are measured in order to know which parts of the building are "indoors" and which parts are "outdoors" -- that is, which portions of the building are within the building air barrier and which are not (see definitions). Pressure may be measured in the ceiling space, attic space, wall cavities, chases, soffits, mechanical rooms, space between floors, etc. Consider an example; if the ceiling space is at -0.020 inWC (-5 Pa) when the occupied space is at -0.201 inWC (-50 Pa), this indicates that the ceiling space is reasonably well ventilated to outdoors, and that the ceiling is the primary air barrier. It also indicates that the ducts, located in the ceiling space, are in a zone that is outdoors. Therefore, it will be more important to measure duct leakage. If, on the other hand, the ceiling space is at -0.197 inWC (-49 Pa) when the occupied space is at -0.201 inWC (-50 Pa), then the ceiling and the ducts are located indoors. (Note that being inside the building air barrier does not ensure, however, that the ceiling space and the ducts are inside the thermal barrier; for example, the insulation may be on top of the ceiling tiles while the roof deck is the air barrier.)
Consider another example; a mechanical room containing a gas water heater is at zero pressure when the occupied zones are at -0.201 inWC (-50 Pa). This indicates that the mechanical room is well connected to outdoors and poorly connected to indoors, and that the combustion equipment located in that room will not be significantly affected by any pressures which may be created in the occupied zones.
Duct System Airtightness Test
Airtightness of the duct system is measured using calibrated fans (duct test rigs or duct testers). All registers except one supply and one return are masked off. Outdoor air is masked off. Calibrated fans are attached to the open registers. A barrier is placed in the air handler (at the filter, coil, or blower) to divide the system into supply and return. Air is drawn from the duct system by the calibrated fans and a multi-point airtightness test is done, with each side of the system at the same pressure (duct pressure is measured near the air handler and referenced to the zone in which the ducts are located). CFM25 (air flow through leaks in the duct system when the ducts are at -0.100 inWC (-25 Pa)) is determined for both the supply and the return side of the system. The combined CFM25 (add supply and return sides together) represents leakage to outdoors, unconditioned building space, and unconditioned building space, and can be expressed as CFM25TOTAL.
The duct system airtightness test can be repeated to determine what portion of the duct leakage is to outdoors (or buffer zones which are well ventilated to outdoors). Using a calibrated fan, the building is depressurized to the same pressure as the duct system, usually at just one pressure of -0.100 inWC (-25 Pa), and the duct system airtightness test is repeated. Since the occupied zone and the ducts are at the same pressure, the duct test rig is "seeing" only duct leaks to outdoors. The resulting CFM25 can be expressed as CFM25OUT.
If the ducts, plenums, and air handler are within the air barrier of the building, then the second test (with the building depressurized) is not needed. In some cases, the ducts are located within the air barrier of the building, but outside the thermal barrier. An example of this is when the roof deck is the building air barrier, the ducts are located in a ceiling space, and the insulation is located on top of a t-bar ceiling. (T-bar ceilings are used in nearly all commercial buildings. It is composed of t-shaped metal framework suspended from above with ceiling tiles supported within the metal framework). Duct leakage to and from these ducts causes considerable heat gain from ceiling space during the cooling season and heat loss during the heating season. Even though this leakage occurs within the air barrier of the building, it occurs outside the thermal barrier of the building and consequently there are significant energy penalties.
Pressure Differentials
Pressure differentials are measured in the building with the building and HVAC systems in various modes of operation. Pressure in the building is measured with respect to (wrt) outdoors once with the air handlers and exhaust fans turned on (normal operation) and a second time with them turned off. Pressure in various rooms and zones of the building are measured with doors open and closed and various HVAC equipment turned on and off in order to characterize pressure differentials between various zones of the building and between those zones and outdoors. A primary objective is to characterize the effect of the air moving equipment on building and zone pressures, since negative pressure can draw pollutants from the soil, backdraft combustion equipment, and draw humid outdoor air into building cavities.
Pressure differential measurements are made with two types of digital manometers with resolution to 0.0004 inWC (0.1 Pa); hand-held units and an 8-channel unit. The hand-held units have time averaging capabilities which allow discriminating small pressure differentials even when significant fluctuations exist because of wind. A multi-channel manometer with interface to computer display and memory was used to sample at up to eight locations simultaneously throughout the building and mechanical systems, continuously plot on a computer screen, and store data for later analysis.
Infiltration/Ventilation Rates
Using tracer gas decay methodology (ASTM E 741, "Standard Test Method for Determining Air Leakage Rate by Tracer Dilution"), the building infiltration/ventilation rate is measured, once with the HVAC equipment operating and then again with the HVAC equipment turned off (if possible or practical). In many restaurants, it is difficult to find a period when the occupants will allow turning off the mechanical systems.
Air Flow Rates
HVAC system air flow rates are measured. A number of different measurement techniques are used. Air flow at supply registers and return grills is measured by air flow hood. Outdoor air is typically measured with a flow hood, by placing the air flow hood over the outdoor air opening.
Outdoor air can also be determined by means of tracer gas measurement. Tracer gas is distributed into the building (as in the tracer gas decay infiltration test) and well mixed (about 15 minutes with the air handlers operating). Tracer gas concentration is then sampled at three locations for each air handler; A) in the room near the return grill, B) at the discharge of a supply grill, and C) at the outdoor intake location (since there may be some tracer gas in the air entering the outdoor air intake) (Cummings and Tooley, 1989). Total outdoor air fraction (OAFT; includes air entering the outdoor air vent and return leaks from outdoors) is calculated by:
OAFT = (A - B)/(A - C)
The test is then repeated with the outdoor air vents sealed. In this case, the return leak fraction (RLF) is obtained. RLF is the proportion of return air flow that enters the return air distribution system through leaks.
RLF = (A - B)/(A - C)
Outdoor air fraction (OAF; air only entering the outdoor air vent) is calculated as follows:
OAF = OAFT - RLF
Outdoor air flow rate (OAFR) is then calculated by multiplying OAF times total air handler flow rate.
OAFR = OAF * air handler flow rate
Flow rate of exhaust fans and make-up air fans can be measured by means of tracer gas injection and sampling with a gas analyzer downstream. A tracer gas is injected into the air stream so that the gas is well distributed (tubing with holes is often used), and the gas is sampled downstream in a distributed manner (a loop of tubing attached to a sampling pump). The injection rate of the tracer gas and the concentration downstream must be accurately measured. Flow rate is calculated by means of the following formula (Grieve, 1991):
q = dose/(Cs - Cb)
where:
q is the air flow rate in cfm (L/s)
dose is tracer injection rate in cfm (L/s)
Cs is the tracer concentration at the sample point
Cb is the tracer background concentration in the duct
Flow of exhaust fans and make-up air fans can also be measured by means of a capture tent (polyethylene sheeting on a PVC frame will do) and a calibrated fan (such as a blower door or duct tester). A tent is placed over the discharge of the exhaust fan and a calibrated fan is mounted into the side of the tent. A manometer measures the pressure in the tent wrt outdoors. The calibrated fan is turned on to draw air out of the tent and reduce the pressure in the tent (recall that the exhaust fan is blowing air into the tent) until the pressure in the tent is neutral wrt outdoors. Air flow through the calibrated fan is then equal to the flow through the exhaust system. Make-up air is measured in an analogous manner, with the calibrated fan blowing air into the tent.
The building can also be used as a capture tent. Look at an example of measuring exhaust fan flow in a restaurant. With the exhaust fan(s) turned on (all other air moving equipment turned off), the pressure in the building is measured (this could be -0.241 inWC (-60 Pa) or greater in many restaurants). The calibrated fan is turned on to blow air into the building until the pressure in the building is neutral wrt outdoors. The air flow through the calibrated fan is equal to the exhaust fan flow rate. (Note this method works well if the building is tight or the exhaust fans are large. Restaurants may be tight and often have large exhaust fans.) Note, however, that this is the flow rate that occurs when the building is at neutral pressure. If the normal operating pressure (NOP) of the building is much different from neutral, -0.040 inWC (-10 Pa) for example, then this measurement of exhaust or make-up air may be different than that which actually occurs when the building is at NOP, because building depressurization will reduce exhaust fan flow and increase make-up air flow. To correct for this, the calibrated fan is turned on to move air into the building until the NOP is reached (-0.040 inWC (-10 Pa)); then the flow rate through the calibrated fan is recorded (say 3600 cfm (1700 L/s)). Now the air flow rate into the building due to the -0.040 inWC (-10 Pa) depressurization is calculated using the building airtightness curve. (Example: say C = 300, n = .65, then q would be equal to 1340 cfm (632 L/s) at -0.040 inWC (-10 Pa)). Exhaust fan flow is equal to flow through the calibrated fan plus the building leakage; 3600 cfm plus 1340 cfm = 4940 cfm (1700 L/s plus 632 L/s = 2332 L/s).
The flow of make-up air can be measured in an analogous manner. Turn on only the make-up air fan and use a calibrated fan to pull air out of the building until reaching NOP. Make-up air flow is then equal to the air flow through the calibrated fan minus the air flow through the building envelope (this assumes the NOP is negative). Alternatively, the make-up air flow can be measured with the make-up air and the exhaust fans operating simultaneously (note that the make-up air flow is usually less than the exhaust air flow). If the building is at its NOP, then make-up air is equal to exhaust fan flow minus building leakage at NOP. If the building is depressurized beyond its NOP, then turn on the calibrated fan to blow air into the building until it reaches its NOP. The make-up air flow is equal to the exhaust fan flow minus building leakage minus calibrated fan flow. Note also that in this situation, the calibrated fan flow is equal to OAFRT (the sum of outdoor air flow and return leaks that draw air from outdoors).
Field Testing Findings
Field testing has been completed on 68 commercial buildings. Findings are presented from eight buildings, six restaurants and two sports facilities. They are all one-story and range in size from 1942 ft2 (180 m2) to 16,713 ft2 (1549 m2) and are located in central and east central Florida. Two of the restaurants were tested because the business owner perceived some problem and invited the testing. In the other four restaurants, selection was made without prior knowledge of any problems. Both sports facilities had prior indication of indoor air quality concerns. Testing found significant uncontrolled air flows and pressure imbalances in all these buildings, including elevated humidity levels, mold and mildew problems, moisture damage to building materials, pilot lights being extinguished, backdrafting of combustion equipment, flame roll-out from water heaters, entry of sewer gas, increased cooling energy use, comfort problems, and difficulty opening exterior doors. Following is a discussion of field test measurements for the eight buildings contained in Table 1.
Building Airtightness
Building airtightness tests were done using calibrated fans. This test is usually done first to better interpret the air flow, pressure differential, and infiltration measurements that follow. Building airtightness ranged from 3.9 ACH50 to 31.2 ACH50 (air changes per hour when the building is depressurized to -0.201 inWC (-50 Pa); note that the occupied volume of the building is used as the basis for computing ACH50).
Air/Thermal Barrier Locations
During the building airtightness test, pressure mapping of the building is done. When the building is at -0.201 inWC (-50 Pa), it is of interest to know what pressures exist (all pressures referenced to outdoors) in walls, ceiling spaces, attics, chases, and mechanical closets. By measuring pressure in these locations, it is possible to identify the location of the building air barrier.
In most restaurants, the ceiling space is inside the building air barrier, because the ceiling is quite leaky (typically t-bar construction) and the roof deck is quite tight. In this sample of six restaurants, the building air barrier was at the roof deck in four cases while it was at the ceiling in two cases. It is not uncommon for the ceiling space to be at -0.194 inWC (-49 Pa) when the occupied zone is at -0.201 inWC (-50 Pa). This means there is a 0.004 inWC (1 Pa) drop across the ceiling and a 0.197 inWC (49 Pa) drop across the roof.
While the ceiling space is often inside the building air barrier, it is common for it to be outside the building thermal barrier. Insulation is often located on top of the ceiling tiles or attached to the bottom of the roof truss system. Therefore, the thermal barrier and the air barrier are not located at the same level. Table 1 shows the thermal volume (volume inside the building thermal barrier) and the air volume (volume inside the building air barrier). By studying these volumes, the reader can determine the location of the thermal barrier and the air barrier.
Table 1a. Field measurements of airtightness, air flows, and pressure differentials in eight commercial buildings
Restaurant
Type |
Floor
Area ft2 |
Occupied
Volume* ft3 |
Thermal
Volume* |
Air
Volume* |
CFM50 |
ACH50 |
DUCT
CFM25 |
ach
AHON |
ach
AHOFF |
OA
& MAˆ cfm |
RLF†
cfm |
EXHAUST
cfm |
Delta
PON˜ (inWC) |
| Pizza | 1942 |
15536 |
15536 |
15536 |
8072 |
31.17 |
116 |
1.94 |
1.95 |
0 |
109 |
3170 |
-0.006 |
| Subs | 3503 |
33279 |
42036 |
49042 |
2164 |
3.9 |
*** |
5.30 |
*** |
4670 |
336 |
5603 |
-0.100 |
| Bar | 2400 |
22800 |
25200 |
22800 |
6651 |
17.50 |
655 |
2.34 |
0.64 |
0 |
505 |
987 |
-0.003 |
| Chicken 1 | 3161 |
28330 |
28330 |
41093 |
6995 |
14.81 |
1282 |
11.20 |
*** |
8410 |
*** |
10606 |
-0.032 |
| Chicken 2 | 3321 |
28760 |
28760 |
53136 |
3689 |
7.70 |
*** |
5.90 |
*** |
6360 |
464 |
9272 |
-0.172 |
| Chinese | 7854 |
74613 |
106029 |
106029 |
10108 |
8.13 |
*** |
2.20 |
*** |
0 |
0 |
6495 |
-0.018 |
| Club House | 4351 |
43768 |
47861 |
43768 |
8426 |
11.55 |
1051 |
1.91 |
*** |
1107 |
746 |
3038 |
-0.024 |
| Sports Bldg | 16713 |
158774 |
306649 |
306649 |
25262 |
9.5 |
*** |
0.77 |
0.21 |
633 |
2110 |
2052 |
0.007 |
| Average | 5405 |
50733 |
75050 |
79756 |
8920 |
13.0 |
776 |
3.95 |
0.94 |
2647 |
610 |
5153 |
-0.044 |
Table 1b. Table convereted to SI units
| Restaurant Type | Floor
Area m2 |
Occupied
Volume* m3 |
Thermal
Volume* m3 |
Air
Volume* m3 |
L/s@50 |
ACH50 |
DUCT
L/s@25 |
ach
ON |
ach OFF |
OA
& MA^ L/s |
RLF†
L/s |
Exhaust
L/s |
Delta
PON˜ (Pa) |
| Pizza | 180 |
440 |
440 |
440 |
3810 |
31.17 |
55 |
1.94 |
1.95 |
0 |
51 |
1496 |
-1.5 |
| Subs | 325 |
942 |
1190 |
1388 |
1021 |
3.9 |
*** |
5.30 |
*** |
22.4 |
159 |
2465 |
-25 |
| Bar | 226 |
645 |
713 |
645 |
3139 |
17.50 |
309 |
2.34 |
0.64 |
0 |
238 |
466 |
-0.8 |
| Chicken 1 | 294 |
802 |
802 |
1163 |
3302 |
14.81 |
605 |
11.20 |
*** |
3970 |
*** |
5006 |
-8 |
| Chicken 2 | 309 |
814 |
814 |
1504 |
1741 |
7.70 |
*** |
5.90 |
*** |
3002 |
219 |
4376 |
-43 |
| Chinese | 730 |
2112 |
3001 |
3001 |
4771 |
8.13 |
*** |
2.20 |
*** |
0 |
0 |
3066 |
-4.6 |
| Club House | 404 |
1239 |
1354 |
1239 |
3977 |
11.55 |
496 |
1.91 |
*** |
523 |
352 |
1434 |
-6.1 |
| Sports Bldg | 1549 |
4497 |
8685 |
8685 |
11924 |
9.5 |
*** |
0.77 |
0.21 |
299 |
996 |
969 |
1.8 |
| Average | 502 |
1436 |
2125 |
2258 |
4211 |
13.0 |
366 |
3.95 |
0.94 |
1249 |
273 |
2432 |
-10.9 |
*
See definitions at end of paper
ˆ OA
means otudoor air. MA means make-up. See definitions.
† RLF
means return leak flow, the air flow rate through return duct leaks
under normal operation.
˜ Delta
PON is the pressure in the building with respect to outdoor with
HVAC system in normal or typical operation.
*** Unable to measure.
In this sample of seven restaurants, the insulation was at the roof deck level in one case, on top of the ceiling in three cases, and suspended from the bottom of the trusses in three cases. In only two cases were the thermal barrier and air barrier at the same location.
Having the air barrier and thermal barrier at different planes can create performance problems for the insulation system because air can often flow through the insulation plane resulting in air transported heat transfer. As will be seen, many restaurants operate under substantial negative pressure, and this negative pressure can draw hot air from the ceiling space, through the insulation, and into the occupied zone.
Duct System Location
Air distribution system efficiency depends upon duct insulation R-value, ambient temperature condition, the amount of duct air leakage, and duct location. In this sample of eight buildings, the duct system is located in the ceiling space in all cases. If the ceiling space is located inside both the air and thermal barrier of the building, then the ambient conditions will be mild so that both conductive and air leakage losses will be minimal. Much of the energy lost from supply leaks will be regained to the occupied space, especially since the occupied space in restaurants is typically depressurized wrt the ceiling space.
Ceiling spaces can be grouped into four types, from a thermal barrier and air barrier perspective. The ceilings of these eight buildings fall into three of these types. 1) In two of the eighth buildings, the ceiling space (and duct system) is inside both the air and thermal barrier (ceiling space is cool/dry). 2) In three cases, the ceiling space is inside the air barrier but outside the thermal barrier (ceiling space is hot/dry). 3) In three cases, the ceiling space is outside both the air and thermal barrier (ceiling space is hot/humid). 4) In none of these buildings was the ceiling space outside the air barrier but inside the thermal barrier (ceiling space is warm/humid; this was observed in one case, however, in the larger sample of 68 commercial buildings).
Duct System Airtightness
Duct system airtightness was measured in three of the six restaurants, and one of the two sports facilities. (Note that gaining access to many restaurants is difficult, because they are open for business most of the time and some of the diagnostic testing interferes with store operations. This explains in part why duct airtightness was not measured in all cases.) In the pizza restaurant, the ductwork was reasonably airtight, tighter than in a typical residential duct system. In three other buildings, duct leakage was two to three times greater than typical residential duct leakage; 301 CFM25 (142 L/s @ 25) per 1000 ft2 (92.9 m2) floor area compared to 131 CFM25 (62 L/s @ 25) per 1000 ft2 (92.9 m2) floor area in residences (Cummings, Tooley, and Moyer, 1991). In these restaurants, leakage is on the order of 50 times greater than is indicated in the SMACNA standard (SMACNA, 1985).
Building Pressures
One of the most striking findings is that restaurants are so consistently depressurized. All six restaurants operate at negative pressure under normal operation. Average operating pressures range from -0.0032 inWC (-0.8 Pa) to -0.173 inWC (-43 Pa). For any given restaurant, pressure ranged considerably depending upon which equipment was operating. One of the sports facilities operates continuously at -0.024 inWC (-6 Pa). At the university sports building, about 40% of the building was depressurized and 60% was pressurized. Let's consider each building individually to identify the types, ranges, and causes of depressurization.
Pizza restaurant. This is a 21 year old building that was a convenience store/gas station before being converted into a pizza parlor. This small "mom and pop" operation has difficulty covering salaries and expenses, turns on the two air conditioners only when there are customers, and operates the large pizza oven without use of the two kitchen exhaust fans because they make the kitchen uncomfortable. In spite of being leaky (31.2 ACH50, about half of which is located in two passive make-up air vents), this building experiences substantial depressurization with the kitchen fans operating. With one fan turned on, the 1942 ft2 (180 m2) building depressurizes to -0.012 inWC (-3 Pa). With the second fan turned on, the building depressurizes to -0.044 inWC (-11 Pa). (Each fan exhausts about 1600 cfm (755 L/s).) While there is no mechanical make-up air, two passive make-up air vents discharge from the ceiling immediately above the pizza preparation tables when the exhaust fans are operating. Much of this make-up air comes from the unconditioned ceiling space because there are no sleeves where the vents pass between the (gypsum board) ceiling and the roof deck.
Sub sandwich restaurant. This nine-month old building has floor area of 3503 ft2 (325 m2) and is the most airtight of the group (3.9 ACH50). Three types of mechanical systems move air across the building envelope; 1) three kitchen exhaust fans and one bathroom exhaust fan, 2) one make-up air blower, and 3) three outdoor air intakes on three roof-top package units. Measurements revealed that the building was operating at -0.10 inWC (-25 Pa) continuously from about 8:30 AM to 10:30 PM. The business owner reported that the pilot light on the instantaneous gas water heater was repeatedly going out and that opening the back door to the store allowed them to light the pilot light and use hot water.
Testing revealed that the three kitchen exhaust fans were moving 5940 cfm (2804 L/s) of air out of the building, while the make-up air (MA) and outdoor air (OA; air handlers ran continuously throughout the day) brought only 4670 cfm (2204 L/s) of air into the building (3220 cfm (1520 L/s) MA and 1450 cfm (684 L/s) OA).
It was discovered that dirty filters were the cause of the air flow imbalance; they had not been changed in the nine months the building had been in operation and were reducing flow through the make-up air and the outdoor air. When the filters were replaced or cleaned, MA and OA increased by 990 cfm (467 L/s) to 5660 cfm (2672 L/s), respectively, and building pressure increased from -0.10 (-25 Pa) to -0.008 inWC (-2 Pa). After cleaning the filters, the water heater worked normally.
The business owner stated that the building had been in balance nine months earlier when it was first opened. The air conditioning contractor had demonstrated that the building was at positive pressure by showing smoke passing through the drive-through window from indoors to outdoors. Apparently, the pressure in the building had gradually gone from slightly positive pressure to -0.10 inWC (-25 Pa) negative pressure as the filters, especially the make-up air filter, became progressively dirty. Because of the tight building construction, only a small air flow imbalance caused a large pressure imbalance.
Bar and restaurant. This 10-year-old building has 2400 ft2 (223 m2) of floor area. It is the second most leaky building in this sample (17.5 ACH50). Given the concrete slab floor and concrete block wall construction, most of the leakage is in the ceiling plane. Both air handlers and all the ductwork is located in a residential style attic with asphalt shingles on 4:12 sloped plywood decking. There were large duct leaks in both systems, especially on the return side. Tracer gas tests found 505 cfm (232 L/s) of return leaks. The kitchen exhaust fan discharged 987 cfm (466 L/s) from the building and there was no make-up air. Building pressure was -0.0032 inWC (-0.8 Pa) throughout most of the day. When duct leaks were repaired, building pressure decreased to -0.0072 inWC (-1.8 Pa) since the return leaks were no longer pushing air into the building. The total amount of attic air entering the building was not significantly reduced as a result of duct repair because increased building depressurization pulled additional air from the attic. Installing make-up air in the kitchen and airtightening the ceiling plane could reduce the pressure imbalances, diminish the uncontrolled air flows and infiltration, reduce cooling energy use, and improve comfort.
Chicken restaurant I. This eight-month old building has floor area of 3161 ft2 (294 m2) and is of average airtightness (14.8 ACH50). Three types of mechanical systems move air across the building envelope; 1) four kitchen exhaust fans and one bathroom exhaust fan, 2) two make-up air blowers, and 3) four outdoor air intakes on four roof-top package units. Pressure measurements revealed that building pressures fluctuated from -0.011 inWC (-2.8 Pa) to -0.071 inWC (-17.8 Pa) throughout the day.
Testing found three kitchen exhaust fans moving 10,396 cfm (4907 L/s) of air out of the building while the make-up and air outdoor air brought only 8410 cfm (3970 L/s) of air into the building (MA = 6157 cfm (2906 L/s) and OA = 2253 cfm (1063 L/s)). The cause of the pressure fluctuations was identified. All four air handlers have separate thermostats, and when the load for a zone was satisfied, both the compressor and the air handler shut off. When the air handler is off, no outdoor air is brought into the building. Therefore, net air flow across the building envelope varied from -1986 cfm (-937 L/s) to -4239 cfm (-2001 L/s).
Chicken restaurant II. This store has 3321 ft2 (309 m2) and airtightness of 7.7 ACH50. Chicken restaurant I and chicken restaurant II are of the same chain. This building was recently converted from a bank to a restaurant. Three types of mechanical systems move air across the building envelope; 1) four kitchen exhaust fans and one bathroom exhaust fan, 2) two make-up air blowers, and 3) two of the four roof-top package units (serving the dining area) have outdoor air. Testing revealed that the building was operating at pressures from -0.137 inWC (-34 Pa) to -0.241 inWC (-60 Pa) throughout the day. Signs were posted on the exterior doors stating "please pull hard", because depressurization made it difficult to open the doors and some patrons mistakenly thought the store was closed.
Three kitchen exhaust fans were moving 9272 cfm (4376 L/s) of air out of the building while the make-up air and outdoor air brought only 6360 cfm (3002 L/s) of air into the building (MA = 5110 cfm (2412 L/s) and OA = 1250 cfm (590 L/s). Pressure fluctuated in the building between -0.137 inWC (-34 Pa) to -0.241 inWC (-60 Pa) because the air handlers cycle according to load, just as in chicken restaurant I. When the load for a zone is satisfied, both the compressor and the air handler shut off causing no outdoor air to be brought into the building. Therefore, net air flow across the building envelope varied from -2912 cfm (-1374 L/s) to -4162 cfm (-1964 L/s) throughout the day, depending upon which air handlers were operating.
Chinese restaurant. This is the largest of the restaurants, with 7854 ft2 (730 m2). It is an older building built in 1962, most recently renovated in 1992, and is tighter than average (8.1 ACH50). Only two kitchen exhaust fans mechanically move air across the building envelope. There is no make-up air fan and no outdoor air. In order to diminish the depressurization, an exterior kitchen door is left open throughout the day. Testing found that the exhaust fans were drawing 6495 cfm (3066 L/s) of air from the building, causing the entire space to operate at a constant -0.018 inWC (-4.6 Pa) throughout the day (kitchen door open). When the exterior kitchen door was closed, however, building pressure dropped to -0.108 inWC (-27 Pa).
Golf club house. This six-month old building has 4351 ft2 (404 m2) of floor area. Half the space is locker room, bathroom, office, and pro shop. The other half is restaurant/bar and kitchen. Throughout most of the building, there is a one-foot air space between the ceiling and the insulation batts which are attached to the bottom of the trusses. Above the insulation is an attic space containing three air handlers, three air distribution systems, two locker room exhaust systems, and the kitchen exhaust and make-up air systems. The building airtightness was 11.6 ACH50, somewhat tighter than average for the 63 commercial building sample. When the occupied zone was depressurized to -0.120 inWC (-30 Pa) by the calibrated fan, the attic space was -0.044 inWC (-11 Pa), indicating that the ceiling is the primary air barrier but it is not quite twice as airtight as the attic-to-outside interface. Since the attic has 69 eave vents, each with 22.5 in2 (145 cm2) net free area, it can be deduced that the ceiling is quite leaky (most of the leakage is in the t-bar ceilings of the dining/kitchen area, since the pro shop, offices, and bathroom ceilings are sheetrock).
Two types of mechanical systems move air across the building envelope; 1) one kitchen exhaust fan and two bathroom/locker room exhaust fans pull air out of the building and 2) one make-up air blower pushes air into the building. The three air conditioning systems have no outdoor air. Testing revealed that the kitchen exhaust fan was moving 2084 cfm (984 L/s) of air out of the building, the bathroom exhaust fans were drawing 954 cfm (450 L/s) out of the building, and make-up air (MA) was pushing 1107 cfm (523 L/s) into the building. As a result, the building operated at about -0.024 inWC (-6 Pa) throughout most of the day.
University sports building. This building has three major uses: office, class, and sports (exercise/locker/shower). Levels of heat and humidity generation vary considerably among these three areas. Coaches' office area: occupancy variation is limited, activity level of persons is low, and the moisture generation in this space is low. Classroom area: occupancy variation is great, going from near zero to very high occupancy as classes fill. Heat and moisture generation is generally low since the students are sedentary. Sports area: occupancy variation is great and to a certain extent seasonal in weight rooms, locker rooms, and shower areas. Heat and to an even greater extent moisture generation can be very high.
High humidity levels have resulted from the ceiling return plenum drawing considerable amounts of humid outdoor air into the building. Large exhaust fans in bathrooms, locker rooms, and shower areas draw about 2100 cfm from this 16,713 square foot building. A combination of outdoor air and return leaks draw about 2700 cfm of air into the building. The net flow of +600 cfm into the building would be sufficient to produce slight positive pressure in the entire building. However, zone 1 is depressurized to -0.006 inWC (-1.6 Pa) and zone 2 is pressurized to +0.008 inWC (+2.0 Pa). The largest air handler supplies air to both zones and the return pathway (through the fire wall) is undersized, resulting in an air flow and pressure imbalance.
The primary cause of high humidity in this building is that the air handlers of this chilled water system are oversized, thus reducing their ability to dehumidify. Indoor air quality problems related to mold and mildew, and the inability to control relative humidity, has led to a number of modifications to the HVAC systems and to the total energy use of the building. Shortly after the building was completed and many of the interior wall surfaces were turning black with mold growth, electric reheat was installed. Monitoring of system behavior indicated that over a typical summer 24 hour period, the average temperature drop across the cooling coil is 13F and the reheat raises the temperature 10F. Net temperature drop, therefore, is only 3F. Energy use by the electric reheat runs about $20,000 per year. Cooling coils (using chilled water) were also installed on the outdoor air ducts to cool and dehumidify the incoming outdoor air. More recently, heat pipes have been installed on three of the four air handlers to improve dehumidification. In spite of all these system modifications, relative humidity is still in the 56% to 59% most of the time, barely within acceptable limits.
Impacts of Building Depressurization on Indoor Air Quality
Testing found significant uncontrolled air flow and pressure imbalances in these buildings, and in each case there were unwanted consequences (some indoor air quality consequences) that could be linked to uncontrolled air flow. In some, there were high humidity levels, mold and mildew problems, and moisture damage to building materials. In others, pilot lights were being extinguished, combustion equipment was backdrafting, and in one case flame roll-out had occurred twice from a water heater. In one case sewer gas was entering the building because of negative pressure. In chicken restaurant II there were problems opening exterior doors and customers would sometimes turn away because they thought the store was closed. In a number of cases, negative pressure and uncontrolled air flows were causing substantial increased cooling energy use and comfort problems.
Moisture Problems
Uncontrolled air flow creates moisture problems in two ways; 1) depressurization increases ventilation and transports moisture from humid Florida outdoor air into the space often exceeding the dehumidification capacity of the air conditioning system and 2) humid outdoor air can be drawn into building cavities, such as walls, and condensation may form on the cool interior surfaces of these cavities.
In some cases, humidity levels in these eight buildings exceeded 75% RH. During one early morning test in a restaurant, water was dripping from all the supply registers and the floor was damp and slippery from condensation. In two establishments, moisture accumulation in walls had reached the point where the sheetrock was becoming soft, the wall paper was falling off the walls, and pink and black blotches of mold and mildew were growing on the vinyl wall paper/gypsum board interface. Since vinyl wall paper is a vapor retarder, the gypsum board was prevented from drying to the relatively dry indoor air.
Problems with Combustion Equipment
Five of these eight buildings have combustion water heaters. In two cases the combustion water heaters were drafting properly. In three cases, depressurization was causing backdrafting or spillage of combustion gases.
Atmospherically vented combustion water heaters rely upon buoyancy of the combustion gases (resulting from elevated combustion gas temperature) to draw the combustion fumes up the vent pipe. If the zone where the combustion equipment is located is depressurized beyond a specific level (that level depends upon the appliance type, the height of the vent pipe, ambient temperature, wind speed, and other factors), backdrafting may occur. (Backdrafting is reversal of flow in the vent pipe.) Some combustion appliances begin to backdraft when the combustion zone is depressurized to -0.020 inWC (-5 Pa) (Moffat, 1986).
In chicken restaurant II, the building operates at -0.137 inWC (-34 Pa) to -0.241 inWC (-60 Pa), but the combustion appliance drafts properly because it is located in an exterior closet that is isolated from the remainder of the building and has an exterior vented door. When the building was at -0.241 inWC (-60 Pa), the closet was at zero pressure wrt outdoors. In the golf clubhouse/restaurant, the water heater was exposed to -0.024 inWC (-6 Pa) throughout most of the day, but it nevertheless drafted satisfactorily during our testing.
On the other hand, the water heaters in the sub restaurant and chicken restaurant I experienced problems. In the sub restaurant, -0.10 inWC (-25 Pa) caused the water heater (an instantaneous type) to backdraft whenever it was operating. In addition, when it was not operating, backdrafting was sufficient to blow out the pilot light. In chicken restaurant I, depressurization varied from -0.011 inWC (-2.8 Pa) to -0.071 inWC (-17.8 Pa), depending upon how many air handlers were operating. If all four air handlers were off, depressurization reached -0.071 inWC (-17.8 Pa). The water heater was located in an interior closet that was well vented to indoors (the closet door was louvered and an additional grill was located above the doorway) and contained no combustion/dilution air openings to outdoors. Testing identified that when the appliance was operating, backdrafting would initiate when building pressure fell to about -0.052 inWC (-13 Pa). The owner reported that on two occasions flame roll-out occurred from the water heater. Both instances occurred at closing time (about 1 AM) when smoke was observed coming out of the closet. In each case the fire was put out with a fire extinguisher. Flame roll-out appears to be occurring at closing time for the following reason. When closing the store, standard procedure called for raising the thermostat settings on the four thermostats before leaving the store. This would, of course, cause all four air conditioners (and all outdoor air) to shut down. If the exhaust fans were still operating, then building pressure would go to -0.071 inWC (-17.8 Pa).
If the water heater was in operation when this depressurization occurred, combustion fumes would continue to go up the flue (the flue is the pipe inside the appliance) but not up the vent pipe. Flame roll-out would not occur. The strength of the well-established draft in the flue prevents reversal within the flue. However, if the water heater was not operating when the -0.071 inWC (-17.8 Pa) depressurization occurred, then there would be no established draft, and reversal within the flue would likely occur. Then when the water heater called for heat and the gas valve subsequently opened, gas would be pushed out of the combustion chamber and flames would occur outside the water heater. The authors did not see flame roll-out (though scorched areas on the overflow drain pan, tank, and pipe insulation were observed) and did not try to recreate the conditions that would produce it.
Uncontrolled air flow also created combustion safety problems in the university sports building. Two large 1.5 million Btu/hr boilers are located in a boiler room. It was brought to our attention that only one of the two gas hot water heaters are used, because operation of the second unit triggers the fire alarm. The problem seems to be related to a large 1400 cfm exhaust fan drawing air from the boiler room. Even though the room has a large passive grill in the exterior door (to outdoors), the depressurizing affect of the exhaust fan and the operation of the two boilers causes spillage or backdrafting, which triggers the fire alarm.
Mining of Sewer Gases
Another consequence of building depressurization is "mining" of sewer gas or soil gas. The term mining indicates that the sewer gases are in the soil or sewer system and are dug up and transported into the building. When portions of the building in contact with the soil are depressurized, there is the potential to draw soil gases (radon, pesticides, etc.) and sewer gases into the building. One documented case was found at the sub restaurant. During testing, a multi-gas analyzer sampled indoor air for a number of substances, including carbon dioxide and organic compounds (this latter filter detects a wide range of organic compounds but is specifically calibrated for methane). Figure 1 shows 7 hours of monitoring. Carbon dioxide peaked twice, once between 9:30 AM and 10 AM while the mechanical systems were turned off in preparation for the building airtightness test and later during the lunch hour when about 75 patrons occupied the dining area.
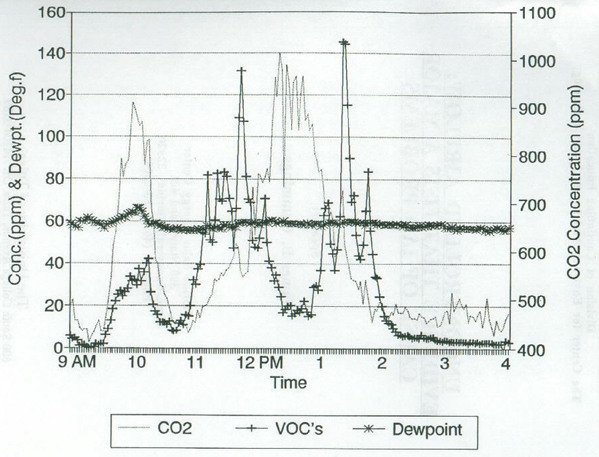
Figure 1. Monitoring of carbon dioxide, volatile organic compounds (VOCs), and dewpoint temperature in a fast-food restaurant. Elevated VOC levels resulted from gases being drawn from sewer pipes.
High organic compound readings, also shown in Figure 1, were a surprise, since no significant source of volatile organic compounds had been identified and the building was well ventilated (5.3 ach). The source, it turned out, was a toilet that was improperly seated. Given the -0.10 inWC (-25 Pa) of depressurization, gases inside the sewer pipes were being drawn into the bathroom and into the store. Perfume dispensers had been placed in the bathrooms to mask (unsuccessfully) the unpleasant odors.
Discussion
It is desirable to operate buildings at positive pressure in a hot and humid climate such as Florida, for a number of reasons. 1) Positive pressure makes it easier to control moisture in buildings, especially in building cavities because relatively dry indoor air is forced into walls and other buildings cavities. 2) Positive pressure reduces the entry rate of radon, sewer gases, and other soil related contaminants into the building. 3) Positive pressure assists in venting of combustion by-products.
Restaurants and some other types of commercial buildings often operate at negative pressure primarily because large exhaust fans are installed to remove heat, humidity, and cooking fumes, and often insufficient make-up air and outdoor air is provided to counter these large exhaust flows. Make-up air fans are designed to reduce building depressurization, reduce building ventilation rates, and save energy. In some restaurants, no mechanical make-up air system is provided; consequently the building may be greatly depressurized when exhaust fans are used. In other restaurants, make-up air is provided but may be only 55% to 75% of the exhaust flow rate, and outdoor air may not be sufficient to make up the balance. In most non-restaurant commercial building, make-up air is not provided. In one of the sports facilities, however, make-up air was provided because the building contained a restaurant and kitchen.
An additional complication is that outdoor air may not be continuous. Outdoor air only comes into the building when the air handler blowers are operating. In all six restaurants, the air handlers cycle on and off in accordance with load. In the sub restaurant, the units run nearly continuously throughout the day, in large part because they had two-stage compressors. In the chicken restaurants, however, the units have only single-stage compressors and they cycle on and off throughout the day. When the air handlers are off, the outdoor air stops and the pressure imbalance worsens.
Some may think that the solution would be continuous blower operation; put the fan control in the "on" position whenever the exhaust systems operate. Outdoor air would then be continuous. The problem, however, is that continuous blower operation leads to poor dehumidification performance. Air flowing through the air handler during the periods when the compressor is off, evaporates water from the coil and the drain pan and delivers it back into the space. Depending upon the air conditioner capacity-to-building load ratio and the cycling behavior of the thermostat, dehumidification performance may be seriously diminished (Khattar, Swami, and Ramanan, 1987). This could cause serious humidity problems in humid climates.
One solution is to use two-stage compressor air conditioners (constant fan speed but variable compressor capacity combined with face split coil design; this design improves dehumidification performance under part-load conditions). With this equipment, the air handlers will run nearly constantly, because the unit will cycle back and forth between first stage and second stage most of the time.
Perhaps the best solution is as follows. Increase the size of the make-up air to 80% or more of exhaust air. By designing make-up to be less than exhaust air, air flow will generally go from dining area to kitchen area. In order to achieve positive pressure in the building, one air conditioner could be the designated as the "outdoor air unit". A 10-ton unit with 35% outdoor air, for example, could provide about 1400 cfm into the building. It could be designed to operate at a lower setpoint (first stage on a two-stage thermostat) than the other air conditioners so that its compressor would run nearly all the time, distribute supply air to the entire dining room area (and perhaps some to the kitchen area as well), and have its air handler run whenever the exhaust fans are on (interlocked controls). Providing all (or most) of the building outdoor air to the dining area will enhance the flow of air from the dining area toward the kitchen area, thus maintaining control of kitchen odors. By operating at a lower setpoint, its compressor will run nearly the entire day and consequently it will have good dehumidification performance.
If improved exhaust, make-up air, and outdoor air designs are used and filters are properly maintained, then the pressure imbalance problems which are creating many energy, indoor air quality, building degradation, and combustion safety problems can be resolved.
Conclusions
Field testing found that uncontrolled air flows and building depressurization are widespread in a sample of eight Florida commercial buildings. While it is desirable to operate buildings at positive pressure (wrt outdoors) in hot and humid climates such as Florida, these eight buildings experienced substantial depressurization under normal operation. In seven of the eight cases, the entire building was depressurized; pressures averaged -0.051 inWC (-12.7 Pa) and ranged from -0.003 inWC (-0.8 Pa) to -0.173 inWC (-43 Pa). In the remaining building (a university sports facility), about 60% of the building was pressurized and 40% was depressurized; this pressure imbalance resulting from return air design problems. The degree of depressurization depends upon the building (or zone) air flow balance (air flow out of the building minus air flow into the building) and the airtightness of the building envelope. In tight buildings, only a small imbalance of air flow can produce serious depressurization problems. In very leaky buildings, large air flow imbalances may produce only moderate depressurization.
Depressurization caused a number of problems in these buildings. These problems include high humidity levels, mold and mildew growth on wall surfaces and in building cavities, moisture damage to building materials, extinguished pilot lights, combustion equipment backdrafting, flame roll-out, sewer gas entering the building, and doors being difficult to open. Although not extensively discussed in this paper, depressurization and uncontrolled air flow often cause increased heating and cooling energy use and comfort problems.
The most frequent cause of uncontrolled air flow and depressurization is poor engineering. In nearly all these buildings exhaust fans are too large or the make-up air and outdoor air are too small. In two cases there is no mechanical make-up air or outdoor air, so the buildings operate at substantial negative pressure when the exhaust fans operate. In other cases the outdoor air cycles on and off because the air conditioners cycle on and off in response to load. Consequently, building pressure fluctuates up and down depending upon the number of units operating.
Return air design has also been identified as a cause of zone depressurization. In one of the sports facilities, the ceiling space (the space between the t-bar ceiling and the insulated roof deck) was used as a return plenum for one of the air handlers which served areas on both sides of a fire wall. The return air cross-over window through the fire wall was undersized, causing one zone to be pressurized and the other zone to be depressurized. This pressure imbalance contributed to drawing of excessive amounts of humid air into the building from outdoors and the mold and mildew problems which ensued.
Design solutions in hot and humid climates must take into account humidity control requirements of the air conditioning systems, which can be substantial in restaurants because of their extensive exhaust air requirements. In many cases, pretreatment of outdoor or make-up air is recommended.
Two solutions are suggested in restaurants to ensure that outdoor air operates all (or at least most) of the time. One is installation of two-stage, face-split-coil design air conditioners which achieve improved dehumidification. A second solution is to have one air conditioner provide all of the outdoor air. By having it operate whenever the exhaust fans are engaged and be controlled on the first stage of a two-stage thermostat, its compressor would operate most of the time and thus dehumidify well even though the air handler would run continuously.
In one restaurant, maintenance of filters was identified as the cause of major pressure imbalance. As make-up air and outdoor air filters became increasingly dirty, air flow into the building decreased and the building became increasingly depressurized. Note that this building was very airtight, and this airtightness caused the air flow imbalance to rapidly become a serious pressure imbalance. The solution to this problem is education of the building occupants, improved maintenance procedures, and perhaps warning systems that indicate pressure imbalance problems.
An additional conclusion may be drawn from this research. Diagnostic procedures and testing methods used to characterize building airtightness, duct system airtightness, air flow rates, infiltration/ventilation rates, and pressure differentials can be very effective in identifying the nature and cause of uncontrolled air flows in commercial buildings which in turn provides the basis for remediation of the problems. Without a good understanding of the interacting relationships between airtightness, air flows, and pressure differentials, and the ability to measure these variables, the likelihood of incorrect identification of the problems and ineffective solutions is greatly increased.
Acknowledgements
Funding for study of uncontrolled air flow in 68 commercial buildings, including the eight covered in this paper, was provided by the Florida Energy Office. Thanks to John Toth for considerable testing and organization for this project and to Don Shirey for review of sections related to optimizing HVAC control for improved dehumidification performance.
Definitions
air barrier building shell components providing primary resistance to air flow between outdoors to indoors.
backdrafting a condition that may develop where air flow is reversed in the vent pipe of a combustion appliance. During this condition, the combustion by-products from the combustion appliance cannot pass through the vent pipe and leave the building.
capture tent an enclosed space, often constructed using a frame and airtight sheeting material, which may be used as a pressure equalization chamber. Air flow is measured by placing the tent over an air discharge or intake opening, installing a calibrated fan into a wall of the tent, and bringing the tent to neutral pressure wrt its surroundings. Air flow through the discharge or intake opening is equal to the calibrated fan flow.
ceiling space the space located between the ceiling and the exterior roof decking.
duct tester a device used to perform air distribution system airtightness testing, consisting of a calibrated fan, gauges for measuring duct system pressure, gauges for measuring the calibrated fan air flow rate, and means to attach the calibrated fan to the duct system.
flame roll-out a condition where combustion occurs outside the combustion appliance combustion chamber.
indoors locations that are inside the primary air barrier of the building, including spaces within the building structure which are not conditioned but are located within the primary air barrier of the building, such as unvented ceiling spaces, wall cavities, spaces between floors, chases, storage closets, and mechanical rooms.
make-up air air mechanically blown into the building simultaneously with the operation of exhaust fans in order to make up for exhaust air drawn from the building. Make-up air is intended to avoid excessive depressurization of the building, reduce building infiltration, and save heating and cooling energy.
outdoors locations outside the building air barrier, including space that is completely outside of the building structure and spaces within the building structure which are intentionally or unintentionally ventilated to outdoors such as attic spaces, ceiling spaces, wall cavities, spaces between floors, chases, mechanical rooms, attached garages, and crawl spaces.
outdoor air an opening on the return side of an air distribution system which permits ventilation air to be drawn into (or in some cases forced into) the return air stream from outdoors.
thermal barrier building components providing primary resistance to heat flow between outdoors and indoors.
uncontrolled air flow air moving between indoors and outdoors or between zones of a building where the pathways of flow, the direction of flow, and the origin of the air is unknown, unspecified, and unintentional.
vent pipe a pipe through which combustion by-products leave the building.
References
American Society for Testing and Materials (ASTM). 1987. Standard test method for determining air leakage rate by fan pressurization. ASTM Standard E779-87.
American Society for Testing and Materials (ASTM). 1983. Standard test method for determining air leakage rate by tracer dilution. ASTM Standard E741-83.
Cromer, C.J., and J.B. Cummings. 1987. Field data delivery, thermal performance field monitoring of various conservation construction techniques. FSEC-CR-172-87. Florida Solar Energy Center, Cape Canaveral, FL.
Cummings, J.B. 1988. Central air conditioner impact upon infiltration rates in Florida homes. Proceedings of American Solar Energy Society 13th National Passive Solar Conference. Cambridge, MA.
Cummings, J.B., and J.J.Tooley. 1989. Infiltration and pressure differences induced by forced air systems in Florida residences. ASHRAE Transactions Vol.95, Part 2.
Cummings, J.B., and J.J.Tooley, J.J. June, 1989. Infiltration rates and pressure differences in Florida homes caused by closed interior doors when the central air handler is on. Proceedings of American Solar Energy Society 14th National Passive Solar Conference. Denver, CO.
Cummings, J.B., J.J. Tooley, N.A. Moyer, and R. Dunsmore. 1990. Impacts of duct leakage on infiltration rates, space conditioning energy use, and peak electrical demand in Florida homes. Proceedings of the ACEEE 1990 Summer Study. Pacific Grove, CA.
Cummings, J.B., J.J.Tooley, and N. Moyer. 1990. Recommended Florida radon building code -- HVAC section. FSEC-CR-332-90. Florida Solar Energy Center, Cape Canaveral, FL.
Davis, Bruce E. 1991. The impact of air distribution system leakage on heating energy consumption in Arkansas homes. Report submitted to the Arkansas Energy Office.
Gammage, R.B., A.R. Hawthorne, and D.A. White. 1984. Parameters affecting air infiltration and airtightness in thirty-one east Tennessee homes. Measured Air Leakage of Buildings. Philadelphia: ASTM.
Grieve, P.W. 1991. Measuring ventilation using tracer-gases. Bruel & Kjaer, BR 0608-12.
Kao, J.Y., D.B. Ward, and G.E. Kelly. 1988. Flame roll-out Study for gas fired water heaters. NBSIR 88-3724. National Bureau of Standards, Gaithersburg, MD.
Khattar, M.K., M.V. Swami, and N. Ramanan. 1987. Another aspect of duty cycling: effects on indoor humidity. FSEC-PF-118-87. Florida Solar Energy Center, Cape Canaveral, FL.
Lambert, L.A. and D.H. Robison. 1989. Effects of ducted forced-air heating systems on residential air leakage and heating energy use. ASHRAE Transactions Vol. 95, Pt. 2.
Lstiburek, J.W., and John Carmody. 1991. Moisture Control Handbook, ORNL/Sub/89-SD350/1, Oak Ridge National Laboratory, Oak Ridge, TN.
Modera, M.P. 1990. Residential duct system leakage; magnitude, impacts, and potential for reduction. ASHRAE Transactions. Vol.95, Part 2.
Modera, M.P., Darryl Dickerhoff, Richard Jansky, and Brian Smith, 1992. Improving the efficiency of residential air-distribution systems in California, Phase I. Research Report Series 5, California Institute for Energy Efficiency.
Moffatt, Sebastian. 1988. Backdrafting woes. Progressive Builder.
Offerman, F.J., J.B. Dickinson, W.J. Fisk, D.T. Grimsrud, C.D. Hollowell, D.L. Krinkel, G.D. Roseme, R.M. Desmond, J.A. DeFrees, and M.C. Lints. 1982. Residential air-leakage and indoor air quality in Rochester, NY. LBL-13100. Lawrence Berkeley Laboratory, Berkeley, CA.
Orlando, J.A., M.G. Gamze, N. Malik, R. Crews, G. Michaels, and J. Christie. 1980. Analysis of residential duct losses. PB80-228000. Gas Research Institute, Chicago, IL.
Palmiter, L., and T. Bond, 1990. Modeled and measured infiltration; A detailed case study of four electrically heated homes. Prepared for Electric Power Research Institute Under Contract RP 2034-40.
Parker, Danny. 1991. Monitored energy use characteristics of a Florida residence. FSEC-RR-23-91. Florida Solar Energy Center, Cape Canaveral, FL.
Parker, D.S. 1989. Evidence of increased levels of space heat consumption and air leakage associated with forced air heating systems in houses in the Pacific Northwest. ASHRAE Transactions. Vol. 95, Pt.2.
Parker, Danny, Philip Fairey, and Lixing Gu. 1993. Simulation of the effects of duct leakage and heat transfer on residential space cooling energy use. Energy and Buildings.
Proctor, J., B. Davids, F. Jablonski, and G. Peterson. 1990. Pacific Gas and Electric Heat Pump Efficiency and Super Weatherization Pilot Project. Building Resources Management Company.
Proctor, J., 1990. PG&E Appliance Doctor Pilot Project. Proctor Engineering Group, San Francisco, CA.
Robison, D.H. and L.A. Lambert. 1989. Field investigation of residential infiltration and heating duct leakage. ASHRAE Transactions. Vol. 95, Pt. 2.
Sheet Metal and Air Conditioning Contractors National Association, Inc (SMACNA)., 1985. HVAC Air Duct Leakage Test Manual, 1st Edition.
Tooley, J.J., and N. Moyer. 1989. Mechanical air distribution and interacting relationships. Presented at Symposium on Improving Building Systems in Hot and Humid Climates. Dallas, TX.
Tooley, J.J., J.B. Cummings, and N.A. Moyer. 1991. Pressure differential, the measurement of a new decade. Presented at the 9th Annual International Energy Efficient Building Conference and Exposition, Indianapolis, IN.
© 2007-2014 University of Central Florida. The Florida Solar Energy Center (FSEC)
is a research institute of the
University of Central Florida.
For more information about FSEC, please contact us or learn more about us.
Find us on Facebook!