

Reference Publication: Beal, D., Chandra, S., "The Measured Summer Performance of Tile Roof Systems and Attic Ventilation Strategies in Hot, Humid Climates", Proceedings of the Thermal Performance of the Exterior Envelopes of Buildings VI, Oak Ridge National Laboratory/U.S. Department of Energy, December 4-8 1995, Clearwater, FL. Disclaimer: The views and opinions expressed in this article are solely those of the authors and are not intended to represent the views and opinions of the Florida Solar Energy Center. |
The
Measured Summer Performance of Tile Roof Systems
and
Attic Ventilation
Strategies in Hot, Humid Climates
David
Beal and Subrato Chandra
Florida
Solar Energy Center (FSEC)
FSEC-PF-408-95
Abstract
During 1994, simultaneous full-scale testing of residential plywood-decked roofing system was conducted using a flexible roof facility (FRF). The facility consists of a 24-ft by 48ft rectangular building with one large conditioned space under an attic that is partitioned into six separate test cells. Throughout the test protocol one cell was configured as a residential black-shingle roof system, employed as the baseline for comparison of the alternative roofing systems.
Two identical cells were employed during the summer of 1994 to investigate soffit and ridge venting. Tests of two different configurations best illustrate the results. A comparison of a sealed attic to an attic with high-profile ridge-vent and well-vented soffits (1 ft2 of soffit/50 ft2 of attic floor) showed that the vented attic reduced the ceiling heat flux by 66%. Also, a comparison of the well-vented attic (1 ft2 of soffit/50 ft2 of attic floor) to an attic with a perforated soffit (1 ft2 of soffit/230 ft2 of attic floor) showed 25% less ceiling heat flux through the well-vented attic. The effects of ridge venting (on this roof with a simple geometry) seem to be nominal when compared to the effect of soffit venting, causing, at best, a 4% heat flux difference.
A simultaneous study was carried out to determine the thermal effects of tile roofing systems. Also investigated was the effect of venting on tile roofs. A tile roof was installed on cell 1 on August 27, 1993. This roof was built to maximize under-tile ventilation and ridge ventilation. It featured a counter-batten installation modified to provide venting under the tile and out of the attic cavity. On September 1, 1994, a direct-nailed tile roof was installed on cell 4. The vented tile roof reduced ceiling flux by 48% compared to the black-shingle roof, whit the direct-nail installment returned a flux reduction of 39%. It appears that the tile thermal mass and interstitial ventilation around each tile are the predominant phenomena reducing the cooling load in such roofs.
Introduction
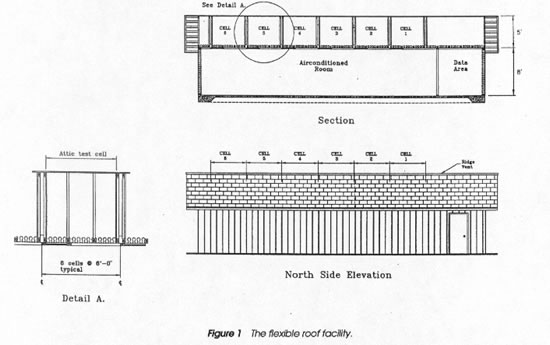
During 1994, tests were conducted on several residential plywood-decked roofing systems. The experiments were conducted at a flexible roof testing facility (FRF) located in Cocoa, Fla., 10 miles west of the ocean on the main Florida peninsula. The site is not coastal and does not have high winds. The FRF comprises a 24-ft by 48 ft building with the long axis oriented east-west (Figure 1). The roof and attic of the building are partitioned to allow multiple roof configurations to be tested simultaneously. The orientation of the building provides a northern and southern exposure of the different roofing products under test. The attic is sectioned into six individual test bays (detail A, Figure 1) spanning three 2-ft trusses, or 6 ft, separated by insulated partition walls. R-19 batt ceiling insulation was installed between the trusses in all attic test sections. All insulation was installed at the same time in 1987 and comes from the same manufacturer. The interior of the FRF is a single, open, conditioned space. The roof lends itself easily to being reconfigured with different roofing products, such as tile, shingles, roll roofing, metal roofing, and different ridge-vent configurations. A black-shingle roof was available as a baseline comparison for all tests. Instrumentation consisted of temperature probes in the attic, on the roof, and on the drywall under the attic, as well as an on-site meteorological station that continuously recorded weather conditions during all tests.
Attic ventilation was investigated in two similar black-shingle roof test cells. One cell was configured with low-profile ridge vent and perforated soffit vent, The second test cell employed variations of perforated, open, and closed soffits with low-profile, high profile, and no-ridge vents.
Investigations into the performance of different tile attachment techniques were carried out. Direct-nailed installation was compared to a counter-batten installation of red, concrete, S-shaped tiles. Also investigated were the effects of under-tile ventilation on a tile roof installation.
A literature review was conducted. Research on attic ventilation has been carried out extensively in cold climates. A Canadian company has funded research (Forest and Walker 1993b; Saxhof 1996). New York State has done similar work (NYSERDA 1993). It is the conclusion of these researchers that attic ventilation is necessary in cold climates to stop condensation on interior-generated moisture from forming on cold attic surfaces. The New York study recommended sealing air leakage paths between the house and the attic.
There are few references to the thermal performance of attic ventilation. One study carried out in Brazil (Fanger 1985) concluded that although increasing the R-value of the attic insulation was the most effective way to reduce ceiling heat flux, it cost much more thatn increasing attic ventilation. The report concluded that attic ventilation was of great importance in low-cost housing projects and should be optimized.
Sevearl older American studies (Burch and Harrje 1984; Ford 1982) have concluded that the wood in a typical residential attic can absorb and desorb a significant amount of moisture. A seasonal cycle was identified, as well as a daily cycle. The wood reached a moisture content of 20% in a ventilated attic during cold, cloudy winter conditions. A moisture content of more than 30% was deemed necessary to cause mold growth.
Wetherington (1979) reported that attic temperatures in Florida were cooler in tile roofs than asphalt shingle roofs. He also reported that sealing the attic of a house without a ceiling vapor barrier resulted in lower average attic temperatures and humidities inside the house. Perhaps this house also had a leaky air distribution system in the attic.
Procedure
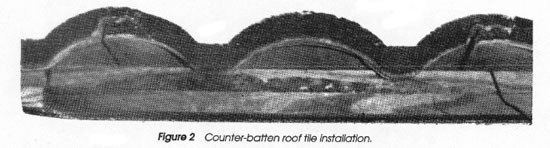
Initially, the FRF was configured with two white-shingle roofs and four black-shingle roofs. On August 27, 1993, cell 1, a white-shingle roof, was replaced with a counter-batten, red, S-shaped concrete barrel tile (Figure 2). Cells 4 and 5 had black shingles. During the summer of 1994 these two cells were employed in an attic ventilation study. On September 4, 1994, at the end of the ventilation study, cell 4 had direct-nailed, red, S-shaped concrete barrel tile (the same as employed on cell1) installed.
Attic Ventilation
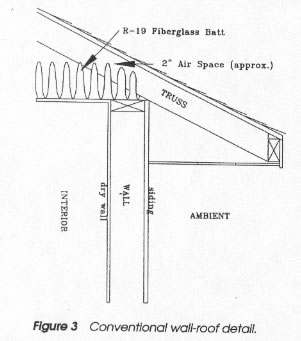
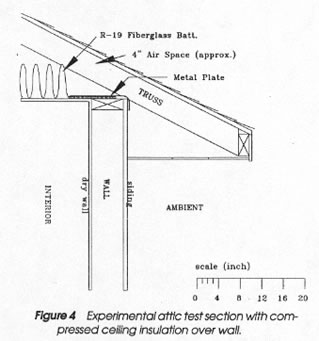
Details in soffit venting vary from building to building. Many buildings are built with little provision for soffit-vent air to get into the attic air space. There often is a restriction between the wall top plate and the roof decking (Figure 3). This area often is stuffed with insulation by insulation contractors. The aperture between the roof decking and the exterior wall of the FRF building is little more that the width of a 2 by 4 (Figure 3). This is fairly common practice with truss-built houses. In the FRF’s situation there was a gap of 1 to 2 inc. between the fiberglass and the roof decking. This aperture is the only path for vent air to enter the attic. To facilitate maximum ventilation, the fiberglass was forced flat to the ceiling, as compressed as possible, by a sheet-metal plate (Figure 4), thus opening the aperture up to a full 3+ in. (Figure 4). Originally, before squashing the insulation, the aperture was 130 in.2 for each side of each cell. After flattening, the aperture was 210 in.2, a 62% increase. Note that this compromises the effectiveness of ceiling insulation near the walls. The intent here was not to recommend this practice but to obtain enhanced attic ventilation for experimental purposes. In practice, a raised-heel truss system is recommended to obtain high attic ventilation rates without compromising the ceiling insulation effectiveness. In light of standard building practices the FRF was configured with a vinyl, continuous-perforated soffit with a perforation ratio of less than 4%, or approximately 6 in.2 of opening per ft2 of soffit, yielding 45 in.2 of soffit vent per side of the cells. The area of the attic floor is approximately 140 ft2. When perforated soffit is installed on the test cell there is a ratio of 1 ft2 of soffit per 233 fft2 of attic floor.
Ridge-venting’s role in the thermal performance of an attic in a southern climate is not well understood. In northern climates it is needed in the winter to prevent condensation in attic.
The summer of 1994 was employed to test attic ventilations strategies. For continuity, cell 5 was used as a reference and was configured with a low-profile ridge vent and perforated vinyl soffit vent.
A final ventilation experiment was initiated on August 22 by configuring cell 5 with a high-profile ridge vent and open soffits. Table 1 provides the experimental schedule.
Three different soffit vent configurations were employed: no soffit, accomplished by removing the perforated soffit, resulting in 210 in.2 of soffit venting per side; perforated soffit, yielding 45 in.2 of soffit venting per side of the attic; and closed soffits, with no vent area per side. Three different ridge vents were employed: low-profile ridge vent with shingles installed over the ridge vent, metal high-profile ridge vent, and a closed ridge vent.
Many building codes state a minimum ventilation area based on the square footage of the attic floor. This is most often 1ft2 of soffit vent per 300 ft2 of attic with ridge venting, or per 150 ft2 without ridge venting. The area of the test cell’s attic floor was 23 ft by 6 ft, or approximately 140 ft2. By code, installed in conjunction with a ridge vent, the test cell would require 0.46 ft2 of soffit vent. Perforated soffit yielded approximately 0.6 ft2 of vent area. Open soffits yielded 2.9 ft2 of vent area. Perforated soffits in this installation would comply with building codes, and open soffits provide six times as much vent as specified by code, or 1 ft2 of soffit vent per 50 ft2 of attic floor.
Tile Roof Systems
Tile roof systems are a popular roofing system in southern climates. Their looks and durability have provided tile with wide acceptance. However, their thermal attributes are not well documented. To address this, in August 1993 a counter-batten rile roof employing red, concrete, S-shaped tiles was built (Figure 2). Counter-battens consist of two batten (or furring) strips attached to the decking, with the tiles nailed to the batten strips. The two batten strips are run perpendicular to each other, with the top strip applied so the tile nail line will fall on top of it. Further efforts to improve this roof system’s heat rejection ability also were included.
Table 1. Experimental
Schedule |
||||
Cell 4 |
Cell 5 |
|||
Date |
Ridge Vent |
Soffit Vent |
Ridge Vent |
Soffit Vent |
| June 13 - June 23 |
high profile |
open |
low profile |
perforated |
| June 24 - July 13 |
high profile |
perforated |
low profile |
perforated |
| July 14 - August 3 |
closed |
perforated |
low profile |
perforated |
| August 4 - August 21 |
closed |
closed |
low profile |
perforated |
| August 22 - August 31 |
closed |
closed |
high profile |
open |
The counter-batten tile roof was built to allow ventilation under the tile and over the roof decking. Normal building procedure is to seal the cap tiles to the ridge of the tile roof with a concrete “mud.” The bottom of the tile run, at the drip edge, is commonly closed with an insect stop or other solid restriction. In this installation, an attempt was made to maximize the vent potential between the tile and the decking. The tile was installed with a counter-(double) batten strip, as opposed to a single batten. This elevated the tiles and additional ¾-in., for a total of 1.5 in. No sealing was attempted at the drip edge, allowing an inlet for ventilation air under the tile. The ridge cap was affixed by adhesive caulk and no mud was applied to seal the ridge cap down, allowing ridge venting. The decking had previously been cut to all the mounting of a ridge vent. There is a 3.5-in.-wide gap where the ridge vent was installed. This gap was not sealed when the roof was tiled, allowing attic venting under the tile ridge cap.
The counter-batten tile installation can compromise wind resistance of the roofing tiles and is not recommended without consulting the manufacturer. The purpose of this test geometry was to obtain maximum cooling load reduction.
The performance of the counter-batten installation also was compared to a conventional tile roof. Cell 4 was configured with a direct-nailed tile roof in September 1994, with a mudded ridge cap and insect stops at the bottom course. The area in the plywood decking cut to allow ridge venting of the attic was sealed with wood and tar paper. Tile identical to the tile used on cell 1 was employed. There is an underlayment, and the tile line where the nails are run often is cemented or glued.
Results
The primary interest of this research was to examine the reduction in summer heat flux through the R-19 insulated ceiling as a result of the various attic ventilation and tile roof strategies. The temperature difference, ΔT, between the insulation top surface thermocouple and the ceiling bottom thermocouple is proportional to the ceiling heat flux. Tow sets of thermocouple trees were placed in each cell centered over the north and south sides of each test cell. All data presented here represents the center of the south side of the attic, the hotter side. The data for the north side of the arric are not presented but they are qualitatively similar. All results presented in this paper are from data collected during the summer of 1994.
Because all ΔT data are presented in a comparative way, it is believed that they may be representative of the main body of the attic, excluding edge effects. Considerable care was taken in placing the insulation top thermocouples. The insulation at each location was fluffed by hand to be exactly the same thickness in each test section.
Earlier tests during 1991-1993 showed that the different test cells indeed behaved in a nearly identical manner when the test cell geometries were identical.
In addition, to check the validity of these insulation top-surface thermocouple readings, a separate probe was attached to a solid rod and inserted to a precise depth inside the insulation in several test cells. The ΔTs from these buried thermocouples exhibited a 1 to 1 correspondence to the ΔT from the insulation top thermocouple. As a result, the data from the buried thermocouples are not presented here.
Thermal results are presented in two graphic formats. Four components of the roof system are presented in this analysis: the roof’s upper surface facing the sun, the bottom of the roof facing the insulation, the surface of the insulation facing the roof, and the surface of the drywall facing the interior of the building. The roof and ceiling components can be paired together and examined as temperature differences or ΔTs across the roof or ceiling.
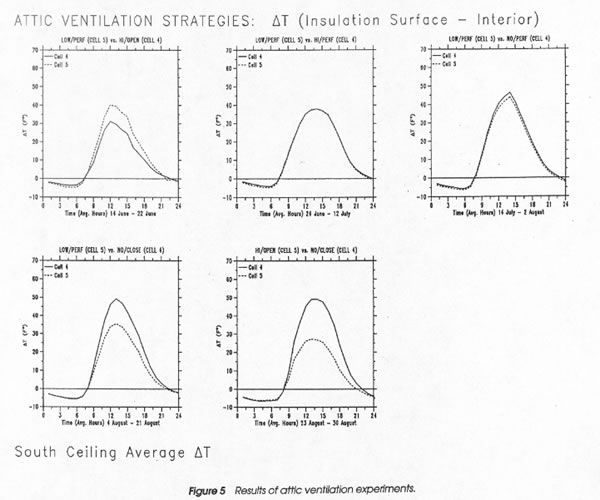
Two graphical formats are employed to illustrate the results: graphs with the average hourly data plotted with reference to time and plots of a linear regression of the difference between the various ΔTs. An example of the hourly average format si found in Figure 5. All data plotted in these graphs are the results of summations of all the data with respect to time. (For instance, sum measurements for 1 a.m., then divide by the number of measurements.)
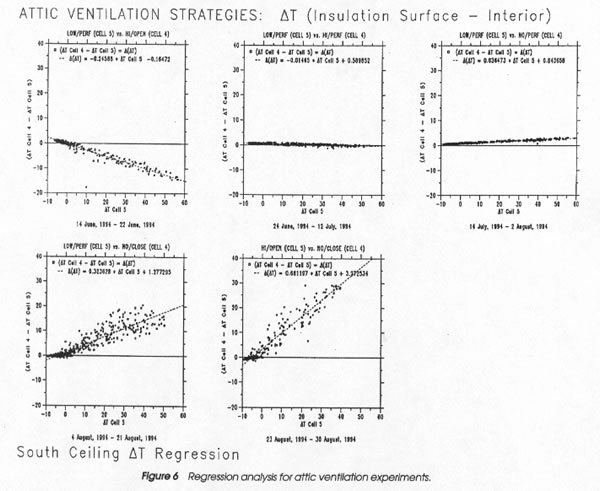
An example of linear regression plots is found in Figure 6. On plots of this style the X-axis represents the ΔT of the reference roof (usually a black-shingle roof). The y-axis values are ΔT differences (Δ(ΔT)) found by subtracting the ΔT of the reference room from thte ΔT of the roof system being compared. In Figure 6, Δ(ΔT) is found by subtracting the ΔT of cell 5 from the ΔT of cell 4 (ΔT cell 4 – ΔT cell 5). The points on the graph represent the Δ(ΔT) at a particular ΔT of the reference roof. If these values are subjected to a linear fit, the results represent the fractional (0 to 1) heat flux reduction through the ceiling, with an offset. The resulting linear fit is represented by the dashed line through the points. The equation generated by the fit is shown at the top of the graph. The multiplier of the equation can be though of as a percentage of heat flux change, with negative numbers a flux reduction and positive numbers a flux increase in comparison to the reference roof. Offsets skew the results; larger offsets reduce the accuracy of the actual percentage of flux change.
Attic Ventilation
The south ceiling heat flux results of this testing are illustrated by Figure 5 and 6. The ventilation configurations under test are found at the top of each individual graph. The time frame of the test is found on the X-axis of the graphs. Figure 5 shows the time-averaged ceiling ΔTs (insulation surface – interior drywall) of the two test cells. Figure 6 illustrates a linear regression of the difference of the ceiling ΔTs (cell 4 – cell 5) compared to the ΔT of cell 5 (reference). These regressions show the change in ceiling heat flux and are given in Table 2.
Table 2. Experimental
Schedule and Results |
|||||
Cell 4 |
Cell 5 |
||||
Date |
Ridge Vent |
Soffit Vent |
Ridge Vent |
Soffit Vent |
Δ(ΔT) |
| June 13 - June 23 |
high profile |
open |
low profile |
perforated |
-25% |
| June 24 - July 13 |
high profile |
perforated |
low profile |
perforated |
-01% |
| July 14 - August 3 |
closed |
perforated |
low profile |
perforated |
+03% |
| August 4 - August 21 |
closed |
closed |
low profile |
perforated |
+32% |
| August 22 - August 31 |
closed |
closed |
high profile |
open |
+66% |
Tile Roof Systems
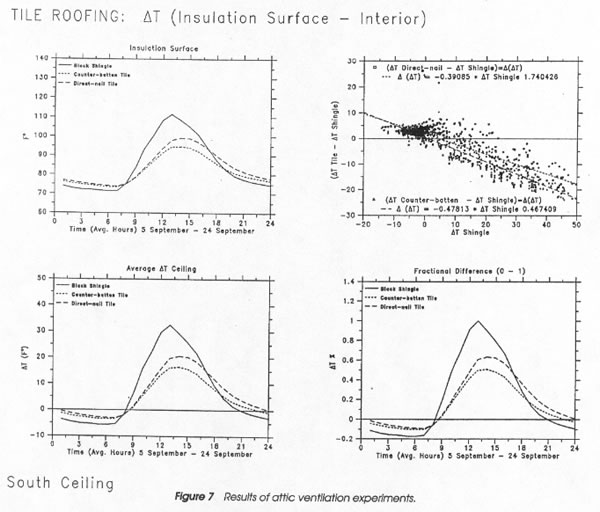
The performance of the tile roofs is illustrated by Figure 7. There are four graphs in Figure 7. The reference black-shingle roof is employed to compare the two tile roof installations. The graph in the upper left corner of Figure 7 illustrated the time-averaged insulation top surface temperature of the three cells.
The graph in the upper right-hand corner of Figure 7 charts the heat flux reduction (Δ(ΔT)) of the three roofing systems shown by a linear regression. The Δ(ΔT) of the two roofs (tile – black shingle) is plotted vs. the ΔT of the black-shingle roof. ΔTs are found by subtracting the interior drywall surface temperature from the insulation surface temperature. Both tile roof systems are employed in this comparison. The plot shows a 48% ceiling heat flux reduction returned by the counter-batten installation and a 39% reduction returned by the direct-nailed installation. The plots on the bottom of the graph show the time-averaged ΔTs across the ceilings of the test cells, both as a function of temperature and as a percent (o to 1). For an explanation of the graph format, please see the “Results” section.
The results returned by the counter-batten tile roof remained consistent throughout 1993 and 1994, with flux reductions of approximately 45% to 50%. The preliminary results from the direct-nailed installation are approximately 40%.
Conclusions
All alternate roof systems outperformed the black-shingle roof in terms of interior heat flux gains. The tile roofs reduced the heat flux dramatically: a 40% to 50% flux reduction for the two tile roofs. The ventilation study showed large flux reductions are available from ventilation.
Tile Roofing
There is a large reduction in ceiling heat fain delivered by a tile roof system. There are two features of the barrel tile roof system that contribute to tile’s excellent thermal performance. Once, the tile has a large thermal mass, and the temperature on the back of the tile stays quite low.
There is also an air space under the tile from the tile’s barrel shape. The efforts made to improve the tile roof’s ability to vent enhanced the performance of a tile system from 39% flux reduction to a 48% flux reduction. To resolve the issue of the effect of the air space under the barrel tiles, further tile roof comparisons employing a direct-nail flat tile roof are needed.
There is room for more research into the beneficial thermal effects of the tile roofing, but it is clear from this initial testing that the tile roofs can provide significant energy savings through reduction of cooling loads. It also appears that the standard tile installation of barrel-shaped tiles provides such a significant savings that the additional expense of a counter-batten tile installation may not be cost effective.
Attic Ventilation
Attic ventilation rates appear to play a key role in ceiling heat flux. Merely increasing the attic ventilation caused the well-ventilated attic to outperform the reference attic by 25%. The performance difference between the well-ventilated attic and the closed attic was the largest observed ruing the testing (66%). These results imply significant energy savings possible from simply retrofit options.
The vent area yielded by the perforated soffit was sufficient to meet building code. This testing appears to indicate that venting at rates greater than that specified by code (1 ft2 or vent area per 300 ft2 of attic floor) can provide significant increases in venting effectiveness.
This investigation did not examine the moisture side of the vented attic question. There is a sentiment in the building science community for sealing attics totally. The object of blocking the ventilation is to exclude ambient moisture from the attic. Several problems are attributed to attic ventilation. Condensation problems in attics have been reported to the authors in humid southern climates. High interior moisture levels have been reported, which abate when attic ventilation is curtailed.
If attic air temperature is elevated, it holds more moisture. The dew point in attics can be elevated 10 degrees Fahrenheit or more above ambient on a summer afternoon (Fairey et al. 1988). Any surfaces that are below this temperature will condense. This elevation of dew point can drive moisture into the conditioned space by vapor pressure differences.
In light of common building practices these issues can be a problem. Many houses are built without vapor retarders in the ceiling. Even when retarders have been installed there are many pathways on which moisture can travel. Most houses have several penetrations into the veiling for wiring and plumbing. Standard construction leaves the joint between the ceiling and wall leaky. Poorly constructed, leaky duct systems in the attic will cause surfaces adjacent to them to be at temperatures low enough to condense. Leaky duct systems will cause increased infiltration of humid attic air into the conditioned space.
Buildings near large bodies of water, especially salt water, have reported attic ventilation-related problems. The salt content of the ventilation air can foster corrosion on such things as truss plates and hurricane clips. These problems may be reduced by large ventilation rates, which tend to reduce the temperature in the attic, curtailing the amount of moisture that the air can hold.
However, attics containing poorly installed and maintained air distribution systems and many leakage paths between the attics and the conditioned space might not benefit from increased attic ventilation.
Acknowledgements
This research was conducted under the auspices of the Energy Efficient Industrialized Housing Research Program, sponsored by the Office of Building Technologies, Conservation and Renewable Energy, U.S. Department of Energy, Mr. George James, program manager. The research program is a joint effort of the Center for Housing Innovation at the University of Oregon, and the University of Central Florida’s Florida Solar Energy Center and the Department of Industrial Engineering and Management Systems.
The authors appreciate the comments of the ASHRAE external reviewers. The comments have significantly enhanced the paper.
References
Burch, D.M., and D.T. Harrje. 1984. A State-of-the-art research assessment for residential attic condensation. Moisture Control in Buildings, pp. 21-29. Washington, D.C.: Building Thermal Envelope Coordinating Council.
Fairey, P., M. Swami, and D. Beal. 1988. RBS technology: Task 3 report. FSEC-CR-211-88. Cape Canaveral, Fla.: Florida Solar Energy Center.
Fanger. P.O., ed. 1985. Importance of attic ventilation. Proceedings of the World Congress on Heating, Ventilating and Air Conditioning Conference, Copenhagen, Denmark.
Ford, J.K. 1982. Heat flow and moisture dynamics in a residential attic. Princeton, N.J.: Princeton University
Forest, T.W., and I.S. Walker. 1993a. Attic ventilation and moisture: Final report. MIC-94-01171/AXB. Ottawa, Ont., Canada: Canada Mortgage and Housing Corp.
Forest, T.W., and I.S. Walker. 1993b. Moisture dynamics in residential attics. Proceedings of the 14 th Canadian Congress of Applied Mechanics, Kingston, Canada.
NYSERDA. 1993. Attic ventilation and air sealing: A technical review of the issues. NYSERDA-93-11. Albany, N.Y.: New York State Energy Research and Development Authority.
Saxhof, F., ed. 1993. Building physics in the Nordic countries. Proceedings of Building Physics ’93, Symposium on Building Physics in the Nordic Countries, Copenhagen, Denmark.
Wetherington, T.I., Jr. 1979. Measure of attic temperatures in Florida. Proceedings, Workshop on Summer Attic and Whole House Ventilation, July 13, 1978, National Bureau of Standards, Mary H. Reppert, ed.
© 2007-2014 University of Central Florida. The Florida Solar Energy Center (FSEC)
is a research institute of the
University of Central Florida.
For more information about FSEC, please contact us or learn more about us.
Find us on Facebook!