

Reference Publication: Anello, M T, D S Parker, J R Sherwin, and K Richards (2001). Measured impact of advanced windows on cooling energy use. FSEC-PF364-01. Florida Solar Energy Center, Cocoa, Florida. Disclaimer: The views and opinions expressed in this article are solely those of the authors and are not intended to represent the views and opinions of the Florida Solar Energy Center. |
Measured Impact of Advanced Windows on Cooling Energy Use
Michael T. Anello, Danny S. Parker, John R. Sherwin, and Katie Richards
Florida
Solar Energy Center (FSEC)
FSEC-PF-364-01
Abstract
A
significant portion of Florida’s residential building
stock consists of single-family homes with clear, single-pane,
aluminum frame windows. Such windows can lead to considerable
heat gain during the hot Florida summer. A side-by-side
field test in two identical homes was conducted to evaluate
the impact of high performance windows on space cooling
demand under realistic conditions.
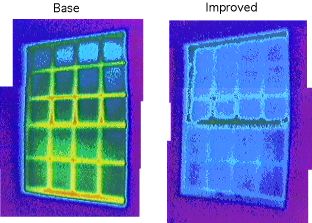
Summer afternoon infrared thermographs. Left is the standard
single glaze windows with aluminum frames;
Right is the
advanced solar control windows in the experimental home.
Background
A significant portion of Florida’s residential building stock consists of single-family homes with clear, single-pane, aluminum frame windows. Such windows can lead to considerable heat gain and elevated cooling use during the hot Florida summer (Vieira, 1986; 1987). Cooling energy use is a strong function of the solar heat transmittance of the glass. Also, in the mild Florida winter, the high U-value of clear, single-pane windows can lead to increased heating use. In the past, most evaluations of high performance windows have been done with simulation analysis (Parker, 1989; Lee et al, 1994; Reilly and Hawthorne, 1998). However, little empirical evaluation has been conducted. Previous simulation analyses have shown that 20-30% of cooling loads in single-family Florida homes are due to windows.
Within the project, a detailed study compared single-pane windows in a side-by-side field test with double-pane, spectrally selective, thermally-broken windows. Two identical 2,122 square-foot houses were constructed in the same neighborhood, one with the standard single-pane windows, and one with the advanced spectrally selective windows.
The
advanced windows are more energy efficient that than the
standard windows for several reasons. First, the second
pane of glass and the thermally-broken alumnium frame in
the advanced windows provide added insulation from hot
outdoor temperatures during the summer. The spectrally
selective nature of the glass in the advanced windows allows
nearly as much visible light through as the standard windows,
but allows dramatically less transmitted ultraviolet and
infrared heat (Lee et al, 1999).
Research
Description
The Florida Solar Energy Center worked with Mercedes Homes in selecting two homes in a new development in the Melbourne, Florida area that were suitable for this project. Construction on the two homes began shortly after the project was initiated, the houses were located on the same street (approximately 300 yards from one another) with the same orientation, floor plan, and exterior color. Landscaping and shading were also very similar for the two houses.
PPG Industries Inc. of Pittsburgh, Pennsylvania provided the windows for the advanced house - aluminum frame, double-pane, thermally-broken windows with PPG Sungate 1000 Solar Control Low-E glass. The standard home was equipped with single-pane, clear, aluminum frame windows.
Each 2,122 square foot house had 265.1 square feet of glazing (see Table 1), with window locations being identical in both houses. In addition, each house had 4 bedrooms, a two-car garage, a family room, a kitchen, a living/dining room, and 2 bathrooms. The glass-to-floor-area ratio was 12.5% and the average roof overhang length was 12 inches. Figure 1 shows the exterior of the improved house.
Table 1. Window Areas in Two Test Homes.
Area (ft) |
|
East (4 units) |
119.5 |
West (4 units) |
62.9 |
North (3 units) |
69.6 |
South (1 unit) |
13.1 |
Total (12 units) |
265.1 |
Conditioned floor area |
2122.0 |
Glass-to-floor-area ratio |
0.125 (12.5%) |
Monitoring equipment was installed at each home during the construction phase during the summer of 1999. This side-by-side test required that both homes were as similar as possible, both in configuration and operation except for the windows. Electrical power use, interior and attic temperature, as well as meteorological data was collected at 15-minute intervals using identical data acquisition systems for each home.
Data was collected at the homes for a period of one year, including a 17-day period when both homes were unoccupied. During this period in September, 1999, the thermostats of both homes were set to maintain identical (within 0.5°F) interior temperatures in order to compare the cooling loads of the houses.
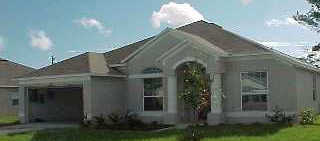
Figure 1. Improved House Exterior Showing West Exposure.
Site Audit
Detailed site audits were performed to insure that the buildings were identical in all components except for the windows. The overall air-tightness for both houses was very similar - the improved house has an ACH50 of 6.3, while the standard house has an ACH50 of 6.2. Duct leakage tests at the two houses revealed that the supply duct leakages for the two houses were different enough to warrant minor repairs. After the repairs, the supply duct leakages were tested again and found to be virtually identical.
HVAC systems at both homes were split systems with the air handler and return plenum box located in the unconditioned garage and have supply ductwork run through the attic space. The 4-ton outdoor units (International Comfort Products Corporation, model CH5548VKD1/YJ048GB1) had a rated load of 21.8 A And 230 V. The indoor units (International Comfort Products Corporation, model FCP/FCX 4200A,B/4800A,B) contained emergency strip heat (7.2 kW). An on-site evaluation of the AC systems revealed that cooling performance was very similar for both homes. Each of the units has an efficiency of SEER 10 Btu/W.
On both houses, insect screens were present on the lower half of all double-hung windows. Such screening can have significant impact on solar heat gain (Brunger et al, 1999). Both houses were of slab-on-grade construction, with concrete block walls (insulated to R-5 ft2·hr·°F/Btu on the interior - typical for Florida). The exterior walls were finished with stucco and painted a light tan color. The roof featured light-color (brown) asphalt shingles with R-19 insulation in the attic.
Each site has a significant amount of architectural shading on the east and west exposures from houses on immediately adjacent lots. Typical of suburbia, houses are separated by only 25 feet, which provides a significant amount of low sun angle shading.
The windows were the only aspect of the two houses that were purposely changed. Windows are known to be the largest source of cooling loads in Florida residential buildings (Parker and Vieira). A reduction in the window Solar Heat Gain Coefficient (SHGC) minimizes the solar heat gain, and a low conductance or U-factor (Btu/ft2·hr·°F) reduces the design cooling load. The most common windows used in Florida homes hardly meet these needs. Typically, windows are single pane clear glass with aluminum frames (without thermal breaks). These single pane clear glass windows were used in the standard home.
Figure 2. Spectral Response Curve Comparison.
For the improved home, we used PPG Industries' Sungate 1000 solar control, low-E glass product. Figure 2 is a comparison of the spectral response curves for both the improved and standard windows. As shown in Table 2 (PPG) below, the improved windows have a SHGC of only 0.36 and center-of-glass U-value of 0.34 Btu/ft2·hr·°F. We reduced heat transmission through the window frame by specifying white thermally broken vinyl frames (overall U-value: 0.48). The improved windows are spectrally selective, providing a daylight transmittance of 60% against 76% for single glazing as well as a color neutral appearance.
Table 2. Comparative Window Properties.
Standard |
Improved |
|
Ultraviolet Transmittance |
73% |
16% |
Visible Transmittance |
76% |
60% |
Total Solar Energy Transmittance |
83% |
35% |
Visible Light Reflectance |
9% |
12% |
Total Solar Energy Reflectance |
8% |
33% |
Winter Night Overall U-Value |
1.23 Btu/ft2·hr·°F |
0.47 Btu/ft2·hr·°F |
Summer Day Overall U-Value |
1.16 Btu/ft2·hr·°F |
0.49 Btu/ft2·hr·°F |
Shading Coefficient |
0.9 |
0.42 |
Solar Heat Gain Coefficient |
0.77 |
0.36 |
Winter Night Inside Surface Temp |
16.9 °F |
51.3 °F |
Summer Day Inside Surface Temp |
89.6 °F |
86.9 °F |
Center-of-Glass Winter Night U-Factor |
1.11 Btu/ft2·hr·°F |
0.33 Btu/ft2·hr·°F |
Center-of-Glass Summer Day U-Factor |
1.03 Btu/ft2·hr·°F |
0.35 Btu/ft2·hr·°F |
Center-of-Glass Solar Heat Gain Coefficient |
0.85 |
0.39 |
Thermal Imaging
Thermal imaging was used to examine qualitative impacts of the windows on heat gain to the interior. As expected, infrared photographs showed a noticeable decrease in the amount of heat entering the conditioned space for the improved house versus the standard one. The impact of thermally improved metal frames was also very evident. This is not surprising given the large calculated impacts of frame thermal conductance shown in previous simulation analyses (Wright, 1995).
In one example, an infrared photo taken of a west-facing window at 12:30 PM on an early fall day (ambient temperature was 85°F, interior temperature was 76°F) showed that the inside surface of the glass was approximately 8°F cooler for the improved windows versus the standard windows, while the inside surface of the thermally-broken frame was approximately 12°F cooler than the standard window frame.
Monitoring and Data Acquisition
Both the standard and improved homes were fully instrumented with Campbell Scientific CR10 dataloggers to measure weather and thermal conditions as well as total electrical load and each of the major end-use loads. The datalogger was connected to a AM416 multiplexer which allowed the collection of a large number of analog measurements. A SW8A pulse count board allowed storage of the numerous switch-closure measurements on site. A series of Ohio Semitronics watt-hour transducers measured the power consumption of the various appliances. The following electrical end-uses were individually metered: total electricity, air conditioner, air handler, hot water, refrigerator, range, dryer, and washing machine. Miscellaneous loads, including lighting and ceiling fan use were tracked by subtracting the major electrical end uses from total.
In addition, a weather station was installed to obtain data on ambient air temperature, relative humidity and solar irradiance. Wind speed was obtained by an RM Young anemometer; solar irradiance was obtained from Li-cor silicon cell pyranometers. Ambient and indoor relative humidities were taken by Vaisala hygrometers. Temperatures were taken in a variety of locations throughout both homes to characterize thermal performance. All temperatures were taken with Type-T thermocouples (0.1oF accuracy):
- Ambient air temperature
- Attic air temperature
- Interior air temperature by thermostat
- Return air temperature (just before the coil)
- Supply air temperature (just after the coil)
- Supply air temperature at closest register
- Supply air temperature at far register
The temperatures taken before and after the air conditioner coil allow characterization of cooling system performance; the temperatures taken at the near and far registers should allow assessment of heat gains to the duct systems.
All of the data channels in both houses were scanned every ten seconds with integrated averages output to storage each 15 minutes. The resulting data was then sent to FSEC over dedicated telephone lines each evening. Detailed plots were created for each day of the monitoring project.
Unoccupied Cooling Performance
A 17-day period in September 1999 was used to estimate the summer (cooling) savings of the improved house. During this 17-day period, both houses were unoccupied, and the average ambient temperature was 79.5°F. The cooling set point at the houses were adjusted so that each house held approximately the same interior temperature. Over the 17-day span, the average interior temperature of the standard house was 76.1°F and the average interior temperature of the improved house was 75.8°F. Although very similar thermostat settings were used, measured interior temperatures showed evidence of improved comfort in the improved home during the hottest part of the summer afternoons.
Comparison of the combined condenser and air handler power for the 17-day period showed that the improved home used 14.7% less cooling energy than the standard home. As shown in Figure 3, the profile of the AC savings was strongly a function of the time of day, with the largest demand reductions between 7 AM and 5 PM EST. The experimental results from the project demonstrate that the improved windows have the potential to reduce the peak cooling energy demand in Florida houses while producing energy savings for the consumer.
Figure 3. Average Summer Day Cooling Energy Use.
Occupied Heating Performance
Performance of the improved windows during the heating season was conducted on January 28, 2000 - one of the coldest days of Florida’s mild winter season. The average ambient temperature for the 24-hour period was 55°F with a low of 43°F. Although both houses were occupied during this period, the interior temperature in the houses was, on average, within 1.1°F (the standard house averaged 69.7°F and the improved house averaged 70.8°F for the 24-hour period). Figure 4 shows the interior and ambient temperatures at both houses for January 28th.
Figure 4. January 28, 2000 Temperature Comparison.
During the 24-hour period, although both houses were heating, the improved house’s heat pump consumed 36.4% less energy. This is made more impressive by the fact that the interior temperature in the improved house was also higher. Figure 5 shows that while the standard house’s heat pump cycled on-and-off all day, once the ambient temperature rose above 60°F, the improved house’s heat pump did not need to come on again to maintain the interior temperature. Thus, it appears that the increased R-value of the double paned, thermally broken improved windows aided in insulating the improved house.
Figure 5. Heating Use Comparison.
During
the early morning period (1AM – noon), the improved
insulating quality of the better glass was also helpful
in decreasing the number of times that the improved house’s
heat pump had to cycle on. While the standard house’s
heat pump cycled on 14 times, the improved house’s
cycled on only 4.
Simulation
Analysis and Estimate of Annual Energy Savings
A detailed simulation was performed to compare the actual energy savings versus predicted savings (Fuehrlein et. al. 2000). DOE-2 models of both houses were created - as in the actual experiment, both models were identical with the exception of the windows. The EnergyGauge USA model was used (Parker et al, 1999). Interior set points for the model were set at 76°F for cooling and 70°F for heating, no interior shading (blinds/draperies) were used, and neighboring houses were included in the shading analysis. Parametric analysis for the standard house indicated that windows comprise 24% of the overall cooling load component.
The
simulation predicted cooling savings of approximately 15%
for the improved house in the month of September. This
compares favorably with the measured value of 14.7% during
the 17-day unoccupied period. The model estimated that
the standard house would consume 5,408 kWh for yearly cooling
while the improved house would consume 4,471 kWh, a reduction
of 17% which translates to approximately $75/year at typical
Florida electric rates. The simulation also showed that
on the peak cooling day, the cooling load of the standard
house would be 494.7 kBtu, while the cooling load for the
improved house would be 413.3 kBtu.
Potential
Impacts on Cooling and Heating System Size
As
part of the simulation, a residential heating and cooling
sizing calculations were completed to compare the relative
sizes of heat pumps that were required for each house.
For the standard house, the Manual J sizing calculation
found the heating load to be 42.6 kBtuh and the cooling
load to be 41.1 kButh. For the improved house, the heating
load was 36.1 kBtuh while the cooling load was 31.8 kBtuh,
a decrease of 6.5 kBtuh and 9.3 kBtuh, respectively. This
shows that for the improved house, a unit one-half ton
smaller than the standard house could be used for heating.
For cooling, there was almost a full ton reduction in required
air conditioning capacity. Since the incremental cost per
ton of cooling equipment is at least $400/ton this represents
a significant potential economic impact.
Conclusions
A detailed study compared single-pane windows in a side-by-side field test with double-pane, spectrally selective, thermally-broken windows. Two identical 2,122 square-foot houses were constructed in the same neighborhood, one with the standard single-pane windows, and one with the advanced spectrally selective windows.
The two homes were extensively metered in a side-by-side configuration to measure the energy savings of the improved windows. Data collection on power usage, interior comfort, and meteorological data began in September, 1999 with the homes being unoccupied for the first 4 weeks of the experiment. The average ambient temperature during the comparison was 79.5° F.
Comparison
of collected energy use of the two houses was used to estimate
energy use reductions. The indicated summer savings were
approximately 15% when measured over a 17-day period during
September, 1999. Although very similar thermostat settings
were used, measured interior temperatures showed evidence
of improved comfort in the improved home during the hottest
part of summer afternoons. Use of a calibrated energy simulation
showed an annual cooling savings of 937 kWh, about $75/year
at typical Florida electric rates.
References
Brunger, A., Dubrous, F., and Harrison, S. 1999. Measurement of the solar heat gain coefficient and U-value of windows with insect screens. ASHRAE Transactions, Vol. 105, Part 2.
Fuehrlein, B. Chandra, S., Parker, D.S., Vieira, R. 2000 (forthcoming). Evaluation of a Residential Energy Design Software Against Monitored Data in a Side-by-Side Test, Proceedings of the 2000 ACEEE Summer Study on Energy Efficiency in Buildings, Pacific Grove, California.
Lee, E.S., Hopkins, D., Rubin, M., Arasteh, and D., Selkowitz, S., 1994. Spectrally selective glazings for residential retrofits in cooling-dominated climates. ASHRAE Transactions. NO-94-14-5.
Parker, D.S., Broman, P.A., Grant, J.B., Gu, L., Anello, M.T., Vieira, R.K., and Henderson, H.I. 1999. EnergyGauge USA: A residential building energy simulation design tool. Proceedings of the Sixth International IBPSA Conference, Building Simulation 99, Kyoto, Japan, September, 1999, Pages 73-79.
Parker, D.S. 1989. "Analysis of annual and peak load savings of high-performance windows for the Florida climate", Proceedings of the ASHRAE/DOE/BTECC/CIBSE Conference. December 4-7, 1989. Orlando, Florida.
Parker, D.S. and Vieira, R. 2000. Priorities for Energy Efficiency in New Residential Construction in Florida, FSEC-GP-66, Cocoa, Florida.
PPG Industries Product Literature, Flat Glass Technical Services 1999. Window Properties for 3mm Clear (monolithic) and 3mm Sungate 1000 (2) + .3125 Airspace + 3mm Clear.
Reilly, S., and Hawthorne, W. 1998. The impact of windows on residential energy use. ASHRAE Transactions.
Vieira, R. 1986. Windows for hot climates: how to make the all-around best choices. Progressive Builder, November, FSEC-PF-119-86, Cape Canaveral, FL.
Vieira, R. 1987. The relative benefits of low-emissivity windows for Florida residences. ASHRAE Transactions, Vol. 93, Part 1.
Wright,
J.L. 1995. Summary and Comparison of Methods to Calculate
Solar Heat Gain. ASHRAE Transactions 101. no.
1.
Presented
at:
2000 ACEE Summer Study on Energy Efficiency
in Buildings
August 20-25, 2000
Pacific Grove, CA
© 2007-2014 University of Central Florida. The Florida Solar Energy Center (FSEC)
is a research institute of the
University of Central Florida.
For more information about FSEC, please contact us or learn more about us.
Find us on Facebook!