

Reference Publication: Sonne, J K and R K Viera, 2000. "Cool Neighborhoods: The Measurement of Small Scale Heat Islands." Proceedings of 2000 Summer Study on Energy Efficiency in Buildings, American Council for an Energy-Efficient Economy, 1001 Connecticut Avenue, Washington, DC. Disclaimer: The views and opinions expressed in this article are solely those of the authors and are not intended to represent the views and opinions of the Florida Solar Energy Center. |
Cool Neighborhoods: The Measurement of Small Scale Heat Islands
Jeffrey K Sonne
and Robin K. Vieira
Florida
Solar Energy Center (FSEC)
FSEC-PF-363-01
Abstract
Rapid population influx in many Sunbelt cities has led to demands for converting natural areas to housing, many times by clear-cutting large tracts of land. This trend may be affecting the climate for existing and future residents and increasing energy bills. The heat island for large cities has been documented, however the impact of tree canopy on micro-climates in suburban environments has not been researched as much. Tree canopy in micro-climates has implications, both for preserving trees within recently constructed developments, as well as for tree-planting programs.
To address this issue, temperature measurements were made over
a one year period at three Melbourne, Florida sites. The results
showed a forested nature park of 19 hectares to be consistently
cooler during both summer days and nights than a residential
development of 9 hectares and density of 4.6 houses per hectare
with an extensive tall tree canopy. This development was, in
turn, consistently cooler than a residential development of
37 hectares and density of 10.1 houses per hectare with very
few trees. The average July air temperatures in 1992 for the
forested undeveloped site, residential site with trees, and
residential site without trees measured at the project's main
stations were 26.2, 26.9 and 27.8oC respectively
at a 2.5-meter height and 26.7, 27.0 and 27.7oC respectively
at a 9-meter height. The 2.5-meter temperature differences were
greater than 1oC between the two residential sites
93% of the time when both sites had wind speeds greater than
0.5 m/s. Mobile measurements were made on two summer days, with
good agreement with the main stations. The mobile measurement
made on a sunny day indicated significant localized warming
at commercial sites adjacent to the residential development
with trees.
Background
Temperature differences between built-up and more rural areas - heat islands - are caused by a combination of factors. Some of the most important are the amount of solar radiation received, albedo, emissivity, geometry and thermal properties of the surfaces, type and amount of vegetation, and weather conditions. A thorough discussion of how these factors interact to cause the temperature differences is readily available (i.e. Oke 1978, and Landsberg 1981).
The consequences of the development of heat islands are complex and can be beneficial in some areas and seasons and detrimental in others. This study focused on cooling-dominated climates where the increased temperature found in developed areas often causes greater air conditioner use, resulting in higher energy demand, utility output and CO2 production. However, wind speeds may be higher in developed areas than wooded areas (Heisler 1989) and relative humidity levels are generally lower in built-up areas than in surrounding rural areas (Ackerman 1987). These two factors could actually reduce cooling loads in warm, humid climates. Research has documented climatic changes in metropolitan areas, new towns and even on scales as small as individual buildings.
Many studies have involved tracking urban area temperatures over a period of years. In one of these studies, annual temperature highs for downtown Los Angeles were analyzed for the period 1877 to 1984. Results showed that after 1930, these temperatures have increased by 0.7oC (1.3oF) per decade or 3.3oC (6.0oF) since 1940 (Akbari et. al. 1989). Researchers have calculated that the temperature increase in Los Angeles has caused a 10% rise in peak energy load (Akbari et. al. 1989). A separate analysis of Florida Power and Light's summertime peak load revealed an 82 MW or 1% increase in utility load for each 1oC (1.8oF) outdoor temperature rise (Parker 1988). If the rise in peak load means greater fossil-fueled based power production, the result is increased CO2 output.
To varying degrees the warming trend seen in Los Angeles is also evident in most U.S. urban areas. A study conducted for the Washington, D.C. area, for example, showed a 0.3oC (0.5oF) per decade rise in annual mean temperatures, and a total annual mean rise over 80 years of 2.2oC (4.0oF) (Akbari et. al. 1990). Another study compared average temperature data for 31 California cities with data for 31 rural stations over a 100 year period showing up to a 0.4oC (0.7oF) per decade temperature rise after 1940 (Goodridge 1989).
Other studies have documented how rapidly the urban heat island effect can develop. A study was conducted in Columbia, Maryland as the town was developed and its population grew from 1,000 to 20,000 between 1968 and 1974 (Landsberg 1975). Maximum temperature differences between different land use areas within the town grew during this period from 1oC to 7oC. A similar study showed almost identical results for the town of Corvallis, Oregon (Hutcheon et. al. 1967).
Citywide temperature and climate are, of course, dependent on the individual contributions of all the buildings and vegetation in it. Many studies have shown that each building's microclimate and therefore cooling and heating energy use is directly affected by its albedo and vegetation (see for example McPherson 1981, J.H. Parker 1983, A. Hoyano 1988). Actual heat island effects have also been shown to occur on a single building scale. In one study, a measurable temperature difference was shown to exist for a five-story brick building that was surrounded by a grass area and small wood grove (Landsberg 1970). A large enclosed shopping mall also showed temperature differences of up to 2oC (4oF) under "favorable" conditions (Norwine 1972).
Studies of neighborhood-sized developments are not as numerous. One available suburban scale study done in Vancouver B.C. shows significant energy flux variations within land areas of 102 to 103 meters (Schmidt, et. al 1991). Another study compared temperatures of a vegetative canopy (approximately 150 by 307 meters), a mature evergreen tree belt and surrounding open fields (Taha et. al. 1991). Results of this study showed that while there were large fluctuations, the average daytime canopy temperature was 2oC (3.6oF) lower than the open fields.
Florida is presently experiencing rapid population growth,
receiving more than 500 additional residents every day (Pierce
1994). This growth in turn leads to land development for housing,
roads and business in new communities. In many cases, these
communities are developed in phases of 20, 40 or 100 acres at
a time. The purpose of this study then, is to further investigate
temperature changes as a result of differences in land use of
these smaller, development-scale sites. To accomplish this purpose,
extensive meteorological measurements were made over a one year
period at three Melbourne, Florida sites.
Experimental Approach
Three distinct land areas were experimentally compared:
- an undisturbed naturally forested site,
- a developed, residential site almost completely lacking natural vegetation, and
- another developed, residential site with a moderate amount of natural vegetation and substantial tree canopy remaining.
The ideal experimental land configuration would include three large, adjacent, homogeneous areas, each representing one of the three distinct land uses. This setup would help insure that the data is not affected by phenomena other than the ones being studied.
In practice however, site selection was somewhat limited by travel constraints, permission to study potential sites, and the logistics of local development. The sites eventually chosen included a heavily-wooded nature park, an adjacent residential neighborhood with mature and relatively dense tree cover (tree heights up to approximately 18 meters (60 feet)), and another residential neighborhood approximately 6.5 kilometers (4 miles) to the north of the other two sites, with very little vegetation and few mature trees. Although it would have been desirable to have all three sites closer together, no closer, suitable sites were found. Figures 1a and 1b show aerial views of the three sites.
 |
 |
Figure 1a and 1b. Aerial views of the sites.
The natural forested site is approximately 19 hectares. The residential site with trees has a total area of 9 hectares and house density of approximately 4.6 houses per hectare, while the residential site with few trees has a total size of 37 hectares and density of 10.1 houses per hectare. Houses at the residential site with trees were, however, somewhat larger than the houses at the site with few trees. Again, it would have been desirable to have used two sites with more similar house densities, and while two better sites were found, it was not possible to gain permission to use them for the study. Road area is approximately 11.6% of the total for the residential site without trees and 13.2% for the residential site with trees. The nature park has a raised wooden walkway but no roads.
The area surrounding the nature park and adjacent neighborhood with trees includes other residential areas, some industrial areas, a large enclosed mall immediately to the southeast and smaller strip mall to the east. The area around the neighborhood with few trees consists of other residential areas (including a similar neighborhood to the west), two story apartment buildings to the east and north and a strip mall to the southeast.
At each site a weather station with a 9-meter (30 foot) tower was set-up and meteorological data recorded (at the undeveloped site with trees the instrument support structures were actually mounted to a tree). Greater tower heights were not feasible because of a combination of factors including resident concerns, local government limitations and expenses that would have resulted from installing a higher tower for long term use. Thus at the sites with trees both measurements are under the tree canopy. Measurements were taken every 15 seconds and averaged or totaled over 15 minute intervals. Data was collected daily from November 1991 through January 1993 at the two residential sites and from April 1992 until Feb. 1993 at the forested site.
At the 9-meter (30 foot) height, measurements made were limited to temperature, relative humidity, wind speed, and wind direction. At 2.5-meters (8 feet), measurements included the above four plus solar and long-wave radiation, rainfall, and mean radiant temperature. Part of the tower (to the north) was within the field of view of the solar radiation sensors at all three sites. The solar radiation sensor at the site without trees was installed where it was fully exposed to direct sunlight; but some house roofs were also within the field of view. Since the primary purpose of the experiment was comparison, these locations were selected to be as representative as possible within the limitations of the experiment (as noted, it was not possible to measure above canopy height at the sites with trees). Additionally, ground temperature measurements were taken at each site. Figures 2a, b, and c are photographs of the station set-up at each of the three locations - the undeveloped site with trees, the residential site with trees and residential site without trees respectively.
|
|
The data was collected with data loggers housed at each site and transferred daily through a modem and phone or cellular connection to a mainframe computer for analysis.
Figure 2a. Instruments at Undeveloped Site with Trees
Since temperature differences were expected to be small, the thermocouples were calibrated against NIST traceable reference thermometers using ice, ambient, and heated baths to within ±0.06oC (±0.11oF) of each other. At the end of the study period, the thermocouples were recalibrated to insure that the measurements had remained accurate throughout the experiment. Comparisons of the two calibrations yielded temperature differences less than 0.04oC (0.07oF).
Shielding the thermocouples from solar radiation was also an important consideration because by design the study involved three sites with significantly different solar radiation levels. A study was conducted to find the most effective commercially available radiation shields (Sonne et. al. 1993). Both naturally and fan aspirated shields were tested. Although naturally aspirated shields were generally found to be effective, their ability to reduce radiation effects was substantially decreased at times of low wind speed. Since the three sites studied would experience significant wind speed differences due to varying amounts of vegetation at each site, it was decided that naturally aspirated shields would not be appropriate for the purposes of the project. Of the two fan aspirated shields tested, one was clearly more effective in reducing radiation error. A comparison of temperatures obtained using seven of the more effective shields showed temperature differences of up to 0.4oC (0.7oF) during certain daytime hours on clear days but consistently less than 0.1oC (0.2oF) differences during nighttime hours. The average temperature difference was 0.12oC (0.22oF). Because of the need for highly accurate temperature measurement, methods to further reduce the effect of radiation were considered and tested, but without success. Consequently, while greater accuracy would be very desirable, significant improvements are not practically feasible for field experiments.
Because of the daytime temperature differences observed in side-by-side shielding tests, and since observed shielding test results include data logger and sensor error, it was concluded that any measured daytime temperature difference between field sites could include up to 0.4oC (0.7oF) that is not site-related. A ±0.4oC (0.7oF) error band is assumed to be the maximum total error possible and is used in all discussions of daytime temperature differences. As a very conservative measure, this error band is also applied to long-term (24-hour or longer) average temperature differences.
Mobile temperature measurements were also made during the study
period as another means of accounting for spatial variability
and obtaining temperatures of locations surrounding the test
areas. Mobile test measurements date back to 1927 (Landsberg
1981). The measurements for this study were made by driving
through the test and surrounding areas with a van equipped with
a video camera and shielded thermocouple mounted outside the
vehicle. A closed path was driven and retraced to account for
temperature changes during the test.
Summer Results
General
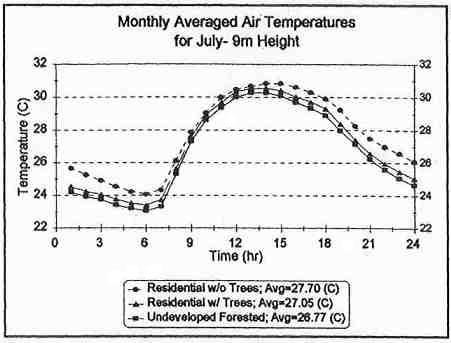
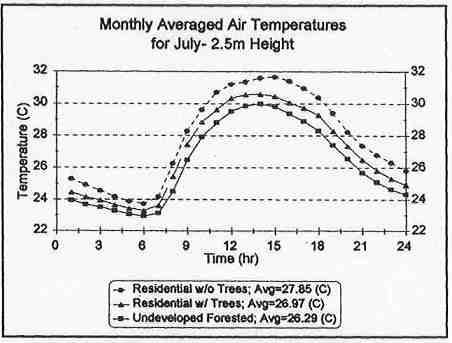
While some year long and winter results will be discussed, the heat island effect in Florida is most important during the summer months. The presentation of results will concentrate on summer data. July 1992 data is chosen as a representative month. The average July temperatures for the forested undeveloped site, residential site with trees, and residential site without trees were 26.2, 26.9 and 27.8oC, respectively, at the 2.5-meter height and 26.7, 27.0 and 27.7oC, respectively, at the 9-meter height. Figures 3a and 3b are plots of average 2.5-meter and 9-meter July air temperatures.
3A
3B
Figure 3a and 3b. Comparison of 24-Hour Averaged July Air Temperatures for the Three Experimental Sites - 2.5 Meter and 9 Meter Height.
The unshaded residential site without trees was consistently warmer than the residential site with trees and the undeveloped site with trees, which was consistently the coolest of all three sites at both heights.
The greatest differences occurred during the afternoon hours. The peak afternoon temperature at the undeveloped forested site during July was typically 0.4 to 1.4oC ±0.4oC (at 2.5 m) and 0.1 to 1.0 ±0.4oC (at 9 m) cooler than the peak afternoon temperature at the residential site with many trees. This residential site with a tree canopy had peak afternoon temperatures during July typically 0.6 to 1.7oC ±0.4oC (at 2.5m) and 0.0 to 0.8oC ±0.4oC (at 9 m) cooler than at the residential site without trees.
Temperatures During Sunniest Periods
As would be expected, average July temperature differences were somewhat larger for periods when the solar radiation exceeded 500 W/m2 at the site without trees (197 hours during July 1992). For these periods, the undeveloped forested site had an average temperature of 28.9oC, while the residential site with trees had an average temperature of 29.7oC, and the site without trees had a temperature of 30.8oC, all at the 2.5-meter height (Figure 4a).
|
|
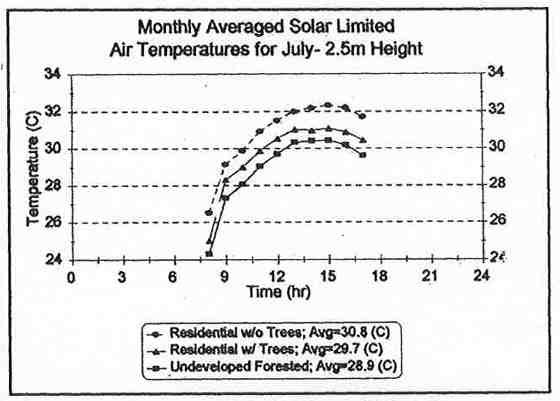
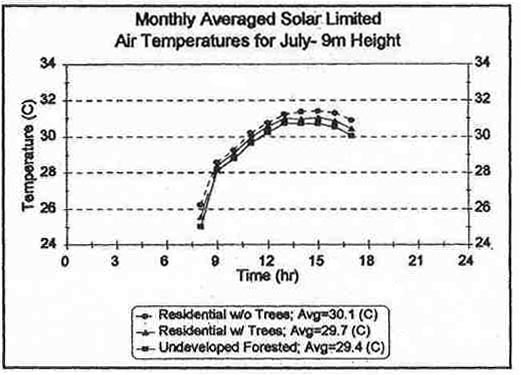
The averaged maximum temperatures under these strong solar conditions were 30.4oC, 31.1oC and 32.4oC for the forested, residential site with trees, and unshaded residential site, respectively.
The nine-meter measurements were much closer, with only 0.3 ±0.4oC and 0.4 ±0.4oC separating the sites on average as shown in Figure 4b. The maximum differences were similarly small.
Mobile Measurements
The temperatures from mobile tests made August 11 and August 20 are given in Figures 5a, 6a and 7a. Both the a.m. August 11 and August 20 mobile data show the residential site with trees to be consistently cooler than the residential site without trees.
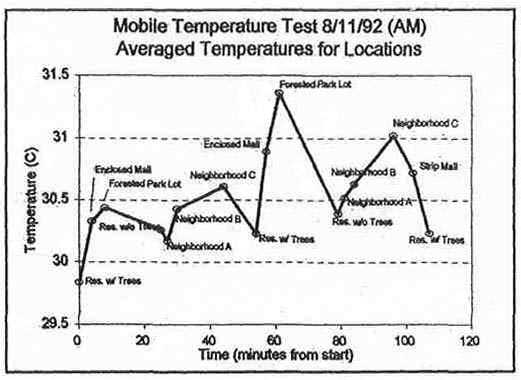
Figure 5a. Averaged temperatures of sites along mobile route for
morning August 11.
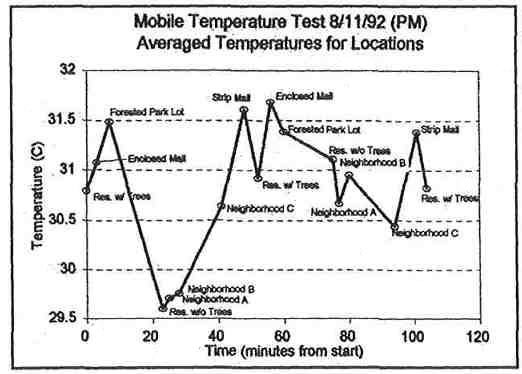
Figure 6a. Averaged temperatures of sites along mobile route for
morning August 11.
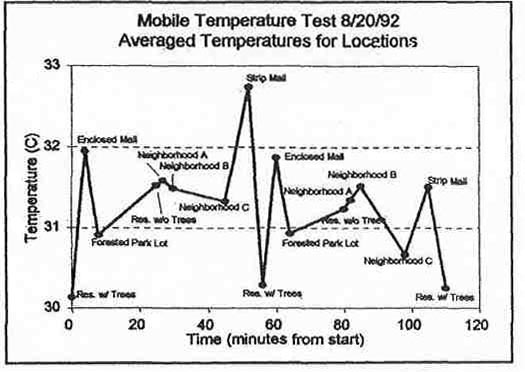
Figure 7a. Averaged temperatures of sites along mobile route for
morning August 20.
For the p.m. August 11 mobile test, the residential site without trees is initially cooler than the site with trees during the first test loop. This reversal is also seen in the 2.5-meter station data, the site with trees being as much as 1.9oC (3.4oF) warmer than the site without trees. During the second loop, the site without trees again becomes slightly warmer than the site with trees. An enclosed regional mall parking lot, located within 0.8 km. (0.5 mi.) to the southeast (generally windward during the summer) of the residential site with trees, had consistently higher temperatures than both the residential sites during all three mobile tests. Mall temperatures exceeded those of the residential site with trees and without trees by up to 1.7oC(3.1oF) and 0.5oC (0.9oF) respectively.
Solar radiation data for the two days mobile tests were run are also given, the time of the runs high-lighted in each plot (see Figures 5b, 6b and 7b). Partly cloudy conditions existed for both the a.m. August 11 and August 20 mobile test runs. During the p.m. August 11 run, there was a period of very low solar radiation corresponding to the period during which the residential site with trees gave warmer mobile temperatures than the residential site without trees.
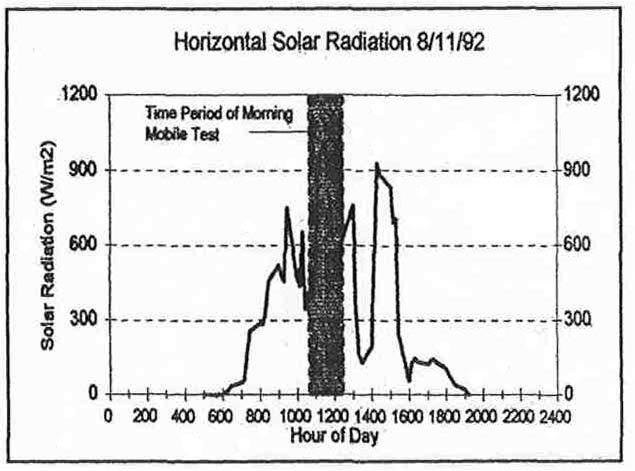
Figure 5b. Horizontal solar radiation at residential site without
trees for day of August 11 mobile run.
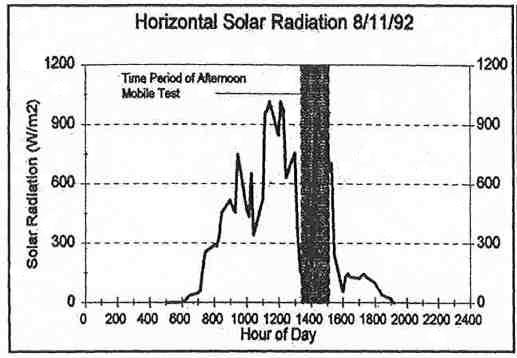
Figure 6b. Horizontal solar radiation at residential site without
trees for day of August 11 mobile run.
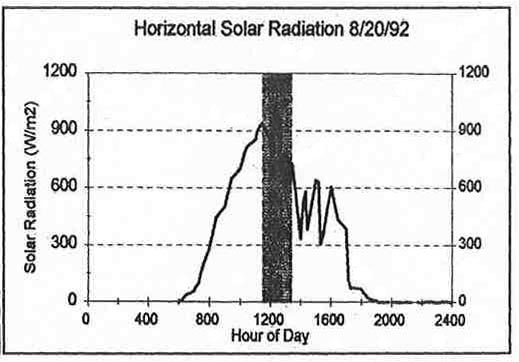
Figure 7b. Horizontal solar radiation at residential site without
trees for day of August 20 mobile run.
Agreement between mobile and main station temperature sensors at the residential sites was good, as is shown in Figure 8a and b.
|
|
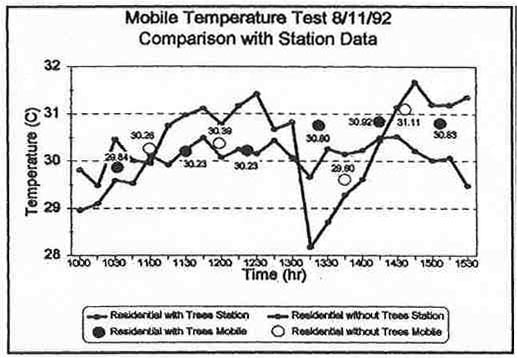
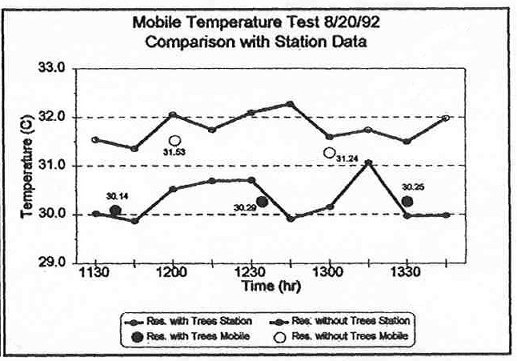
It was not possible to take the mobile
measurements for the forested station any closer than the parking
lot 900 meters away. The mobile measurement in the parking lot
was consistently warmer than the forest station measurement.
Wind-Direction Dependent Temperature Differences
Consistent with previous studies, the wind speed at the residential site without trees was much greater than at the residential site with trees (see Heisler 1989). Note that in all wind speed comparisons, the sensor threshold of 0.45 m/s is used to represent any wind speeds between 0.0 and 0.45 m/s and as a result there will be some inaccuracy in the comparisons. On average, the wind speed at the site without trees was approximately 3.5 times higher at nine-meters and 2.2 times higher at two-meters than the wind speed at the residential site with trees. As shown in Figures 9a and 9b, the daytime wind speeds increased significantly more at the site without trees than at the sites with trees.
|
|
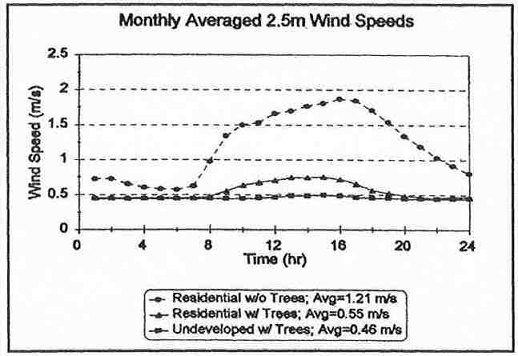
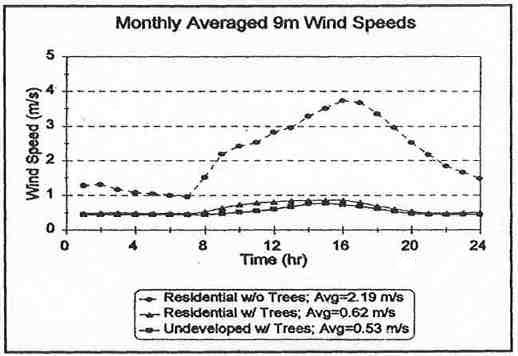
For example at the site without trees, at nine-meters, the average 1600 hour wind speed was 3.7 times higher than the average 0700-hour wind speed. The same comparison for the residential site with trees, while more affected by sensor threshold, shows only a factor of two increase. Wind speeds at the forested, undeveloped site were slightly lower than the wind speeds at the residential site with trees.
Analysis was conducted for July 1992 hours when both the undeveloped, forested site and residential site without trees had 9-meter wind speeds greater than 0.5 m/s and coinciding wind directions. Under these conditions, winds came out of the southeast 62% of the time and the undeveloped forested site at 2.5-meters was over 1oC (1.8oF) cooler than the residential site without trees 93% of the time. Only 4.1% of the temperature differences between the undeveloped site with trees and residential site without trees at the 9-meter height were greater than 1oC (1.8oF).
Analysis comparing the two residential sites using the same wind speed and direction criteria showed southwest winds showed up more often than other directions. The 2.5-meter temperatures were higher at the residential site without trees except for six hours when the breeze came from the northeast and twenty nine early morning hours when the breeze came from the northwest. There is a dominant trend for late afternoon temperatures at the site with trees to be lower than at the site without trees regardless of wind direction.
Year-Long Results
Figure 10 was constructed using weekly averaged 2.5-meter air temperatures over the entire year. It shows that while averaged temperatures are almost always warmest at the residential site without trees, temperature differences are greatest during the summer months.
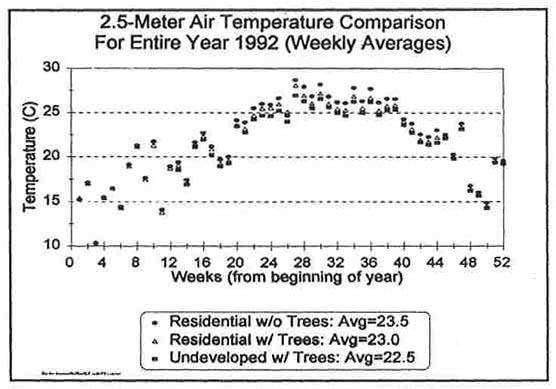
Figure 10. 2.5-meter air temperature: averaged
weekly for the year 1992.
An analysis was also made of temperatures throughout the day
on the four coldest days for which data from all three sites
are available. The residential site without trees is still generally
warmest during the day, averaging 0.5oC (0.9oF)
warmer than the undeveloped site with trees, and 0.3oC
(0.5oF) warmer than the residential site with trees
for the four days shown. No clear nighttime differences exist.
Cold weather in Melbourne, Florida is rare and usually associated
with a cold front that penetrates into the Florida peninsula
and, as a result, is accompanied by clear skies.
Summary
The data collected shows average 2.5-meter air temperatures in an undeveloped, forested site to be 0.7 ±0.4oC (1.3oF ±0.7oF) lower than an adjacent 4.6 house per hectare residential development site with significant tree canopy during July. This residential site with trees had average July 2.5-meter temperatures 0.9 ±0.4oC (1.6oF ± 0.7oF) lower than a 10.1 house per hectare residential site without trees located 6.5 kilometers (4 miles) north. The residential site with tree canopy had peak afternoon temperatures during July which were 0.6 to 1.7oC ±0.4oC (1.1 to 3.1oF ± 0.7oF) cooler than the site without trees.
The consistency of summer temperature differences at the three station sites combined with the agreement of mobile measurements indicate that definite, measurable, temperature differences exist. While it is important to consider the possible effects of surrounding larger areas on the measurements, both the physical site layout and mobile measurements suggest that if anything, the results are somewhat conservative. The presence of a large shopping mall located to the windward side (during the summer) of the residential site with trees, especially tends to indicate that these temperature differences are due to small scale effects.
While more research is needed before it is possible to conclude
exactly which factors are most important in causing the temperature
differences between the sites, these results suggest that neighborhood
scale tree cover does have a definite effect on air temperatures
with implications for comfort and energy use of residents. Thus,
a cool neighborhood is one with significant tree canopy.
Acknowledgments
The authors are grateful for technical assistance provided
by Sue Grimmond of Indiana University, Hashem Akbari of Lawrence
Berkeley Laboratory and Gordon Heisler, Greg McPherson and Jim
Simpson of the USDA Forest Service. Florida Solar Energy Center
employees assisting with the project included Safvat Kalaghchy-
mainframe computer work, Raul Montez - field work, Phil Read
- station set-up, and Armin Rudd - datalogger set-up and datalogger/computer
interface. We also thank Jack Masson, Operations Director of
the Brevard County Parks and Recreation Department, for allowing
us to use one of the parks as the undeveloped experimental site.
Finally the authors acknowledge the Florida Energy Office for
partial funding of this project.
References
Ackerman, B., 1987: "Climatology of Chicago Area Urban-Rural Differences in Humidity," Journal of Climate and Applied Meteorology, Vol. 26, p. 427-430.
Akbari, H., R. Rosenfeld and H. Taha, 1989: "Recent Developments in Heat Island Studies: Technical and policy," Controlling Summer Heat Islands, LBL-27872, p.15-30.
Akbari, H., A.H. Rosenfeld and H. Taha, 1990: "Summer Heat Islands, Urban Trees, and White Surfaces," ASHRAE Transactions, AT-90-24-1, p. 1382.
Goodridge, J., 1989: "Urban and Rural Differences in Long Range Air Temperature Trends in California, 1916 to 1987", California State University.
Heisler, Gordon M., 1989: "Mean Wind Speed Below Building Height in Residential Neighborhoods," Controlling Summer Heat Islands, LBL-27872, p. 264.
Hoyano, Akira, 1988: "Climatological Uses of Plants for Solar Control and the Effects on the Thermal Environment of a Building," Energy and Buildings, Vol. 11, p. 181-199.
Hutcheon, R.J. et. al., 1967: "Observations of the Urban Heat Island in a Small City," Bulletin of the American Meteorological Society, Vol. 48, p. 7-9.
Landsberg, H. E., 1970: "Micrometeorological Temperature Differentiation Through Urbanization," Urban Climates, WMO Tech Note, No. 108, p. 129-136.
Landsberg, H. E., 1975: "Atmospheric Changes in a Growing Community," Institute for Fluid Dynamics and Applied Math. Tech. Note, No. BN 823.
Landsberg, H. E., 1981: The Urban Climate, Academic Press, New York.
McPherson, E. Gregory, 1981: "The Effects of Orientation and Shading from Trees on the Inside and Outside Temperatures of Model Homes," Proceedings of the International Passive and Hybrid Cooling Conf., Miami Beach, FL, ASISES, p. 369-373.
Norwine, James R., 1972: "Heat Island Properties of an Enclosed Multi-Level Suburban Shopping Center," Bulletin of the American Meteorological Society, Vol. 54 No. 7, p. 637-641.
Oke, T.R., 1978: Boundary Layer Climates, William Clowes and Sons Limited, London.
Parker, D.S., 1988: Internal FSEC Memo to Staff on Florida Power and Light Peak Loads, June 17.
Parker, John H., 1983: "The Effectiveness of Vegetation on Residential Cooling," Passive Solar Journal, Vol. 2, No. 2, p. 123.
Pierce, Ann C., Ed., 1994 Florida Statistical Abstract, Twenty-eighth Edition, Bureau of Economic and Business Research, College of Business Administration, University Presses of Florida, Gainesville, Florida, p. 8.
Schmid, H.P., H.A. Cleugh, C.S.B. Grimmond and T.R. Oke, 1991: "Spatial Variability of Energy Fluxes in Suburban Terrain," Boundary-Layer Meteorology, Vol. 54, p. 249-276.
Sonne, J.K., R.K. Vieira, A.F. Rudd, 1993: "Limiting Solar Radiation Effects on Outdoor Air Temperature Measurement," ASHRAE Treansactions, Vol. 99, Part 1.
Taha, H., H. Akbari and A. Rosenfeld, 1991: "Heat Island
and Oasis Effects of Vegetative Canopies: Micro-Meteorological
Field-Measurements", Theoretical and Applied Climatology,
Vol. 44, p. 123-138.
Presented
at:
2000 ACEEE Summer Study on Energy Efficiency in Buildings
August 20-25, 2000
Pacific Grove, CA
© 2007-2014 University of Central Florida. The Florida Solar Energy Center (FSEC)
is a research institute of the
University of Central Florida.
For more information about FSEC, please contact us or learn more about us.
Find us on Facebook!