

Reference Publication: Parker, D., Sherwin, J., "Comparative Summer Attic Thermal Performance of Six Roof Constructions," The 1998 ASHRAE Annual Meeting, Toronto, Canada, June 20-24, 1998. Disclaimer: The views and opinions expressed in this article are solely those of the authors and are not intended to represent the views and opinions of the Florida Solar Energy Center. |
Comparative Summer Attic Thermal Performance of Six Roof Constructions
Danny
Parker and John Sherwin
Florida
Solar Energy Center (FSEC)
FSEC-PF-337-98
Abstract
Florida Solar Energy Center (FSEC) has measured summer attic thermal performance of six roofs at a heavily instrumented test site, the Flexible Roof Facility (FRF). The FRF is a 1,152 square foot (107 m2) building with six roof adjacent test cells which are heavily insulated from each other. Some 233 channels of data were obtained; this includes twenty temperature measurements per cell, extensive meteorological conditions, surface and tower wind speeds and attic humidity and roof surface moisture accumulation. The data were collected over the ASHRAE definition of summer (June - September) to compare cooling season thermal of roofing systems. Six differing roof types were evaluated with variations in color, ventilation, roof mass and the use of radiant barrier systems (RBS). The tests show that roof system reflectivity greatly influences attic summer temperatures. Two white roofing systems outperformed the other options. Another large improvement comes from greater roof mass; tiled roofs performed better than those with asphalt shingled roofs. An increased attic ventilation rate improved the effectiveness of an attic radiant barrier. Of the evaluated options white tile roof best controlled attic heat gain.
Background
Improving attic thermal performance is fundamental to controlling residential cooling loads in hot climates. Research shows that the influence of attics on space cooling is not only due to the change in ceiling heat flux, but often due to the conditions within the attic itself and their influence on heat gain to duct systems and on air infiltration into the building.
The importance of ceiling heat flux has long been recognized with insulation a proven means of controlling excessive gains. However, when ducts are present in the attic, the magnitude of heat gain to the thermal distribution system under peak conditions can be much greater than the ceiling heat flux (Parker et al., 1993; Hageman and Modera, 1996). A simple calculation illustrates this fact. Assume a 2,000 square foot ceiling with R-30 attic insulation. Supply ducts in most residences typically comprise a combined area of ~25% of the gross floor area (see Gu et al. 1996, Appendix G, and Jump and Modera, 1996), but are only insulated to between R-4 to R-6. With the peak attic temperature at 130oF, and 78o maintained inside, a UA dT calculation shows a ceiling heat gain of 3,500 Btu/hr. With R-5 ducts in the attic and a 57o air conditioner supply temperature, the heat gain to the duct system is 7,300 Btu/hr if the cooling system ran the full hour under design conditions – more than twice the ceiling flux. This influence may be exacerbated by location of the air handler within the attic space – a common practice in much of the southern U.S. The air handler is poorly insulated with the greatest temperature difference at the evaporator of any location of the cooling system. It also has the greatest negative pressure just before the fan so that some leakage into the unit is inevitable. As evidence, for this influence a monitoring study of air conditioning energy in 48 central Florida homes (Cummings, 1991) found that homes with the air handlers located in the attic used 30% more space cooling energy than those with the air handlers located in garages or elsewhere.
Buildings research also shows that duct system supply air leakage can lead to negative pressures within the house interior when the air handler is operating. This can result in hot air from the attic being drawn down to the conditioned space gaps around recessed light fixtures or other bypasses from the attic to the interior (see Cummings et al., 1991, p. 41). This phenomenon is commonly encountered in slab on grade homes in Sunbelt states in the U.S. where the dominant infiltration leakage plane from the exterior is through the ceiling.
The impact of the these two factors result in much greater importance in controlling attic air temperatures than apparent from focus on ceiling heat flux alone(1). Consequently, in our assessment of the impact of different roof constructions on cooling related performance, we considered both ceiling flux and attic air temperature.
Test Facility Description and Objectives
During the summer of 1997, tests were performed on six different residential plywood-decked roofing systems. The experiments were conducted at the flexible roof facility (FRF) located in Cocoa, Florida, ten miles (17 km) west of the Atlantic ocean on mainland Florida. The FRF is a 24 ft by 48 ft (7.3 x 14.6 m) frame building with its long axis oriented east-west (Figure 1). The roof and attic are partitioned to allow simultaneous testing of multiple roof configurations. The orientation provides a northern and southern exposure for the building materials under evaluation. The attic is sectioned into six individual six foot (1.8 m) test cells (detail A in Figure 1) spanning three 2 ft (0.6 m) trusses thermally separated by partition walls insulated to R-20 ft2-hr-oF/Btu (RSI-3.5 m2-K/W) using three inches (7.6 cm) of isocyanurate insulation.
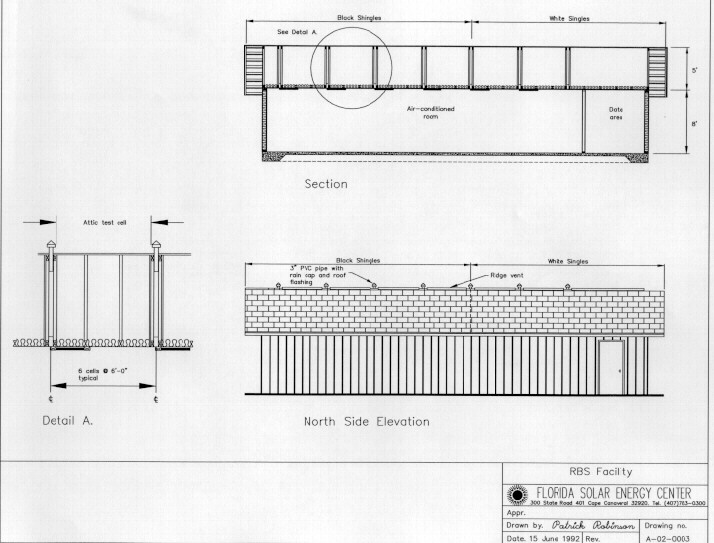
Figure 1a. Detail of FRF schematic.
The partition between the individual cells was well sealed to prevent air flow cross-contamination. The gable roof has a 5/12 pitch (22.6o) and 3/4 inch (1.9 cm) plywood decking. On the attic floor, R-19 (RSI-3.3) unfaced batt insulation is installed between the trusses in all of the test bays in a consistent fashion. One half inch (1.3 cm) gypsum board separates the attic from the conditioned interior. The interior of the FRF is a single open conditioned space.
Figure
1. Flexible Roof Facility.
The roof lends itself to easy reconfiguration with different roof products and has been used in the past to examine different levels of ventilation and installation configurations for tile roofing (Beal and Chandra, 1995). A black asphalt shingle roof on one of the test cells serves as a reference for other roofing types.
Our tests in 1997 addressed the following questions:
Test Configuration and Instrumentation1) What is the performance (ceiling flux and attic air temperatures) of a standard black asphalt shingle roof with 1:300 ventilation?
2) How does addition of a truss mounted radiant barrier system (RBS) impact performance?
3) How does added ventilation (1:150) impact RBS performance?
4) How does a direct nailed red barrel tile roof perform relative to other types?
5) How doe a white barrel tile roof perform relative to red tile and to the others?
6) How does a white standing seam metal roof perform relative to white tile and the other types?
7) How do near roof wind velocities relate to those taken at a 10 meter height?
8) Can differences be seen in water evaporation rates on differing roofing systems?
9) How do roofing system differences impact attic relative humidities?
10) What impact on shingle surface temperatures is produced by an attic truss RBS?
To answer the above questions, we configured the test cells in the following fashion:
Cell 1: Direct nailed white concrete barrel tile
Cell 2: Black asphalt shingles; deck mounted RBS ; 1:150 soffit and ridge ventilation
Cell 3: Black asphalt shingles; deck mounted RBS ; 1:300 soffit and ridge ventilation
Cell 4: Direct nailed red concrete barrel tile; 1:30 ventilation
Cell 5: Black asphalt shingles; 1:300 soffit and ridge ventilation (reference cell)
Cell 6: White standing seam metal; 1:300 soffit and ridge ventilation
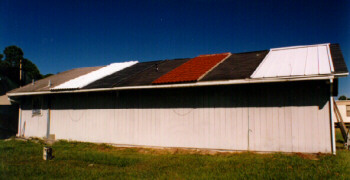
The final appearance of the facility as configured for test is shown in the photographic insert in Figure 1. All roofing materials were installed in a conventional manner, and according to manufacturer’s specifications and current practice in the Central Florida area. Although raised counter-batten type tile installations which promote ventilation have been shown thermally beneficial (see Beal and Chandra, 1994), current practice, with its focus on lower first costs, dictated a direct nailed application method for the tile roofs. Perforated vinyl soffit vents were used; ridge vents were the "shingle vent" type with foam mesh over the ridge outlet covered by shingles. Standard tile ridge vents were utilized for the two tile roof sections and a manufacturer supplied ridge vent was used with the standing seam metal roof. In each test cell the free ventilation area was first estimated based on dimensional measurements and then verified by a fan pressurization test of the attic to estimate the equivalent leakage area. Soffit or ridge vent area was then closed off to match the target free vent area to within 10%. The 1:300 attic vent to floor area was observed for all of the test cells, save for a single cell which had enhanced ventilation (1:150) to examine its relative influence on RBS performance.
Samples of the roofing materials were sent to a laboratory to establish their integrated solar reflectance using ASTM Test Method E-903 (1996); long wave emittance was measured also using the ASTM E-408 test procedure. The following values were reported:
Table
1
Tested Roofing Material Solar Reflectances and Emittances*
Sample |
Solar Reflectance |
Long-wave emittance |
| Black
asphalt shingle† White
tile |
2.7% 75.4% |
0.90 |
*
Test results for new, unexposed products.
† Used in three test cells.
Instrumentation for the project was extensive so the data can
eventually validate a detailed attic simulation model. A
number of temperature measurements using type-T thermocouples
as are detailed in Figure
2. Air temperatures were shielded from the influence
of radiation.
These included:
- Exterior
surface of the roof and underlayment temperatures
- Decking
interior surfaces
- Air
temperatures at different heights within the attic
- Soffit
inlet air temperature/ridge vent exit air temperature
- Insulation
top surface temperatures
- Conditioned
interior ceiling temperature
The following meteorological data were taken:
- Solar
insolation
- Aspirated
ambient air temperature
- Ambient
relative humidity
- Wind
speed at a 32 ft (10 m) height
- Rainfall (tipping bucket)
Three
additional unique measurements were taken. Previous attic simulation
analysis has shown that knowledge of the air speed just above
the roofing system is critical to estimation of the roof surface
convective heat transfer coefficient as well as attic ventilation
rates, although empirical data is often lacking (Parker et
al., 1991, Wilkes, 1991). Thus, we mounted a cupped anemometer,
both on the north and south of Cell 3 at mid- roof at a ten
inch (0.25 m) height so that wind speed near the roof surface
could be compared with the 32 ft (10 m) value on the weather
tower 25 ft (8m) southeast of the facility. Earlier data also
revealed that moisture accumulation on roofs resulted in measurable
differences in attic thermal performance during morning hours
due to evaporative cooling. To examine this phenomenon, we
mounted small surface wetness sensors to the south roof exposure
of each roof section to measure when dew formed on the roof
surfaces and when it was finally evaporated. The sensors, adapted
from electrical impedance grids for measuring leaf wetness
(Gillespie and Kidd, 1978), were painted to match the roofing
samples and calibrated so that it was possible to determine
when the roof was "wet" or
"dry." Their sensitivity was verified by physical inspection.
Finally, we installed calibrated hygrometers at mid-attic in each of the
test cells to measure relative humidity levels.
All of the test cells were operational by June 5, 1997, at which
point data collection began. The test cells were maintained in
an unaltered state through the end of September with continuous
data collection.
Results
Attic Air Temperatures
Data collected for June 16, 1997 (Figure 3) shows typical thermal behavior prevailing throughout the cooling season. The plotted data is for attic air temperature at a six inch height above the insulation at mid attic-- often where the duct system would be located. The standard test cell (#5) is the hottest reaching 134.9oF (57.2oC) on a hot summer day (peak ambient temperature was 92.2oF or 33.4oC). The attic with RBS with 1:300 ventilation is next hottest (128.1oF or 53.4oC), followed by the attic with RBS with 1:150 ventilation (116.1oF or 46.7oC). The red tile roof exhibits similar performance to the well ventilated radiant barrier case during the daytime hours (max = 115.7oF or 46.5oC), but is warmer at night. Both white roofs show the lowest temperatures. The white metal roof does not rise more than ten degrees above ambient-- 102.2oF (39oC). One of the most interesting findings regards the performance of the white tile roof; the attic in this configuration does not typically rise above ambient air temperature until after 2 PM EST in the afternoon. Its maximum daily temperature is only 91.5oF (33.1oC) and the average daily attic air temperature, 80.8oF (27.1oC), is only one degree warmer than the average ambient air temperature.
Figure 3. Measured mid attic and ambient air temperatures
in the six test cells on June 16, 1997.
Data from the site for the entire summer (June 1st - September 30th) is summarized in Table 2 and Figure 4.
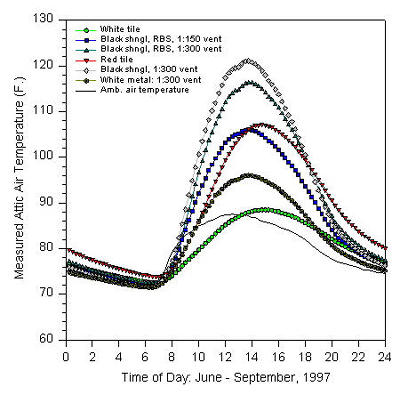
Figure 4. Measured average mid attic and ambient air temperatures
in the six test cells over course of entire summer.
The attic and ambient air temperatures were used for the data analysis. The attic air temperature was taken at mid height, halfway between the decking and insulation surface (a 24" (0.6m) height). The summer 15-minute data comprised 11,262 observations with averages, minimums and maximums given in the table. These were further sorted by the average ambient air temperature into the top 2.5% of the observations (~282) of the highest temperature coinciding with the ASHRAE definition of the summer design condition. Within top 2.5% of observations, the average outside air temperature, attic air temperature and the coincident difference is reported.
Table
2
FRF Mid Attic Temperatures for Summer 1997
Designation |
Description |
Temperature (oF) |
2.5% Design |
|||
Mean |
Min |
Max |
T(oF) |
(d)T |
||
| Ambient | Aspirated air temperature | 79.8 |
67.6 |
96.8 |
92.6 |
Ref |
| Cell #1 | White tile roof, 1:300 vent | 80.0 |
63.7 |
96.0 |
91.4 |
-1.2 |
| Cell #2 | Black shingle, RBS, 1:150 vent | 86.1 |
62.8 |
121.6 |
113.3 |
20.7 |
| Cell #3 | Black shingle, RBS, 1:300 vent | 90.0 |
63.6 |
136.3 |
125.4 |
32.8 |
| Cell #4 | Red tile roof, 1:300 vent | 88.1 |
64.6 |
122.2 |
113.0 |
20.4 |
| Cell #5 | Black shingle, 1:300 vent, ref. | 91.0 |
62.5 |
141.9 |
131.5 |
38.9 |
| Cell #6 | White metal, 1:300 vent | 81.9 |
62.4 |
106.8 |
101.5 |
8.9 |
Within each of the test cells, thermocouples recorded the insulation surface temperature on both the north and south sides of the attic as well as the temperature of the gypsum board ceiling’s interior surface immediately below. The insulation in each cell was R-19 (RSI-3.3) so that the both the temperature difference and heat flux could be calculated. These data are presented in Table 3 with averages for the entire summer are shown in Figure 5 over the daily cycle.
Figure 5. Calculated average ceiling temperature flux (Tinsulation - Tceiling, interior) for the six test
cells over the course of the summer.
Table
3
FRF Ceiling Flux Impact for Summer 1997
Designation |
Description |
dT (Tins-Tceiling)oF) |
1- (dTCell/dTCell5) |
||
Mean |
Min |
Max |
% Reduction |
||
| Cell #1 | White tile roof, 1:300 vent | 3.37 |
-35.5 |
18.9 |
75.9% |
| Cell #2 | Black shingle, RBS, 1:150 vent | 8.88 |
-11.7 |
39.5 |
36.4% |
| Cell #3 | Black shingle, RBS, 1:300 vent | 10.29 |
-11.8 |
35.3 |
26.4% |
| Cell #4 | Red tile roof, 1:300 vent | 10.73 |
-13.0 |
43.1 |
23.3% |
| Cell #5 | Black shingle, 1:300 vent, ref. | 13.98 |
-12.6 |
61.7 |
Reference |
| Cell #6 | White metal, 1:300 vent | 5.40 |
-13.1 |
30.0 |
61.3% |
The approximate fluxes in Btu/hr-ft2-EF (W/m2-K) can be obtained by dividing the temperature difference data by 19. This would indicate that the maximum heat flux for the reference cell on a daily basis (Figure 5 ) is on the order of 2.2 Btu/ft2-hr. Figures 6 - 8 show a comparison of all of the calculated flux data for each test cell plotted against the temperature differences across the ceiling in the reference cell (No. 5).
Ventilation and Radiant Barrier Systems: Figure 6 reveals that much of the improvement in heat transfer brought about by added ventilation in the two compared RBS cells occurs during evening hours when fluxes in the standard roof become negative and the added ventilation helps to remove accumulated heat from the RBS attic which is more inhibited in its surface radiative heat transfer to the sky.
Figure 6. Measured temperature difference between two radiant barrier
system test cells with different ventilation rates relative to reference
test cell (black asphalt shingle).
The added ventilation aids the RBS flux abatement considerably, from a 26% to a 36% reduction over the entire summer.
Tile Roofs
Figure 7 shows a similar comparison for the red and white tile roofs.
Figure 7. Measured temperature difference between white and red
tile test cells and reference test cell (black asphalt shingle).
There is a much wider spread in the comparison of the fluxes for the red tile roof to the reference cell due to thermal storage within the roof tiles. This is clearly evident from the "oval" shape of the plots for individual days. During the morning hours, the fluxes are relatively lower than are the late afternoon values with the same flux in the reference cell. It is also noteworthy that the fluxes from the red tile roof are often positive during evening hours when the reference roof has a negative heat flux. This impact is important to consider; constraint of the analysis only to periods when the reference cell heat flux is positive shows better performance for the red tile roof (35% flux reduction) than when considering the overall period (23% lower). The white tile roof shows the largest measured average reductions in ceiling heat flux of those measured: 76%(2).
White Roofs
Figure 8 shows a comparison of the relative ceiling flux of the two white roof systems.
Figure 8. Measured temperature differences between white metal and
white tile test cells and reference test cell (black asphalt shingle).
The lower thermal capacitance of the white metal roof is clearly visible in the data. The white tile roof produces an average 76% flux reduction against 61% for the white metal, with better relative performance. It should be pointed out, however, that the measured solar reflectance of the white tile sample (75%) was greater than that for the metal system (68%) which likely has some impact on the relative comparison. Regardless, it seems likely that the thermal capacitance of the tile roof, and its ability to store "cool" from the night sky would result in superior performance to the metal roof even with similar reflectances. One major caveat on this conclusion, however, has to do with degradation. The superior performance of white roofs is due to a surface property (high solar reflectance). Observation of existing roofing systems of both types in Florida suggests that metal roofs with their smooth surface may maintain their reflectance for a longer period of time. On the other hand, the surprisingly good performance of red tile roofs, previously observed by Beal and Chandra (1995), suggests that even a soiled white tile roof will exhibit significantly better performance than asphalt roofs. Aesthetic concerns, however, may be a greater issue.
Other Findings
As part of the evaluation, we examined how much black asphalt shingle surface temperatures were elevated by the presence of a radiant barrier. This is an oft expressed issue with shingle manufacturers, concerned that elevated temperatures will reduce product life. Figure 9 shows the measured surface temperature of the shingles on June 16, 1997 on the reference cell (#5) and those on cell #3 with an RBS and 1:300 ventilation.
Figure 9. Measured shingle surface temperature elevation of cell
with radiant barrier system versus reference test cell on June 16, 1997.
At peak, the temperature of the shingle surface on the roof of the attic
with the RBS was 5oF greater than that on the reference cell.
The plot shows a maximum increase in the shingle surface temperature of 6.2o (3.4oC). The maximum shingle temperatures measured over the course of the summer was 179.3 oF (81.8oC) with the standard roof and 183.8o (84.3oC) with the RBS.
Figure 10 depicts the measured surface wetness for the different roofs over the summer.
Figure 10. Average roof surface wetness over entire summer. Sensors
were calibrated so that at unity water droplets could be observed on the
roof surface; none could be seen at zero.
In the early monitoring we speculated that a portion of the better performance of the white tile and metal roofs in the morning hours was due to the longer period required for evaporation of dew accumulation from the previous evening. The data from the surface wetness sensors supported this hypothesis. During the early evening, the white metal roof was the first to have dew form, with the surface near saturation each night by about 2 AM. The white tile roof reached a similar condition approximately an hour later. Both white roofs were also the last to dry during the morning; typically the white tile surface not completely dry until approximately 11 AM. On the other hand, the red tile roof, having accumulated heat during the day, was the last to have dew form on its surface, not reaching saturation until around 5 AM. Both roofs with the radiant barriers tended to form surface moisture more rapidly than did the reference cell (#5), due to the shingle surface temperature depression caused by the low-emissivity surface under the decking. All of the shingle roofs dried by 10 AM. The influence of Central Florida’s summer afternoon rain showers is obvious in the data beginning at 3 PM. Not surprisingly, once rains ceased, the white tile or white metal roofs tended to stay wet for a longer time.
Figure 11 shows how mid attic relative humidity varied in each cell over the daily cycle throughout the summer.
Figure 11. Measured average mid-attic relative humidity in test
cells over the course of the summer.
As expected, the white roofing systems (white tile mean = 75%; white metal = 72%) showed the greatest average relativity humidity due primarily to the lower attic interior dry bulb temperature. This was not unexpected since simulation analysis had indicated this influence (Burch et al., 1996). The reference test cell (#5) had the lowest average humidity (53%) closely followed by the RBS cell at 1:300 ventilation (54%) and the RBS cells with 1:150 ventilation (62%). The red tile roof’s attic averaged 61%. It is not clear how much the added ventilation in Cell#2 increased attic moisture levels. Recently, attic ventilation has become a contentious issue, in part due to the lack of scientific basis for the 1:300 ventilation rate (Rose, 1995), simulated influences (Burch et al., 1996) as well as shingle manufacturers’ concerns regarding the life expectancy of roofing materials exposed to elevated shingle temperatures from lower ventilation.
We learned that the wind speed at a 10 m height is much higher than that just above the roof surface(3). The average wind velocity on the weather tower over the course of the summer was 5.30 mph (2.37 m/s) against 0.83 mph (0.37 m/s) measured ten inches (0.25 m) above the south side of the roof and 0.33 mph (0.15 m/s) above the north (leeward side of prevailing wind direction). The low velocities seen in Figure 12 have implications for the calculation of the roof surface convective heat transfer coefficient within simulation models. In particular, the very low values seen during evening hours suggest that radiative heat transfer to the night sky from the roof will be enhanced while daytime roof surface temperatures will be elevated from lack of convective heat transfer.
Conclusions
The finding that white roofing systems exhibited superior thermal performance was not unexpected. Field research in ten existing homes has shown that white roofing systems can reduce space cooling energy use by an average of 19% (Parker and Barkaszi, 1997). Similarly, other prior data has shown that tile roofs provide superior thermal performance to dark asphalt shingles(4). However, one of our most interesting findings is the superior thermal performance of the white tile roof; the attic in this configuration does not typically rise above ambient air temperature until after 2 PM in the afternoon. Moreover, the calculated ceiling flux data also revealed that the white tile roof provided best performance (76% flux reduction relative to a black shingle roof). The white metal roof was second best (61% flux reduction). All of the alternative roofing systems evaluated did show measurable improvements in both flux and attic temperature performance. Tile roofs showed both a reduction in peak attic air temperature as well as a 23% average reduction in the ceiling heat flux.
The FRF data indicates that white tile roofing system offers the best thermal performance in hot climates of those tested. An interesting aside is this conclusion echoes one fifty years earlier describing the overwhelming architectural preference after World War II for white tile roofs in South Florida prior to the advent of air conditioning (Langewiesche, 1950)(5). One important caveat to this conclusion from our study, however, is that the white standing seam metal roof provided nearly as good performance (and better during evening hours) and, based on observation of both roofing systems in application in Florida, will likely maintain its reflectivity for a longer period of time.
A remaining issue associated with white roofing systems, identified from our measurements, is their tendency to maintain greater moisture levels, both on the roof surface as well as the attic interior than with asphalt shingle roofing types. Detailed data have been collected which should allow improved modeling of key physical processes involved in the measured performance.
Acknowledgments
This work was sponsored by the Florida Energy Office in support of the Building Design Assistance Center. Their assistance is gratefully acknowledged. Special thanks to the Monier Tile Company and PDF Roofing for supplying roofing materials for the experiments. At FSEC, Armin Rudd assisted with the testing to evaluate the cell ventilation areas and Philip Fairey, Lixing Gu and Muthusamy Swami provided suggestions on the instrumentation. David Beal assisted with the project data acquisition system.
References
D. Beal and S. Chandra, 1995. "The Measured Summer Performance of Tile Roof Systems and Attic Ventilation Strategies in Hot, Humid Climates," Thermal Performance of Exterior Envelopes of Buildings VI, U.S. Dept. of Energy, Oak Ridge National Laboratory, American Society of Heating, Refrigerating and Air Conditioning Engineers and the Building and Thermal Envelope Council, Clearwater Beach, FL, December 4-8, 1995.
D.M.
Burch, G.A. Tsongas and G.N. Walton, 1996. Mathematical Analysis
of Practices to Control Moisture in the Roof Cavities of Manufactured
Homes, NISTIR 5880, National Institute of Standards and Technology,
Gaithersburg, MD.
J.B. Cummings, J.J. Tooley and N. Moyer, 1991. Investigation
of Air Distribution System Leakage and Its Impact in Central
Florida Homes, Florida Solar Energy Center, FSEC-CR-397-91, Cocoa,
FL.
T.J. Gillespie and G.E. Kidd, 1978. "Sensing Duration of Leaf Moisture Retention Using Electrical Impedance Grids," Canadian Journal of Plant Science, 58, p. 179-187.
R. Hageman and M.P. Modera, 1996. "Energy Savings and HVAC Capacity Implications of a Low-Emissivity Interior Surface for Roof Sheathing," Proceedings of the 1996 ACEEE Summer Study on Energy Efficiency in Buildings, Vol. 1, p. 117, American Council for an Energy Efficient Economy, Washington D.C.
D.A. Jump, I.S. Walker and M.P. Modera, 1996. "Measurements of Efficiency and Duct Retrofit Effectiveness in Residential Forced Air Distribution Systems," Proceedings of the ACEEE 1996 Summer Study on Energy Efficiency in Buildings, Vol. 1, p. 147, American Council for an Energy Efficient Economy, Washington D.C.
L. Gu, J.E. Cummings, M. V. Swami, P. Fairey and S. Awwad, 1996. Comparison of Duct System Computer Models that Could Provide Input to the Thermal Distribution Standard Method (SPC-152P), FSEC-CR-929-96, Florida Solar Energy Center, Cocoa, FL.
W. Langewiesche, 1950 "Your House in Florida," House Beautiful, January, 1950.
D.S. Parker and S.F. Barkaszi, Jr., 1997. "Roof Solar Reflectance and Cooling Energy Use: Field Research Results from Florida," Energy and Buildings 14, Elsevier Sequoia, Netherlands.
D.S. Parker, P.W. Fairey and L. Gu, 1991. "A Stratified Air Model for Simulation of Attic Thermal Performance," Insulation Materials: Testing and Applications, ASTM STP-1116, p. 44, American Society of Testing and Materials, Philadephia, PA.
D. Parker, P. Fairey and L. Gu, 1993. "Simulation of the Effects of Duct Leakage and Heat Transfer on Residential Space Cooling Energy Use," Energy and Buildings 20, p. 97-113, Elsevier Sequoia, Netherlands.
W.B. Rose, 1995. "The History of Attic Ventilation Regulation and Research," Thermal Performance of Exterior Envelopes of Buildings VI, U.S. Dept. of Energy, Oak Ridge National Laboratory, American Society of Heating, Refrigerating and Air Conditioning Engineers and the Building and Thermal Envelope Council, Clearwater Beach, FL, December 4-8, 1995.
A.F. Rudd, J. W. Lstiburek and N.A. Moyer, 1996. "Measurement of Attic Temperatures and Cooling Energy Use in Vented and Sealed Attics in Las Vegas, Nevada," Proceedings: ‘96 Excellence in Building Conference, Energy Efficient Building Association, Minneapolis, MN.
Wetherington, T.I., Jr., 1979. "Measure of Attic Temperatures in Florida," Proceedings, Workshop on Summer Attic and Whole House Ventilation, NBS SP 548, National Bureau of Standards, Washington D.C., July 19, 1978.
Wilkes, K.E., 1991. Thermal Model of Attic Systems with Radiant Barriers, ORNL/CON-262, Oak Ridge National Laboratory, Oak Ridge, TN.
1. Reducing heat
gain to the duct system and air infiltration from the attic is
so important that a specific roof construction where the insulation
is moved from the plane of the ceiling to the sloped roof, has
been demonstrated to reduce cooling energy use in homes in both
Florida and Nevada (Rudd et al., 1996).
2. The average
flux reduction was obtained by comparing the average ceiling
flux of each test cell over the entire summer against that for
the reference (#5).
3. Obviously,
the impact of local sheilding, and building geometry will vary
for other sites. However, since the FRF test area is fairly open,
the decrement in the roof top wind speed in more built-up suburban
areas may be even greater.
4. A comparison
paper (Sherwin and Parker, 1998) with collected attic temperature
data from a number of houses with different colored asphalt shingle
roofs show that although the performance of white asphalt shingles
is better than dark it is only marginally better due to high
solar absorptance (~75%) due to the dark substrate on nominally
white asphalt shingles.
5. This bit of
common wisdom was later supported by measurements made by Weatherington
(1979) for Florida Power Corporation in the late 1970's. He found
that all tile roofs exhibited lower attic temperatures than asphalt
shingle roofs, but temperatures in white tile attics were often
lower than ambient air temperatures (likely due to duct heat
transfer and/or leakage).
Prestented
at:
The 1998 ASHRAE Annual Meeting
June 20-24, 1998
Toronto, Canada
© 2007-2014 University of Central Florida. The Florida Solar Energy Center (FSEC)
is a research institute of the
University of Central Florida.
For more information about FSEC, please contact us or learn more about us.
Find us on Facebook!