

Reference Publication: Schrum, L., Parker, D., Floyd, D., "Daylight Dimming Systems: Studies in Energy Savings and Efficiency," Presented at The 1996 ACEEE Summer Study on Energy Efficiency in Buildings, Pacific Grove, CA, August 25-31, 1996. Disclaimer: The views and opinions expressed in this article are solely those of the authors and are not intended to represent the views and opinions of the Florida Solar Energy Center. |
Daylight Dimming Systems: Studies in Energy Savings and Efficiency
Florida Solar Energy Center (FSEC)
FSEC-PF-310-96
Abstract
Three studies were conducted at Florida Solar Energy Center (FSEC) to study the lighting energy savings of daylight dimming systems. The Daylighting Test Facility (DTF) was used to study daylight dimming systems and how aperture orientation and blinds affect performance. The energy consumption was compared in two pairs of offices for all four window orientations: north, south, east and west. One office in each pair had blinds in a fixed position (down and open) and the other office had no blinds. The study showed that the energy savings ranged from 24% to 51% depending on the orientation and blinds.
The second study conducted at the Lighting Flexible Test Facility (LFTF), compared two daylight dimming systems in identical side-by-side south facing offices. Five daylight dimming systems were tested to evaluate the system efficacy and energy reduction during daytime hours. Data on power consumption, power quality, and work-plane interior lighting levels were recorded. Daytime savings (8 AM - 5 PM) varied from 20% to 57% depending on the available daylight.
The third study, conducted at a new office facility building, studied how blinds and light shelves effect daylight dimming energy savings in offices designed for daylighting systems. Power consumption and work-plane interior lighting levels were compared in four identical south facing offices each with two spectrally selective windows. Two offices were configured with a light shelf, one with a white upper surface and the other with a reflective surface. One office had no window management strategy and the fourth office had blinds which were manually adjusted by the user. The study showed that the energy savings ranged from 33% to 53% depending on the window configuration.
Introduction
Prior to 1900, most buildings were "daylit" in the sense that daylight was the major source of daytime illumination. Due to the electricity use and increased cooling load that is created by electric lighting, there is a renewed interest in daylighting commercial buildings. Numerous theoretical studies have shown significant potential for energy savings in daylit buildings (Zonneveldt & Pernot 1994).
One type of dynamic lighting control system that offers energy savings is the continuous dimming system which constantly adjusts the electric lighting level based on the amount of daylight available. A continuous dimming system consists of a photosensor that provides the control signal that is used by the dimming electronic ballast to vary the light level according to changes in daylight availability. These systems are attractive since they reduce the use of electric light automatically without occupant intervention.
Significance of the Problem
The use of automatic daylight controls and potential energy savings has been studied (Crisp 1977), but the position of the blinds was not taken into account. Studies on window blind usage show that people use window blinds to block solar radiation (both as a source of localized overheating as well as glare) (Rea 1984; Rubin et al. 1987). However, typically occupants did not change blind positions during the period within a single day. Preference for window blind position appears based on long-term perceptions of solar radiation or other factors. Other considerations such as privacy and security may be ancillary concerns.
Actual savings may vary dependent on the window orientation and window management strategies. A study conducted by Lawrence Berkeley Laboratory (Rubinstein 1991) showed the metered energy savings were less in the south daylit zone than in the north daylit zone due to the occupants using drapes to reduce glare and thermal discomfort on the south orientation. A National Bureau of Standards study (Treado & Kusuda 1980) found that window area does not influence lighting load as strongly as the type of window system. A window system may include window coatings, external shading devices, and internal shading devices such as blinds or light shelves.
Recently, high quality third-party research data has become available on comparative lighting system component performance from the Lighting Resource Center (LRC) at Rensselaer Polytechnic Institute (Davis & Wolsey 1991). Rated power consumption for various lamps and ballasts on a component basis can be obtained from LRC specifier reports or manufacturers. Unfortunately, the combined component in situ performance of daylight controls for lighting systems as installed in offices is not readily available. Further, a recent series of field tests of daylight dimming systems have been performed, with each showing both the importance of window fenestration and system tuning to the ultimately realized performance (Benton & Fountain 1990; Reed et al. 1994; Floyd & Parker 1994).
The limited research performed so far underscores the need for a more rigorous evaluation of the effects of orientation and window management strategies on daylighting system performance. The purpose of these three studies is to evaluate the electric lighting energy usage of offices with windows and a continuous dimming system.
Daylighting Test Facility
Test site description
The test site, the Daylighting Test Facility (DTF), is located at the Florida Solar Energy Center, Cape Canaveral, Florida. Eight offices are located within the test site. The offices vary in size, number of windows and window orientation. The carpeted rooms contain work desks and other office furnishings germane to the typical office environment. The test facility can be rotated so that the north- and south-facing windows become east- and west-facing windows. Figure 1 shows an exterior view of the facility. Figure 2 shows an interior view of an office.
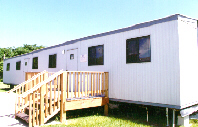
Figure 1. The Daylighting Test Facility (DTF)
was used to collect data on
offices with windows, blinds, and daylight
dimming ballasts.
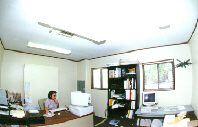
Figure 2. Interior of an office at the DTF
where daylight dimming was studied.
The office has north-facing windows.
The windows are 0.84 m x 0.71 m (2'9" x 2'4") and consist of double pane clear glass 1/8" thick with a light gray tint (visible transmittance = 0.67). Each window has one-inch mini-blinds that are white. The blinds remained fixed to eliminate occupant related variation. The blinds remained down and the slats at 90 degrees. All offices have blinds except two which were intentionally left without blinds to examine their relative effect.
Electric lighting system
Each office has two or three two-lamp ceiling-mounted wrap-around prismatic fluorescent luminaires. Two T-8 lamps and one integrally controlled electronic ballast are used in each luminaire. Manufacturer's data suggest that the ballasts can be dimmed over a range from 100% to approximately 20% of full power. The luminaires are four feet on center and operate on 120 VAC. The lighting design setpoint for each office was approximately 500 lux (50 footcandles). The dimming photosensor is a ceiling mount, low voltage photocell which interfaces with an electronic ballast. An analog output to the control ballast provides a dimming range from 10% to 100% illumination output.
Measurements
The lighting power and current are individually monitored with watt-hour transducers with a current transformer to supply the input. Light levels in the offices are monitored with a photometer. One photometer is mounted in each office at desktop height, two-thirds away from the window wall. The photometers were mounted directly below the ceiling-mounted ambient sensor used by the dimmable lighting system to control the electric light levels. All measured values are recorded using a multichannel datalogger (12-bit precision).
Experimental procedure
Data for the north and south-facing offices were collected for four months (September - December) to cover half the seasonal daylight availability cycle. At the end of this cycle, the DTF was rotated 90 degrees so that the windows are oriented east and west, respectively. This was accomplished on January 11, 1995. Data were collected for the east- and west-facing offices for four months (January-April). Figure 3 shows an illustration of a sample plot for October 13, 1994.
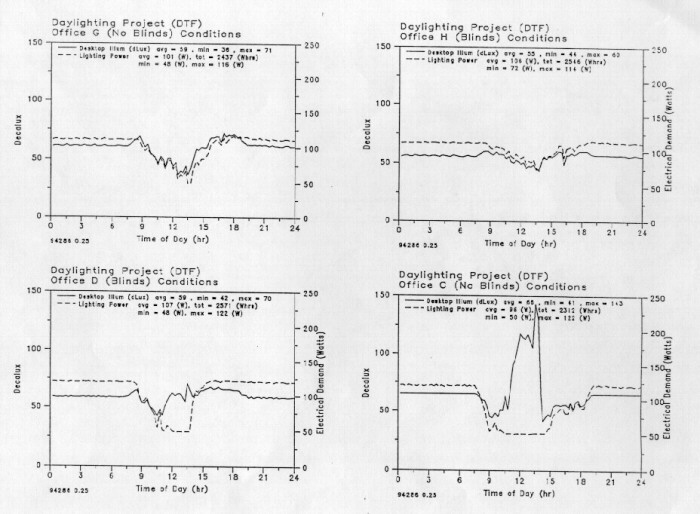
Figure 3. Daylighting Test Facility Data for October 13, 1994.
Discussion of measured results
The energy reduction ranged from 22% - 51% depending on orientation and blind condition. The east-facing office with no blinds had the lowest power consumption over the test period with a 51% energy reduction of the period. The blinds evidence a 7% effect on the energy savings for the both the north-and south-facing offices. For the east-facing office, the blinds had a 18% effect on power consumption. The west-facing offices did not yield expected results due to the dimming system control not functioning properly in the office without blinds. Table 1 and Table 2 shows a summary of the percent energy reduction for each orientation and blind condition. Additional detail on this study is provided in another publication (Schrum & Parker 1996).
Table 1. Percent Energy Reduction*
North and South Offices
| Month | |||||
| Condition | Sept | Oct | Nov | Dec | Total |
| North-NoBlinds | 42% |
30% |
30% |
21% |
31% |
| North-Blinds | 35% |
19% |
25% |
18% |
24% |
| South-No Blinds | 54% |
47% |
42% |
37% |
45% |
| South-Blinds | 48% |
39% |
38% |
26% |
37% |
* Energy reduction is based on asssuming the lights would have been on continuously between the hours of 6 AM and 6 PM. The baseline data was taken as an average of the system wattage between the hours of 10 PM and 6 AM.
Table 2. Percent Daily Reduction*
East and West Offices
| Condition | Jan | Feb | Mar | Apr | Total |
| East-No Blinds | 44% |
47% |
49% |
51% |
48% |
| East-Blinds | 22% |
27% |
32% |
37% |
30% |
| West-No Blinds | 28% |
31% |
32% |
34% |
31% |
| West-Blinds | 33% |
33% |
34% |
41% |
35% |
* Energy reduction is based on assuming the lights would have been on continuously between the hours of 6 AM and 6 PM. The baseline data was taken as an average of the system wattage between the hours of 10 PM and 6 AM.
Lighting Flexible Test Facility
LFTF configuration
The LFTF consists of two identical 2.7 m x 3.7 m (9' x 12') side-by-side offices located at Florida Solar Energy Center (FSEC). The 2.4 m (8') dropped ceilings are standard acoustical tile with recessed lighting fixtures. The lighting system consisted of two 2-lamp fluorescent fixtures. Each office contains two 0.76 m x 1.4 m (2.5' x 4.5') double-glazed south-facing windows. Each window has typical one-inch mini-blinds which are maintained in a half-open configuration. The carpeted rooms contain work desks and other office furnishings germane to the typical office environment; the layout in each office is a mirror image of the other. The lighting system is conventional, but was set up to allow change-outs of ballasts and lamps. Each luminaire has identical placement within the office geometry. Figure 4 shows the LFTF configuration.
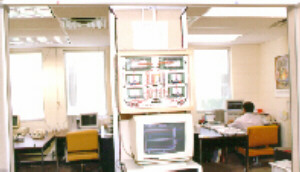
Figure 4. Lighting Flexible Test Facility (LFTF) configuration
Measurements
Accurate measurements are key to comparative evaluation of fixture power consumption, power quality and achieved work plane illuminance levels. The electrical consumption characteristics were measured for the fixtures in each office. Measurements include true watts, current, voltage, and power factor.
Lighting levels were measured at the work plane level 0.76 m (2.5') at front, middle and rear of the offices at equidistant points. Photometers were located along the center line of each office between the two windows. None of the photosensors are located directly under a lighting fixture.
Comparison of a conventional system and daylight dimming system
Several studies have shown that proper placement of photometric sensors and associated control system can greatly effect realized system performance (Verderber & Rubinstein 1989; Rubinstein 1991). However, no study had evaluated the in situ performance of a daylighting dimming system when retrofitted into a perimeter office with sensor placement dictated by the installation instructions. In March, 1993, a test was staged at the LFTF with the intent of comparing the advanced daylighting system to that of the most common conventional office system in current use.
During the test, the left office contained a conventional lighting system found in many offices. Each of the two 2-lamp fluorescent fixtures consisted of a standard white troffer and prismatic diffuser with two F34T12 lamps each driven by a standard energy-efficient magnetic ballast. The right office contained the advanced daylighting system. This comprised of an open parabolic troffer with a reflector, two F32T8 lamps each driven by an electronic ballast and a ceiling-mounted photometric sensor to provide continuous dimming in response to ambient daylight. The fiber optic photometric sensors were installed in the ceiling one third of the distance into the room and adjacent to the fixtures according to the manufacturer's recommendations.
Overall energy use of the two fixture dimming T8 system at 94 watts is 40% less than that of the standard T12 system at 157 Watts. Moreover, during the daytime hours between 8 AM and 5 PM when offices are typically occupied, the reduction is 66% (88 watt savings). The dimming response of the T8 system reduced power use by 40% relative to its demand under nighttime conditions. The nighttime difference in power use between the two systems was 29% (45 watts). This reflects the difference in the efficiency of the electronic ballast and T8 lamps in the right office over the T12 lamps with a magnetic ballast in the left. Figure 5 shows data collected for March 12, 1993 under clear and sunny conditions.
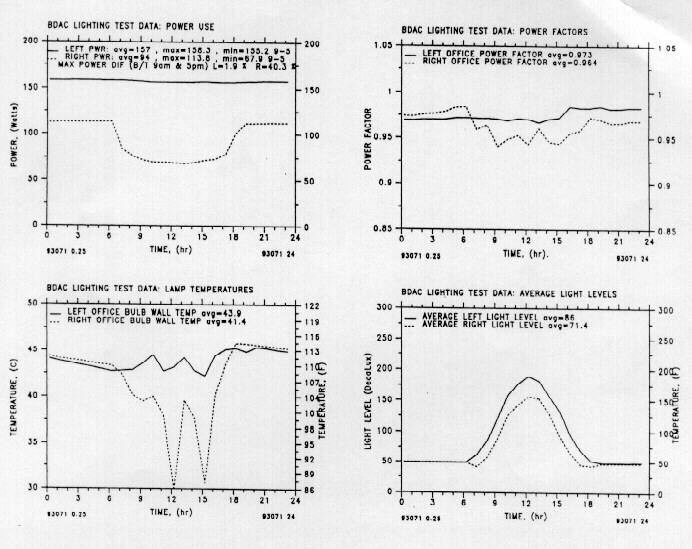
Figure 5. Daylighting System Performance: Right = F32T8 lamps with
dimming electronic ballast. Left = F34T12 lamps with standard magnetic
ballast.
Dimming of the T8 system shows very slight reductions to power factor, but overall excellent power quality characteristics. Work plane illuminance is virtually identical during evening hours (~50 decalux). Lighting levels in both offices are more than adequate during daytime (8 AM - 5 PM) conditions. The difference in light levels between the left and right office between 7 AM and 6 PM is due to response of the T8 dimming system to available daylight. The lighting design setpoint for each office was approximately 500 lux (50 footcandles).
Side-by-side comparison of daylight dimming systems
A second phase of daylight dimming testing, to evaluate the influence of different photometric control sensors, began in September, 1994 and was completed in December 1994. Five daylight dimming systems were tested to evaluate the system efficacy and energy reduction during daytime hours. Each office was configured with one prismatic and one parabolic luminaire. One photometric sensor was installed in each office and the T8 lamps were driven by a continuously dimming ballast. In each of the tests except one, the same ballast was used throughout the test phase. Data were collected for one week on each photometric sensor.
Daytime savings (9 AM - 5 PM) varied from 20% to 57% depending on the available daylight. The light levels fluctuated between daytime and nighttime hours. Some sensors were consistently about 50 decalux during all hours, but would vary as much as 60% during a second test. When the variation occurred, the daytime light level was higher than the nighttime readings. In general, we found that setting the light level adjustment at night would not prevent daytime light levels from consistently exceeding this target.
Uniformly among the various vendors, researchers found the controls difficult to calibrate due to a number of problems. Instructions supplied by the manufacturers on proper adjustment of the photosensor were totally inadequate. Calibration could only be successfully performed during evening hours and it was difficult to adjust the photosensors to the illuminance level with any accuracy. The calibration was a trial and error process due to lack of knowledge of the photosensor sensitivity range. For example, turning the set potentiometer too high can result in poor dimming response. We did find differences between the various controls, but none had a satisfactory set-up protocol. This has important implications for real-world systems: if patient researchers had difficulty with the set-up of controls, then most installers would be very unlikely to achieve reasonable equipment performance.
Blinds and Light Shelf Study
Test site description
A test site located at the new FSEC facility in Cocoa, Florida was used to examine achievable dimming performance levels with offices and window systems designed for daylighting application. In the study, four identical south-facing offices were monitored to study how blinds and light shelves effect daylight dimming energy savings. Each 4.3 m x 3.7 m (14' x12') size office contains two 1.53 m x 1.53 m (5' x 5') spectrally selective windows (visible transmittance = 0.56, shading coefficient = 0.33) and a four foot exterior light shelf. The carpeted rooms contain work desks and other office furnishings germane to the typical office environment.
Electric lighting system
Each office has two two-lamp deep cell parabolic fluorescent luminaires. Two T8 lamps and one integrally controlled electronic ballast are used in each luminaire. The dimming photosensor is a ceiling mount, low voltage photocell which interfaces with an electronic ballast. Each office also has one wall mounted infrared occupancy sensor which interfaces with the daylight dimming system. The occupancy sensor control was defeated for the duration of the study to prevent usage differences for influencing the dimming results.
Window management strategies
Two of the offices have an 0.87 m x 3.1 m (2'10" x 10') interior horizontal light shelf at a height of 2.2 m (7'2"); one with a white finish and the other with a reflective upper surface. A third office has one-inch white mini-blinds which can be manually adjusted by the user. The fourth office has windows only with no interior light shelf or blinds. Figure 6 and 7 show the office with a light shelf and blinds, respectively.
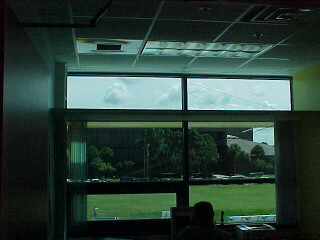
Figure 6. Interior of an office where daylight dimming and window
managemant strategies were studied. The office has south-facing windows
with a light shelf.
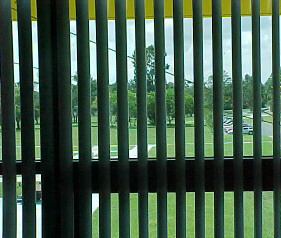
Figure 7. Interior of an office with south facing-windows and blinds.
Measurements
The lighting power and current are individually monitored with watt-hour transducers with a current transformer to supply the input. Light levels in the offices are monitored with four photometers. Photometers are mounted in each office at desktop height, at equidistant points between the window and wall. The photometers were mounted directly below the ceiling-mounted ambient sensor used by the dimmable lighting system to control the electric light levels. All measured values are recorded using a dedicated datalogger with data collected for the four offices from March 15 to April 23, 1996. Figure 8 shows data collected for March 15, 1996 under clear and sunny conditions.
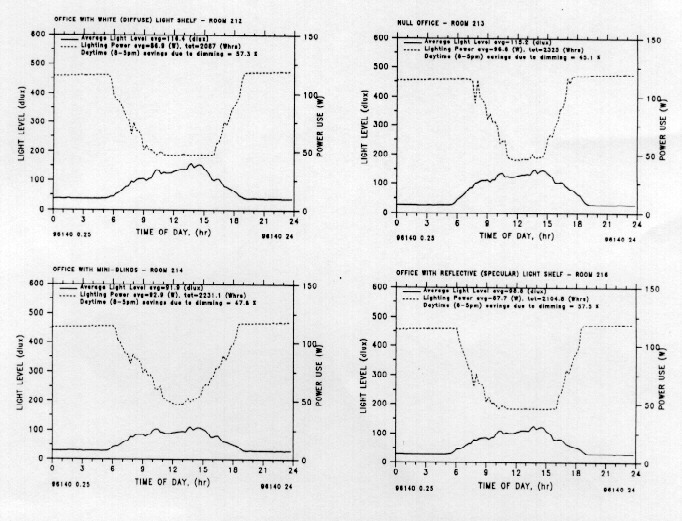
Figure 8. Blinds and light shelf data for March 15, 1996.
Discussion of measured results
Daytime savings (8 AM to 5 PM) ranged from 33% to 53% depending on the window condition. The two offices with light shelves both had a 53% energy reduction for the period. The light shelf with the reflective upper surface did not provide additional savings when compared with the white surface light shelf. The office without blinds or a light shelf had a 38% reduction in energy savings due to the dimming system. The office with blinds, which were adjusted by the occupant had a 33% reduction in energy savings. The results suggest several important conclusions.
- Properly designed offices with spectrally-selective glazings can realize up to a 50% reduction in lighting energy use from daylight dimming systems.
- Interior light shelves provide measurable improvements in dimming system response with pronounced reductions to glare.
- Interior blinds can significantly degrade dimming system performances.
Summary
The three studies show that daylight dimming systems can provide significant energy savings. The DTF energy savings ranged from 22% to 51% depending on the orientation and whether the office had blinds. The east-facing office with no blinds had the highest energy reduction of 51%. The east-facing office with blinds had the lowest monthly energy reduction of 22%. Although the blinds were fixed, they had a 7% average reduction on the energy savings for both the north and south-facing offices. The east-facing offices had an 18% reduction. The data taken one month after the blind condition was switched in the west-facing offices indicate that the orientation's energy reduction may be similar to the east-facing offices.
The LFTF study showed an energy reduction of 40% due to dimming when comparing a T8/electronic daylight ballast to a F34T12/magnetic ballast system. Five other daylight dimming systems compared in a side-by-side test showed daytime savings from 20% to 57%.
The blind and light shelf study with offices designed for daylighting showed an energy reduction ranging from 33% to 53% depending on the window management strategy. The offices with light shelves had the highest energy reduction of 53%, while the office with blinds had the lowest reduction of 33%.
References
Benton, C.C. and Fountain, M., 1990. "Successfully Daylighting a Large Commercial Building: A Case Study of Lockheed Building 157," Progressive Architecture, November 1990.
Crisp, V.H.C., 1977. "Energy Conservation in Buildings: A Preliminary Study of the Use of Automatic Control of Artificial Lighting," Lighting Research and Technology, Vol. 9, No. 1, pp. 31-41.
Davis, R.G. and Wolsey, R.A., 1991. "Guide to Performance Evaluation of Efficient Lighting Products," Lighting Research Center, Rensselaer Polytechnic Institute, Troy, NY.
Floyd, D.B. and Parker, D.S.1994. "Field Commissioning of a Daylight Dimming System," In Proceedings of Right-Light Three, 3rd European Conference on Energy Efficient Lighting, Newcastle on Tyne, U.K.
Rea, M.S., 1984. "Window Blind Occlusion: a Pilot Study," Building and Environment, Vol. 19, No.2, pp. 133-137.
Reed, J., Caldwell, B., Mapp, J., White, S. and Hall, N., 1994. "Energy Savings from an Active Daylighting Retrofit and Impact on Building Practices," In Proceedings of the 1996 Summer Study on Energy Efficiency in Buildings, Vol. 3, p. 217, ACEEE.
Rubin, A.I., Collins, B.L., Tibbott, R.L., 1987. "Window Blinds as a Potential Energy Saver - A Case Study," NBS Building Science Series 112, National Bureau of Standards, Washington, DC.
Rubinstein, F., 1991. Automatic Lighting Controls Demonstration: Long-term Results, LBL-28793 Rev. UC350, Lawrence Berkeley Laboratory, University of California, Berkeley, CA.
Rubinstein, F.M., 1991. Automatic Lighting Controls Demonstration: Long Term Results, Report 008.1-92.21, Pacific Gas and Electric, San Ramon, CA.
Schrum, L. And Parker, D.S., 1996. "Daylight Dimming and Energy Savings: The Effects of Window Orientation and Blinds," In Proceedings of the 1996 International Soalr Conference, Solar Engineering, p, 507, ASME.
Treado, S. and Kusuda, T., 1980. Daylighting, Window Management Systems, and Lighting Controls, National Bureau of Standards, NBSIR 80-2147.
Verderber, R.R. and Rubinstein, F.M and Ward, G., 1989. Photoelectric Control of Daylight Following Lighting Systems, CU-6243, Electric Power Research Institute, Palo Alto, CA.
Zonneveldt, L., Pernot, C.E.E., 1994. "Energy Savings by Optimal
Use of Daylight," CADDET Energy Efficiency Newsletter, No. 4/1994,
pp.7-9.
Presented At:
1996 ACEEE Summer Study on Energy Efficiency in Buildings
August 25-31, 1996
Pacific Grove, CA
© 2007-2014 University of Central Florida. The Florida Solar Energy Center (FSEC)
is a research institute of the
University of Central Florida.
For more information about FSEC, please contact us or learn more about us.
Find us on Facebook!