

Reference Publication: Floyd, D., Parker, D., "Measured Performance of Energy-Efficient Computer Systems," Presented at The Tenth Symposium on Improving Building Systems in Hot and Humid Climates, Fort Worth, Texas, May 13-14, 1996. Disclaimer: The views and opinions expressed in this article are solely those of the authors and are not intended to represent the views and opinions of the Florida Solar Energy Center. |
Measured Performance of Energy-Efficient Computer Systems
Florida Solar Energy Center (FSEC)
FSEC-PF-303-96
Abstract
The intent of this study is to explore the potential performance of both Energy Star computers/printers and add-on control devices individually, and their expected savings if collectively applied in a typical office building in a hot and humid climate.
Recent surveys have shown that the use of personal computer systems in commercial office buildings is expanding rapidly. The energy consumption of such a growing end-use also has a significant impact on the total building power demand. In warmer climates, office equipment energy use has important implications for building cooling loads as well as those directly associated with computing tasks.
 Recently,
the Environmental Protection Agency (EPA) has developed an Energy Star
(ES) rating system intended to endorse more efficient equipment. To
research the comparative performance of conventional and low-energy
computer systems, four Energy Star computer systems and two computer
systems equipped with energy saving devices were monitored for power
demand. Comparative data on the test results are summarized. In addition,
a brief analysis uses the DOE-2.1E computer simulation to examine the
impact of the test results and HVAC interactions if generically applied
to computer systems in a modern office building in Florida's climate.
Recently,
the Environmental Protection Agency (EPA) has developed an Energy Star
(ES) rating system intended to endorse more efficient equipment. To
research the comparative performance of conventional and low-energy
computer systems, four Energy Star computer systems and two computer
systems equipped with energy saving devices were monitored for power
demand. Comparative data on the test results are summarized. In addition,
a brief analysis uses the DOE-2.1E computer simulation to examine the
impact of the test results and HVAC interactions if generically applied
to computer systems in a modern office building in Florida's climate.
Introduction
Since the mainstream introduction of the personal computer (PC) and related office equipment in the early 1980s, office appliance use has increased dramatically. According to the Environmental Protection Agency (EPA), personal computers and office equipment are the fastest growing new electrical load in the commercial sector. They account for five percent of commercial electricity consumption¾ and this number could grow to ten percent by the year 2000.
In order to curtail this trend the EPA, the European Commission, and JEIDA (Japan's computer manufacturers' trade association) have each established voluntary labeling programs that identify "energy efficient" equipment. Each of these three programs are based on identical standards, testing methods and assessment procedure, and will use the same logo or label for the purpose of identifying qualified products (Bertoldi, 1994).
To qualify for this program PCs, monitors and printers must have the capability of going to a low power mode after a period of inactivity. The maximum power consumption cannot exceed 30 watts in low power mode for PCs and monitors, and 30 to 45 watts for printers.
PCs can be designed to save energy by selectively switching off or "powering down" system hardware. Monitors can be configured to enter into various power management modes from "screen blanking" to complete turn off. Computers can be designed with more efficient hard disk drives, variable speed cooling fans, low voltage CPUs. Computers can also be designed to save energy by shutting down the hard disk drive, CPU, communication ports and peripherals after a user designated period of inactivity. Users can set various levels of energy savings by modifying the system BIOS at startup or through software.
There are also numerous ES compliant add-on devices available to reduce office equipment loads without internal power saving capabilities. All of these controls completely switch off equipment, and consequently have a longer lag time than internal devices. However, many of these devices can offer increased savings since they can control additional office plug loads such as fans, task lights, etc. Most of these controls monitor keyboard/mouse activity, communication ports and/or occupancy to switch loads. Users can often configure the device to meet their specific needs. (Stickney and Lovins, 1992).
Prior Research
Recent surveys have shown that the use of personal computer systems in commercial office buildings is expanding rapidly. The energy consumption of such a growing end-use also has a significant impact on the total building power demand. In warmer climates, office equipment energy use has important implications for building cooling load hundred computers and peripherals to be only 0.3 W/ft2 ¾ much lower than the 1.3 W/ ft2 calculated from the nameplate ratings. Similarly, Patel et al. (1993) found that a PC with a nameplate rating of 252 W actually only used 146 W in use and 143 W when idle. A laser printer in the same study with a nameplate power rating of 900 W used only 575 W when printing and 31 W when idle.
More recently, Szydlowski and Chvala (1994) performed a thorough monitoring of 222 workstations over one week periods. In their study, CPUs were found to consume 85 W, monitors 60 W, and peripherals 29 W. The average PC workstation was found to have a hat-shaped daily demand curve with a baseload of 18 % and a peak load of 76 %. They also tested a device on 11 workstations which turns off monitors during periods of keyboard inactivity. A 21 % demand reduction and a 34 % overall savings were realized from a conservative sample of PCs that are normally turned off after hours.
Research of ES computers systems and printers, and related add-on
devices to reduce electrical demand of office equipment has not received
as much attention. The first published case study was conducted by
FSEC (Lapujade and Parker, 1994) where a non-Energy Star CPU, monitor
and laser printer were monitored for 86 days and then replaced with
ES compliant equipment for an equivalent time period. In the study,
an average daily demand profile was generated for each piece of equipment
and savings were calculated. The ES CPU, monitor and printer were found
to save 16.6 %, 25.8 %, and 37.5 % respectively.
Methodology
This project expands on the above described study conducted at FSEC and considers collected data from four ES computer systems and two non-ES computers equipped with external add-on energy saving devices1. This study, however, does not use a before and after monitoring protocol like the previous study. Instead, all computer systems are monitored with the power saving features enabled for a period of at least four weeks so that fluctuations in work load would be minimized. Then, the electrical demand for the same system with the power savings disabled is simulated.
Simulated demand is determined by replacing power readings when the system is "powered down" with full power readings according to proposed guidelines for such evaluation (Piette et al., 1994). For example, a printer would be monitored with the power saving feature enabled, then, the electrical demand measured in the full power state would be substituted for each reading when the monitor was idle. This curve would represent the same monitor with the power savings enabled and could be compared to the measured demand to determine savings. The advantage of this method, over monitoring the computer for two periods with and without the energy savings enabled, is that the usage patterns are identical.
Monitoring equipment consisted of a multi-channel datalogger and four watt-hour meters that recorded power for the monitor, printer, and computer every five seconds with integrated averages recorded every 15 minutes. Current draw was matched for each current transducer by winding the power wire 10 times to maintain watt-hour meters accuracy (± 0.5%) at full scale.
Users were also surveyed to determine work patterns and level of satisfaction
with the power saving feature. This information is useful to determine
user acceptability and the percentage of systems that arrive from the
manufacturer with the power savings disabled.
Results
Energy Star Computers
Table 1
ENERGY STAR SYSTEMS |
ADD ON |
||||
| Type | CPU | Monitor | Printer | PC | PC |
| Monitoring Length | 33 | 33 | 36 | 32 | 36 |
| Total Consumption (kWh) | 8.2 | 10.5 | 9.3 | 17.8 | 14.3 |
| Total Hours of Operation (including standby mode) | 202.4 | 221.6 | 166.6 | NA | 194.6 |
| Total Hours in Standby Mode | 65.3 | 89.3 | 98.1 | NA | 67.1 |
| Average Consumption per Day (kWh, all days) | 0.2 | 0.3 | 0.3 | 0.6 | 0.4 |
| Energy Consumption per Hour of Operation (Wh/hr) | 40.4 | 52.8 | 62.7 | NA | 75.7 |
| Estimated Annual Hours of Operation | 2251.5 | 2502.9 | 1767.9 | NA | 1937.8 |
| Estimated Annual Energy Consumption (kWh) | 88.6 | 115.5 | 96.7 | 203.4 | 143.2 |
| Estimated Annual Energy Savings (kWh) | 2.5 | 44.6 | 43.3 | 44.9 | 42.4 |
| Estimated Annual Energy Savings (%) | 3.2% | 39.1% | 44.4% | 22.1% | 29.6% |
| Estimated Annual Energy Savings ($, with $.1 per kWh) | $0.25 | $4.46 | $4.33 | $4.49 | $4.24 |
| Average Power in Use (W, non standby) | 51.8 | 74.0 | 89.1 | 125.2 | 90.6 |
| Average Power in Standby Mode (W) | 30.6 | 16.9 | 30.8 | 46.9 | 39.5 |
Figure
1 shows the average daily performance of the ES CPUs, monitors,
printers and PCs2 with
their power saving features both enabled and disabled (simulated).
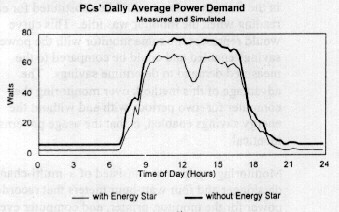
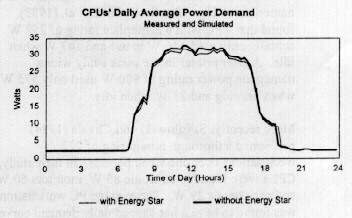
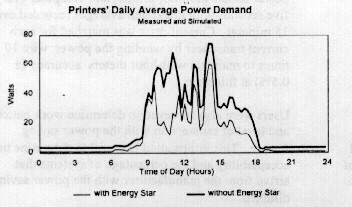
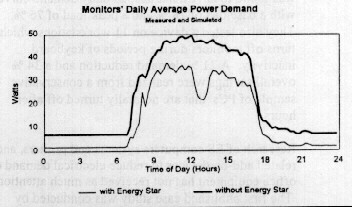
The collected data revealed instances when the equipment had been left on at night, however these instances were rare. Equipment that is frequently left on could achieve greater savings than the results shown here. The ES printers and monitors had the greatest average savings of 44% (43 kWh/yr.) and 39% (45 kWh/yr.) respectively. The CPUs, although, only exhibited minimal savings of 2.5%, 3 kWh/yr. Taken together, the average ES computer and monitor was estimated to save approximately 45 kWh/yr (22%). Results for the monitoring are summarized in Table 1 .
Add-On Devices
In addition to the ES computers that were monitored, two non ES compliant computers were equipped with two different add-on devices to power down the monitor and printer during idle periods. One device turns off both the printer and the monitor based on occupancy. The other device turns off the printer and monitor individually after a set period of inactivity. Inactivity is determined through communication port and keyboard/mouse monitoring.
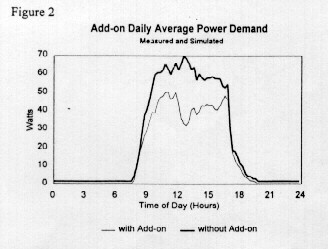
In Figure 2, the average power demand is shown for all PC workstations (CPU, monitor, and printer) with and without the add-on control devices. As seen in the graph in Figure 2, all of the 29.6% (42.4 kWh/yr) savings occurred during working hours since the users were diligent in turning off equipment at night. Larger savings are possible in situations where workstations are frequently left on during off-hours. While the savings of the add-on devices compares favorably with the ES compliant computers, it is important to note that these devices have a longer power up time since the controlled loads are completely turned off and must start cold. There is an advantage in that additional plug loads such as task lights, fans, or peripherals may also be controlled. Results for the monitoring are summarized in Table 1.
Simulated HVAC Interaction
In order to fully examine the impact that ES PCs have on the total load of a commercial building in a hot and humid climate, the load profiles (Figure 1) of the ES PCs with and without their power saving feature enabled were incorporated in a small hypothetical office building using DOE-2.1E. Imputs used for the simulation are as follows:
- 10,000 ft2 office building
- Orlando, FL. TMY weather data
- Base daily peak equipment load = .75 W/ft2 modified on an hourly schedule using the measured computer/printer load profiles
- 140 ft2 per workstation
- 70 workstations and 20 printers
If ES computers and printers were used in this building the total annual electricity use would have been reduced by 7,205 kWh or 4 %. This equates to a $576 annual cost savings (assuming $.08/kWh). 28 % of the total savings was due to the reduced cooling load. A 2 kW reduction in the average monthly peak building load was also achieved.
Conclusions
The monitoring of the four ES computers and the two computer systems with add-on devies proved the effectiveness of these devices to reduce electrical demand. All systems were monitored (power savings enabled) for four weeks. Instantaneous power readings were taken for the CPU, monitor, and printer, while idle, with the ES features enabled and disabled. These readings were later used to simulate each component in the non-power saving mode. Results for the CPU, monitor, printer and PC were then averaged for the ES computers (Figure 1) and the add-on devices (Figure 2). The greatest savings for the ES systems were achieved by the printers (44% or 43 kWh/yr.) and monitors (39% or 44 kWh/yr.). The CPUs themselves saved only 3% or 3 kWh/yr. The add-on control devices also performed well and saved 30% or 42.4 kWh on average.
Load profiles for an average ES computer and printer obtained through the monitoring were used to simulate the effects on the total load of a hypothetical commercial office building located in a hot and humid climate. Results indicated a modest savings of 4% (7,205 kWh) and a 2 kW reduction in peak demand. Unlike other energy saving strategies however, there is no premium for ES compliant equipment.
While savings for both the ES and the add-on control devices was demonstrated, it is important to note that these saving would only be achieved if all the computers were ES compliant (or incorporated an add-on device) and the power saving features were enabled. All the ES systems that were monitored in this study were shipped from the manufacturer with the ES features disabled and none of the users had enabled them. After the features were enabled, problems were encountered. Fast response time from the standby state is imperative for this technology to be used since company bottom lines are determined by both overhead (electrical costs) and worker productivity.
References
- Bertoldi, P., 1994 "European Commission Activities for
Energy Efficient Office Equipment", Energy-Efficient Office
Technology Conference, New York, New York, Oct. 17-19, 1994.
- Harris, J., J. Roturier, L.K. Norford, and A. Rabl, 1988. Technology
Assessment: Electronic Office Equipment, LBL-25558, Lawrence Berkeley
Laboratory, Berkeley, CA.
- Jacobs, P.C., C.E. Hancock, D. R. Roberts, D.N. Wortman, P.S. Reeves
and F.W. Porter, 1992. Engineering Methods for Estimating the Impacts
of Demand Side Management Programs, EPRI TR-100984, prepared by Architectural
Energy Corp., Electric Power Research Institute, Palo Alto, CA.
- Lapujade, P. and D. Parker. 1994. "Measured Energy Savings
of an Energy-Efficient Office Computer System." Proceedings
of the 1994 ACEEE Summer Study on Energy-Efficiency in Buildings,
Vol. 9. August.
- Norford, L., A. Hatcher, J. Harris and O. Yu, 1990. "Electricity
Use in Information Technologies," Annual Review of Energy, Vol.
15, 1990.
- Patel, R.F., P.W. Teagan and J.T. Dieckman, 1993. Characterization
of Commercial Building Appliances, Arthur D. Little, Inc., prepared
for Office of Building Technologies, U.S. Department of Energy, Washington
D.C.
- Piette, M. A., M. Cramer and C. Dandridge, 1994. Guidelines on
Measuring Energy Savings and User Acceptance of Energy-Efficient
Office Technologies, Lawrence Berkeley Laboratory and Massachusetts
Institute of Technology, Working Draft, June 28, 1994.
- Piette, M. A., M. Cramer, J. Eto, and J. Koomey,1995. Office Technology
Energy Use and Savings Potential in New York, Lawrence Berkeley Laboratory
for New York State Energy Research and Development Authority and
Consolidated Edison, June 1995.
- Stickney, B. and A. Lovins, "New Power Management Strategies
for Personal Computers and Other Office Equipment", E-Source
Tech Update , TU-92-2, September 1992.
- Szydlowski, R.F., and W.D. Chvala, Jr. 1994 Energy Consumption
of Personal Computer Workstations. PNL Report Number-9061, Pacific
National Laboratory, Richland, WA.
- Tiller, D.K. and G.R. Newsham, 1992. "Power Management for Desktop Personal Computers," Proceedings: Energy Efficient Office Technologies, EPRI RT-101945, Prepared by Policy Research Associates Institute, Palo Alto, CA.
1. Two
different devices were used: the WattStopperTM Isole' TM power
strip (turns off the printer, monitor and other loads when
an area becomes vacant) and the PC ener-g saverTM which powers
up devices (printer and monitor) based on demand signals from
the keyboard and communication ports.
2. PC average power demand is the total of the power demand (monitors and CPUs) for all four PCs. One PC was monitored for total power demand only and subsequently is not included in the monitor and CPU averages.
Presented
at:
Tenth Symposium on Improving Building Systems in Hot and
Humid Climates
Fort Worth, Texas
May 13-14, 1996
© 2007-2014 University of Central Florida. The Florida Solar Energy Center (FSEC)
is a research institute of the
University of Central Florida.
For more information about FSEC, please contact us or learn more about us.
Find us on Facebook!