

Reference Publication:Parker, D., Schrum, L., Sonne, J., Stedman, T., "Side-by-Side Testing of Commercial Office Lighting Systems: Two-lamp Fluorescent Fixtures," Presented at the Tenth Symposium on Improving Building Systems in Hot and Humid Climates, Texas A & M University, Fort Worth, TX, May 13-14, 1996. Disclaimer: The views and opinions expressed in this article are solely those of the authors and are not intended to represent the views and opinions of the Florida Solar Energy Center. |
Side-by-Side Testing of Commercial Office Lighting Systems: Two-lamp Fluorescent Fixtures
Florida Solar Energy Center (FSEC)
FSEC-PF-301-95
Abstract
Lighting systems in commercial office buildings are primary determinants of building energy use. In warmer climates, lighting energy use has important implications for building cooling loads as well as those directly associated with illumination tasks. To research the comparative performance of conventional and advanced office lighting systems, Florida Solar Energy Center (FSEC) set up the Lighting Flexible Test Facility (LFTF) which allows side-by-side comparison of lighting options in two otherwise identical 2.7 m x 3.7 m (9' x 12') south facing offices.
The ceiling of the LFTF contains 0.61 m x 1.2 m (2' x 4') recessed fluorescent fixtures designed to be easily changed. Differing lighting systems were comparatively tested against each other over week-long periods. Data on power consumption (watts), power quality (power factor), work-plane interior lighting levels (lux), bulb-wall, fixture and plenum temperatures were recorded every 15 minutes on a multi-channel data logger. This data allows realistic analysis of comparative lighting system performance including interactions with daylighting.
Introduction
A recent study for the state of Florida found that 33% of direct
electricity use in commercial office buildings in the state is due
to lighting [1]. Furthermore, simulation analysis at the Building Design
Assistance Center (BDAC) using DOE2.1D found that lighting at 2.0 W/ft2
represented 27% of the Florida office building's cooling load and was
responsible for 49% of the overall predicted annual electricity consumption.
Given these facts, it is not surprising that the lighting industry
endeavors to improve the relative energy efficiency of lighting sources
and fixtures.
Recently, high quality third-party research data has become available on comparative lighting system component performance from the Lighting Resource Center (LRC) at Rensselaer Polytechnic Institute [2]. Photometric data on fixture performance is often available for particular combinations of lamps and luminaires. Rated power consumption for various lamps and ballasts on a component basis can be obtained from LRC specifier reports or manufacturers. Unfortunately, the combined component in situ performance of lighting systems as installed in offices is not readily available. To meet this need, FSEC created two side-by-side offices to comparatively test many differing combinations of lamps, ballasts, fixtures and diffusers. The intent was to collect detailed high quality data on lighting system power consumption and illuminance levels under realistic conditions.
LFTF Configuration
The LFTF consists of two identical 2.7 m x 3.7 m (9' x 12') side-by-side offices located at Florida Solar Energy Center (FSEC). The 2.4 m (8') dropped ceilings are standard acoustical tile with recessed lighting fixtures. The lighting system consisted of two 2-lamp fluorescent fixtures. Each office contains two 0.76 x 1.4 m (2.5' x 4.5') double-glazed south-facing windows. Each window has typical one-inch mini-blinds which are maintained in a half-open configuration. The carpeted rooms contain work desks and other office furnishings germane to the typical office environment; the layout in each office is a mirror image of the other. Figure 1 shows the office configuration.
The lighting system is conventional, but was set up to allow change-outs of ballasts and lamps. Each luminaire has identical placement within the office geometry. The lighting system electrical supply is typical for a commercial facility with a 277 volt single-phase three wire system. The office lighting is controlled by conventional light switches. However, to obtain data on relative night-time illuminance levels, the office lighting was powered 24-hours a day.
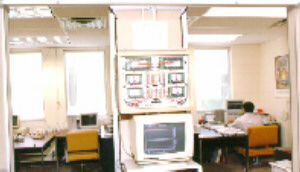
Figure 1. Lighting Flexible Test Facility (LFTF) configuration
Measurements
Accurate measurements are key to comparative evaluation of fixture power consumption, power quality and achieved work plane illuminance levels. Electrical measurements were made by high accuracy power transducers installed in-line between the 277 Volt power supply and the fixtures in each office. The electrical consumption characteristics were measured for the fixtures in each office. Measurements include true watts, current and voltage. The watt transducers are designed to accurately measure true root means square (RMS) power and current regardless of any current wave shape distortion. In addition to electrical demand (watts), power factor (ratio of true to apparent power; W/V*Va) was also measured since power quality is of increasing concern to utilities.
Lighting levels were measured at the work plane level 0.76 m (2.5') at front, middle and rear of the offices at equidistant points. Precision color and cosine corrected photometers were located along the center line of each office between the two windows. None of the photosensors are located directly under a lighting fixture. Two pyranometers were mounted on the offices' south exterior to record the incident solar radiation on the horizontal and vertical planes on building exterior. Measurement was also made on the interior of solar radiation passing through the glazing in each office.
Since fluorescent lighting system performance is sensitive to changes in ambient thermal conditions, temperatures were measured in three locations: lamp-wall temperature, fixture temperature (approximately one inch from the outer lamp) and plenum space temperature (approximately 0.1 m from the fixture). All measurements were taken with calibrated copper constantan thermocouples.
A multi-channel data logger (12-bit precision) scans all instrumentation every ten seconds with integrated averages output to storage on fifteen-minute intervals. The data logger is interrogated nightly by the FSEC main-frame computer which archives the data and also produces daily plots showing the 24-hour performance of the two systems under evaluation. The plots were examined by FSEC researchers each morning to ensure consistent and reliable results.
Test Protocol
Initial evaluation of the LFTF concentrated on verifying the similarity of the two side-by-side offices in terms of the measured illuminance from daylight without supplemental electrical lighting. A null test was performed on March 1, 1993, with the measured photometric response of the two offices compared to insure no indigenous differences in the two spaces during daytime hours. Figure 2 shows the results of the null test. The test gave confidence that the measured variation of the illuminance between the two test bays were due to the differences in the lighting systems and not in available daylight. The average minimum recommended lighting level in offices is on the order of 54 footcandles (~58 decalux) [3]. It is interesting to note that on a sunny day the average interior lighting levels, without any electric lighting, were generally greater than this level between 9 AM and 4 PM on March 1.
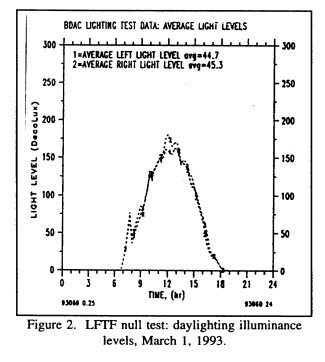
Table 1 describes the major parametric differences which were evaluated in the two-lamp fixtures.
Table 1
LFTF Test Parameters
| Lamps | Ballasts | Fixtures | Diffusers |
| F40T12 | |||
| F34T12 | |||
| F32T8 | |||
| F42T10 | |||
| F36T8 |
The tests necessary to evaluate all combinations for the major parameters amounted to some 124 configurations. In order to complete the evaluations, each fixture was tested over a relatively short time period. Each week the lighting system in each office was changed to another configuration. The time and date of the change and other particulars were entered into the test logbook. New lamps were seasoned for approximately 100 hours prior to testing. The reflector was a specular reflecting type; the open parabolic troffer had 18 cells.
Performance of a Daylight Dimming System
Comparison of a Conventional System and Daylight Dimming System
In buildings where daylight can serve as a useful source of illumination for perimeter offices, photoelectrically controlled lighting systems can significantly reduce electrical lighting requirements [4,5,6]. The fundamental intent is to vary the output of an electronic ballast to the lamps to maintain a more even interior lighting level and to save electricity when sufficient daylight is available. Several studies have shown that proper placement of photometric sensors and associated control system can greatly effect realized system performance [7,8]. However, no study, to our knowledge had evaluated the in situ performance of a daylighting dimming system when retrofitted into a perimeter office with sensor placement dictated by the installation instructions. In March, 1993, a test was staged at the LFTF with the intent of comparing the advanced daylighting system to that of the most common conventional office system in current use.
During the test, the left office contained a conventional lighting system found in many offices. Each of the two 2-lamp fluorescent fixtures consisted of a standard white troffer and prismatic diffuser with two F34T12 lamps each driven by a standard energy-efficient magnetic ballast. The right office contained the advanced daylighting system. This comprised of an open parabolic troffer with a reflector, two F32T8 lamps each driven by an electronic ballast and a ceiling-mounted photometric sensor to provide continuous dimming in response to ambient daylight. The fiber optic photometric sensors were installed in the ceiling one third of the distance into the room and adjacent to the fixtures according to the manufacturer's recommendations.
Figure 3 shows the LFTF collected data for Julian day 71, March 12, 1993, under clear and sunny sky conditions. Overall energy use of the two fixture dimming T8 system at 94 watts is 40% less than that of the standard T12 system at 157 Watts.
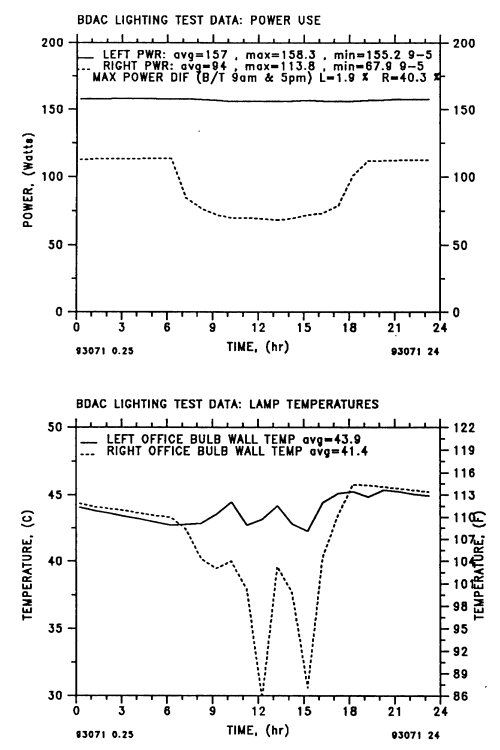
Figure 3a. Daylighting system performance: F32T8 lamps with dimming
electronic ballast.
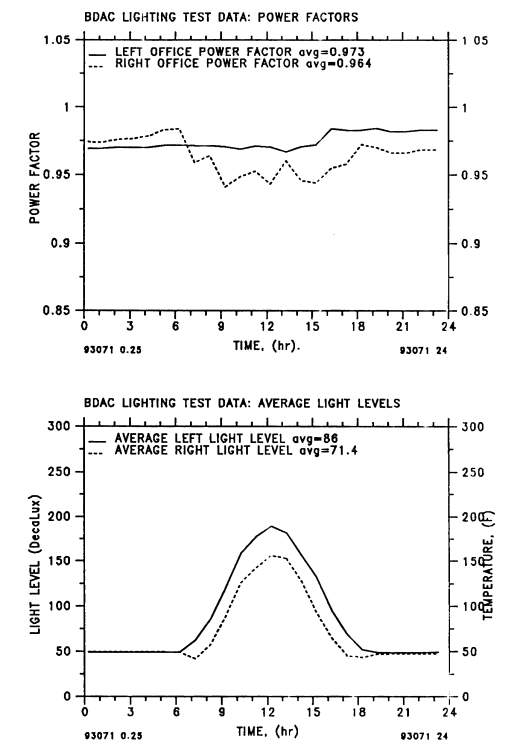
Figure 3b. Daylighting system performance: F34T12 lamps with standard
magnetic ballast.
Moreover, during the daytime hours between 8 AM and 5 PM when offices are typically occupied, the reduction is 66% (88 watt savings). The dimming response of the T8 system reduced power use by 40% relative to its demand under nighttime conditions. The nighttime difference in power use between the two system was 29% (45 watts). This reflects the difference in the efficiency of the electronic ballast and T8 lamps in the right office over the T12 lamps with a magnetic ballast in the left.
Dimming of the T8 system shows very slight reductions to power factor, but overall excellent power quality characteristics. Work plane illuminance is virtually identical during evening hours (~50 decalux). Lighting levels in both offices are more than adequate during daytime (8 AM - 5 PM) conditions. The difference in light levels between the left and right office between 7 AM and 6 PM is due to response of the T8 dimming system to available daylight. Average room lighting level was 50 decalux.
Side-by-Side Comparison of Daylight Dimming Systems
A second phase of daylight dimming testing was started in September, 1994 and completed in December 1994. Five daylight dimming systems were tested to evaluate the system efficacy and energy reduction during daytime hours. Each office was configured with one prismatic and one parabolic luminaire. One photometric sensor was installed in each office and the T8 lamps were driven by a continuously dimming ballast. In each of the tests except one, the same ballast was used throughout the test phase. Data were collected for one week on each photometric sensor.
Daytime savings (9 AM - 5 PM) varied from 20% to 57% depending on the available daylight. The light levels fluctuated between daytime and nighttime hours. Some sensors were consistently about 50 decalux during all hours, but would vary as much as 60% during a second test. When the variation occurred, the daytime light level was higher than the nighttime readings.
Researchers found the systems difficult to calibrate due to a number of problems. Instructions supplied by the manufacturer on proper adjustment of the photosensor were found to be inadequate. It was difficult to adjust the photosensors to the illuminance level with any accuracy. The calibration was a trial and error process because researchers did not know the photosensor sensitivity range. For example, turning the set potentiometer too high can result in poor dimming response.
Test Results
The test results for the systems are summarized in Tables #2-#7.
F40 T12 fixtures |
F40 T12 fixtures |
F34 T12 fixtures |
F32 T8 fixtures |
F32 T8 fixtures |
F42 T10 fixtures |
Data are provided for power consumption, average illuminance levels, power quality and temperature conditions as segmented into day and night periods. The daytime values show the illuminance and power consumption levels during periods with available daylight from the south facing windows in each office. The nighttime data shows the results in the absence of daylight and would be appropriate for non-daylit office applications and for nighttime lighting tasks. The system efficacies (decalux/watt) are graphically summarized in Figures 4 and 5.
| Decalux per Watt |
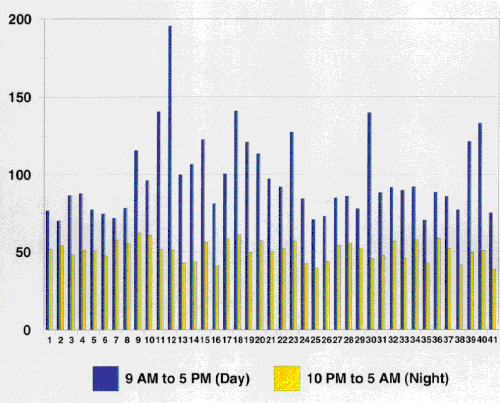 |
| Fixture Configuration Tested (see details below) |
|
| Figure 4. 1993 LFTF Test Results in decalux/Watt. |
| Fixture Configurations | ||
| 1 = T8-32 M Pris-Ref | 16 = T12-40 M Pris | 31 = T10 M Pris |
| 2 = T10 M Par-Ref | 17 = T10 E Par-Ref | 32 = T8-32 ET Par-Ref |
| 3 = T8-32 M Pris | 18 = T10 E Pris-Ref | 33 = T10 M Pris-Ref |
| 4 = T12-34 E Par-Ref | 19 = T12-40 E Par-Ref | 34 = T8-32 ET Par |
| 5 = T12-40 E Pris-Ref | 20 = T10 E Pris | 35 = T12-34 M Pris |
| 6 = T8-32 M Par | 21 = T12-40 E Par-Ref | 36 = T8-32 E Par-Ref |
| 7 = T8-36 E Pris | 22 = T8-32 E Pris | 37 = T8-32 E Par |
| 8 = T8-32 M Par-Ref | 23 = T8-32 E Pris-Ref | 38 = T12-34 M Pris-Ref |
| 9 = T8-80 E Pris | 24 = T12-40 M Par | 39 = T8-32 ED Par |
| 10 = T8-36 E Par | 25 = T12-34 M Par-Ref | 40 = T8-32 ED Pris-Ref |
| 11 = T8-32 ED Pris | 26 = T12-40 MD Par | 41 = T12-34 M Par |
| 12 = T8-32 ED Pris | 27 = T12-40 E Pris | |
| 13 = T12-40 M Par-Ref | 28 = T12-34 E Pris | |
| 14 = T12-40 M Pris-Ref | 29 = T12-34 E Par | |
| 15 = T10 E Par | 30 = T8-32 ED Par-Ref | |
| Decalux per Watt |
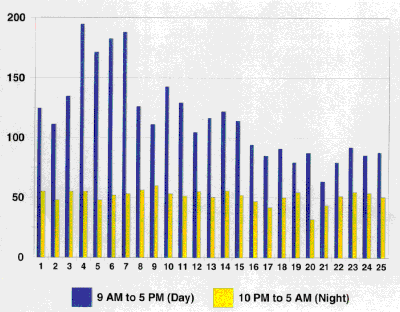 |
| Fixture Configuration Tested (see details below) |
|
| Figure 5. 1994 LFTF test result in decalux/Watt. |
| Fixture Configurations | ||
| 1 = T8 ED (Manuf. E) | 11 = T8 ED (Manuf. B) | 21 = T12-40 M |
| 2 = T8 ED (Manuf. D) | 12 = T8 ED (Manuf. A) | 22 = T8-32 4 LAMP Pris |
| 3 = T8 ED (Manuf. D) | 13 = T8 ED (Manuf. B) | 23 = T12-40 MD Par-Ref |
| 4 = T8 ED (Manuf. C) | 14 = T8 ED (Manuf. B) | 24 = T8-32 4 LAMP Pris-Ref |
| 5 = T8 ED (Manuf. D) | 15 = T8 ED (Manuf. A) | 25 = T12-40 MD Par-Ref |
| 6 = T8 ED (Manuf. D) | 16 = T12-40 ED Pris | |
| 7 = T8 ED (Manuf. C) | 17 = T12-40 ED Par-Ref | |
| 8 = T8 ED (Manuf. B) | 18 = T12-40 MD Pris-Ref | |
| 9 = T8 ED (Manuf. C) | 19 = T12-40 ED Par | |
| 10 = T8 ED (Manuf. C) | 20 = T12-40 MD Pris | |
The test results lend themselves to a number of general observations:
- The T8 lighting systems with electronic ballasts yielded the lowest power use (122 watts for two 2-lamp fixtures) of the tested configurations; conventional T12 systems with magnetic ballasts showed the worst performance (155-180 watts).
- Electronic ballasts produced superior performance with all tested lamp types. Savings averaged 56 watts when used with two F40T12 two-lamp fixtures and 39 watts when used with similar F34T12 fixtures. Tandem wiring of electronic ballasts produced an average savings of 11 watts when used with two fixtures.
- Parabolic troffers with reflectors showed a 17% increase in relative nighttime illuminance over standard troffers with prismatic diffusers. Reflectors used with standard troffers and prismatic diffusers showed improvements of approximately 9% to measured nighttime illuminance levels. Although lower than many manufacturer claims, the results are in agreement with other research [9,10].
- T8 lamps with dimmable electronic ballasts and controlled by photometric sensors showed a 45% lower electricity use between 8 AM and 5 PM, relative to a non-dimming system. These performance levels appear very attractive for perimeter office use where significant daylighting is available.
- T10 and 36-watt T8/electronic ballast lighting systems had the highest efficacies of any non-dimming system tested. However, care must be taken in choosing this system due to cost and the systems provide greater light output than is needed with standard fixture spacing.
Conclusions
Florida Solar Energy Center has constructed a test facility for comparative side-by-side testing of office lighting systems. Data were taken on electrical use, power quality and work plane illuminance levels under realistic conditions. Based on the tests completed , the most important factor in terms of potential energy efficiency of an office lighting system is the incorporation of electronic ballasts. Results show consistently high performance for both the T-8 and T-12 systems when they are used in concert with an electronic ballast. However, in terms of absolute energy efficiency (minimum w) and illumination efficacy (maximum lux/w), the T-8 systems showed the best results. If maximum daytime energy efficiency is desired in a potential daylighting application, the T-8 system with a continuously dimming electronic ballast is greatly superior to other evaluated options.
References
- SRC, 1992. Energy Conservation and Energy Efficiency in Florida: Phase I Final Report, SRC Report, No. 7777-R3, Synergic Resources Corp., Bala Cynwd, PA.
- Davis, R.G. and Wolsey, R.A., 1991. Guide to Performance Evaluation of Efficient Lighting Products, Lighting Research Center, Rensselaer Polytechnic Institute, Troy, NY.
- IES, 1987. IES Lighting Handbook: 1987 Applications Volume, Illuminating Engineering Society of North America, New York, NY.
- Crisp, V.H.C., 1977. "Energy Conservation in Buildings: A Preliminary Study of the Use of Automatic Control of Artificial Lighting", Lighting Research and Technology, Vol. 9, No. 1, pp. 31-41.
- Jaekel, R.R. and Rea, M.S., 1983. "A Case Study of a Daylight-linked Dimming System for Fluorescent Lamps", Building Research Note No. 194, National Research Council, Ottawa, Canada.
- Rubinstein, F. and Karayel, M. , 1984. " The Measured Savings from Lighting Control Strategies", IEEE Transactions on Industry Applications, No. 5, pp. 1189-1197.
- Verderber, R.R. and Rubinstein, F.M. and Ward, G., 1989. Photoelectric Control of Daylight Following Lighting Systems, CU-6243, Electric Power Research Institute, Palo Alto, CA.
- Rubinstein, F.M., 1991. Automatic Lighting Controls Demonstration: Long Term Results, Report 008.1-91.21, Pacific Gas and Electric, San Ramon, CA.
- EPRI, 1991. Retrofit Lighting Technologies, Electric Power Research Institute, CU-3040R, Palo Alto, CA.
LRC, 1992. "Specifier Reports: Specular Reflectors",
Volume 1, Issue 3, National Lighting Product Information Program,
Lighting Research Center, Rensselaer Polytechnic Institute,
Troy, NY.
Presented
at:
Tenth Symposium on Improving Building Systems in Hot and Humid
Climates
May 13-14, 1996
Texas A & M University
Fort Worth, TX
© 2007-2014 University of Central Florida. The Florida Solar Energy Center (FSEC)
is a research institute of the
University of Central Florida.
For more information about FSEC, please contact us or learn more about us.
Find us on Facebook!