

Reference Publication: Parker, D., Fairey, P., McIlvaine, J., "Energy Efficient Office Building Design For A Hot And Humid Climate: Florida's New Energy Center," Sponsored by the Florida Energy Office. Disclaimer: The views and opinions expressed in this article are solely those of the authors and are not intended to represent the views and opinions of the Florida Solar Energy Center. |
Energy Efficient Office Building Design For A Hot And Humid Climate:
Florida's New Energy Center
Florida Solar Energy Center (FSEC)
FSEC-PF-291-95
Introduction
Hot and humid climates, such as those in Florida, pose unique challenges to architects and engineers seeking energy efficient office building designs. The severe impact of internal loads on cooling, the intense solar conditions and the need for increased ventilation set against high relative humidities, all serve to limit the success of many conventional methods of reducing building energy use. To provide a high-visibility demonstration of potential energy design solutions, the Florida Solar Energy Center (FSEC) is building a state-of-the-art office complex for its new facility in Cocoa, Florida.
Design Objectives
While recognizing that the judgment and experience of the architect and engineer still remain the most important elements of successful building design, we desired a more analytical assessment to guide our effort. Specifically, we wished to examine the relative energy efficiency of our new facility and to investigate envelope and equipment options that might be used to make the building a prominent example of energy-efficiency. Our objective was simple, but ambitious: within the limits of our climate, to design and construct the most energy-efficient office building possible.
Reaching this objective requires a keen knowledge of how buildings in hot-humid climates use energy and an approach focused on minimizing those loads. Obviously, cooling needs dominate energy use in Florida. As elsewhere, efficiency of cooling equipment plays a large role in commercial building energy conservation. However, more subtle opportunities lie in addressing the cooling load itself.
Minimizing the cooling load in commercial buildings often centers on reducing internal lighting and equipment energy use. Even so, in Florida's climate, external envelope and ventilation loads can be significant as well. In providing energy design assistance, our staff typically advises the building community to specify a high efficiency lighting system, reflective roof finishes, east-west orientation, and high performance glazing. These recommendations are based on the relative magnitude of each component. For instance, elimination parametric analysis [1], with an hourly simulation of a conventional single-story office building prototype in Orlando shows that about 30% of the annual cooling load is attributable to heat produced by lighting, 20% to solar heat gain through windows, 15% to heat gain from the roof and 13% to heat generated by internal equipment.
The lighting system is not only the largest component of the cooling load, but also second only to HVAC in electrical consumption. Thus, lighting improvements yield very large, compound rewards. Perhaps the most challenging lighting measure is daylighting which takes advantage of Florida's abundant solar resource. Although this strategy, was shown to have the greatest potential for energy reduction [2], it can not be pursued haphazardly.
To be acceptable, the daylight provided to work spaces must be of high quality. This means diffuse, cool sunlight; direct beam radiation can thwart a daylighting design. With uncontrolled glare and localized overheating, occupants will almost certainly resort to blinds or curtains for relief [3]. Thus, exterior shading and glazing systems that control direct solar gains become fundamental design elements. The engineering challenge is to provide a reliable lighting system capable of automatically dimming when ambient light levels satisfy lighting needs. This often consists of T-8 lamps with electronic dimming ballasts, spectrally selective glazing and a proper building orientation.
With these key objectives in mind, our design team worked with project architects and engineers to arrive at a final building scheme which exemplified the best in energy design for hot and humid climates. The schematic building design was analyzed in detail using a hourly computer simulation to predict annual energy consumption. Then, a variety of energy conservation measures (ECMs) were simulated to find a combination of options that would reduce energy use to minimum levels. The optimized design incorporates an array of advanced technologies predicted to reduce energy use by more than 60% over current code levels of efficiency. Below we briefly describe the original schematic design which served as the base case for our energy analysis, our analytical process and the final results.
The Building
The new FSEC facility is depicted in model form in Figure 1 and during construction in Figure 2. In accordance with established energy design practice for hot and humid climates, the long axis of the complex is aligned east-west to minimize solar heat gains through glazing and maximize daylighting potential. The New Energy Center is composed of three major building elements: an office building, a visitor's center, and a laboratory complex.
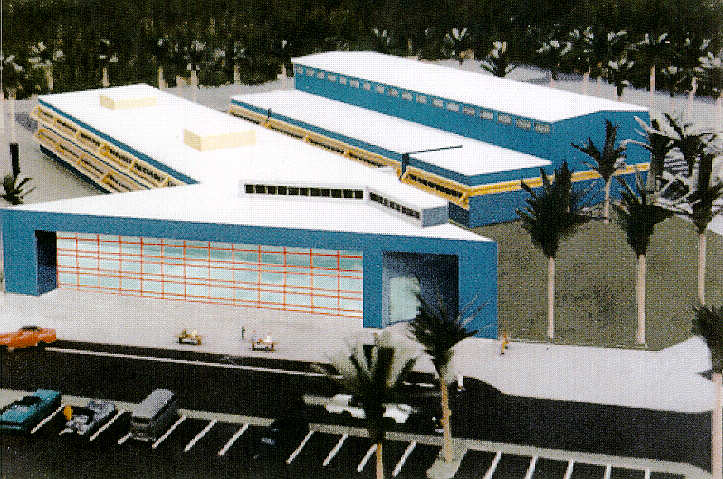
Figure 1: Model rendering of the new Florida Solar Energy Center (FSEC)
as it is to appear on completion. Building in the foreground comprises
the offices (rectangular section) and the lobby and visitors' center
(triangular element). High and low bay laboratories are to the rear.
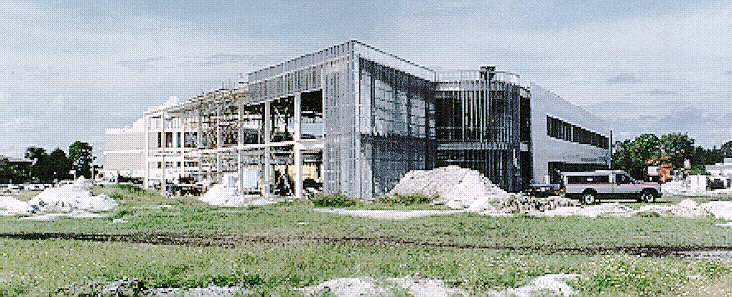 Figure 2: FSEC's new Energy Center under construction in October,
1994. The $6-million facility is slated for completion in late
summer of 1995.
Figure 2: FSEC's new Energy Center under construction in October,
1994. The $6-million facility is slated for completion in late
summer of 1995.
The office building is a long and narrow 41,000 ft2 (3,809 m2) two-story structure which includes offices, meeting rooms, and operational facilities. The 7,600 ft2 (706 m2), single-story visitor's center attached to the east end of the office building is triangular in plan with the longest facade facing the south-east. Covered exterior walkways through a landscaped court-yard connect the office building to the laboratory complex. This building is approximately the same size and shape as the office building but is partially unconditioned. The laboratories, because they are dominated by process loads, were not considered in our energy analysis.
The office building and the visitors center share similar construction characteristics. A four inch (1.9 cm) concrete slab forms the floor for the building. The floor to ceiling height is nine feet with a five foot, unconditioned plenum above. The exterior wall assembly consists of steel studs sheathed by an inch (2.5 cm) of foil-faced isocyanurate insulation (R-7; RSI 1.2) to reduce thermal bridging. This is covered with a prefabricated metal skin on the exterior. Between the studs R-11 ft2hoF/Btu (RSI-1.94m2K/W) fiberglass insulation is located. The interior surface is covered by gypsum drywall and a light colored latex finish. The roof assembly consists of an EPDM single-ply membrane over 4 inches (10.2 cm) of rigid insulation (R-20 ft2hoF/Btu) on a metal deck. The base case solar absorptance of the roof and walls is assumed to be 0.80 and 0.70, respectively.
Conventional commercial building characteristics for Florida were assumed for analysis of the schematic design:
- A standard reciprocating chiller (0.96 kW/ton; COP=3.66) and a VAVS system with hot water reheat coils. Water is heated by condenser heat reclaim supplemented by natural gas. Heat rejection is provided by a water-cooled cooling tower.
- Single pane aluminum frame windows without a thermal break (shading coefficient with blinds = 0.6).
- A lighting system consisting of recessed fluorescent fixtures with four T-12 F40 cool-white lamps in a standard troffer with magnetic core-coil ballasts; 40 W incandescent lamp exit signs.(1)
- No overhangs or other exterior shading devices. Many modern commercial buildings in Florida feature little fenestration of exposed areas of exterior glazing.
- Standard office and computer equipment with conventional switched lighting controls.
- Fixed
speed fans and pumps.
Simulation Model
We used the DOE-2.1D computer simulation program for our analysis of the facility [4]. DOE-2 predicts the hourly and annual energy use and costs of a building given weather data, a detailed description of the building including systems and usage patterns, and the prevailing utility rate structure. The program is particularly suited to the analysis of complex commercial structures since it incorporates detailed models of the building heating and cooling systems. It also predicts the ability of daylighting to offset electrical lighting needs. The simulations were performed, both on an annual basis (8,760 hours) and for the peak summer and winter days. Typical Meteorological Year data (TMY) for Orlando, Florida were used for the analysis. The peak summer day was defined as the day with the greatest cooling loads; the peak winter day was that with the highest heating loads. Standard engineering methods were used for the analysis [4].
The base building connected full-load lighting power density is 2.0 W/ft2 (0.19 W/m2). This is typical for standard luminaire and lamp types [5]. In accordance with ASHRAE Standard 62-1989, outside ventilation air is introduced into the building at a rate of 20 cubic feet per minute (20 cfm = 9.4 L/s) per occupant. The average occupancy for the office building is 150 persons. This equates to approximately 0.5 air changes per hour (ACH) of induced outdoor ventilation air for the overall building. Since the building is positive pressured, natural air infiltration is assumed to be negligible at 0.05 ACH. The occupancy schedule for the building reflects its use; occupancy is zero between midnight and 7 AM, with levels reaching 100% by 8 AM, dipping briefly during the noon hour, dropping rapidly to 30% at 5 PM, and then tapering off to zero after 11 PM.
Use of Empirical Data to Improve Simulation Accuracy
In order to accurately model and predict the performance of any building, accurate input data must be available. In a pertinent assessment, Norford et. al. (1994) [6] showed convincing evidence that failure to document energy use schedules and operating assumptions ranked as among the most powerful explanations for the shortfall in predicted versus actual performance in "low-energy" office buildings. To address this potential shortcoming, portions of the base case building definition and several ECMs for our analysis were defined using empirical data gathered from experiments at our current facilities. For instance, the thermostat settings and HVAC operation schedules are an accurate reflection of the measured conditions prevailing at FSEC's Cape Canaveral site.
Similarly, our weekday lighting schedule, as well as the occupancy sensor ECM, were based on the measured lighting energy use in one of our main office buildings over a six month period. This occupancy sensor retrofit study provided a detailed portrait of lighting use patterns at our current facilities and the technology's savings for our specific application (Figure 3). This is of particular importance because occupancy sensors do not readily lend themselves to savings estimates since results depend on behavioral characteristics [7]. In keeping with our mission, most employees are fairly responsible in switching off unnecessary lighting. Thus, our measured savings of occupancy sensors were only about 15% whereas most estimates for office buildings are twice as large. As shown in Figure 3, the majority of the modest lighting energy reduction is realized at noon and after normal working hours.
Figure 3: Long-term pre and post lighting load profiles from occupancy sensor study. Analysis reveals a 15 % savings from the occupancy sensor installation.
In some cases, monitored input data were not available. In these cases, we used the most reliable information available. For example, based on metered end-use data for 19 office buildings, daily equipment loads from computers, copiers and other office equipment were estimated to peak at 0.77 W/ft2 (0.07 W/m2) [8,9]. An office equipment schedule was created from this data with the minimum consumption reaching approximately 45% of the daytime peak value. This includes constantly operating on-line printers, copiers, and a main-frame computer.
Predictably, the largest equipment load in a research institute's facilities is from personal computers (there are approximately 160 PCs in use at our current site). Thus, we looked to Environmental Protection Agency's new Energy Star computer program to address this load. The Energy Star program has made available low-energy personal computer systems that often cost no more than comparable machines without the energy savings features. In 1994, FSEC metered the power use for both a standard and a new Energy Star system over a six month period. The overall energy savings were 26% as shown in Figure 4 [10]. Although the test results from this study were very conservative, we used the resulting 24-hour demand profile to alter the equipment load shape input into DOE-2.(2)*This provides a realistic assessment of the savings potential resulting from a comprehensive purchase policy to utilize Energy Star computers.
Figure 4: Measured 24-hour personal computer demand profile
measured at FSEC over a six month period. The lower line shows
the change in energy demand over the last three months when
an Energy Star computer and printer was substituted into the
work station. Overall savings was about 26 %. This information
was used to modify the equipment demand profile for more accurately
assess the efficiency potential of Energy Star machines in
FSEC's new facility.
Perhaps most important of all, we performed tests to determine the feasibility of our largest potential savings measure -- daylighting. There were a number of uncertainties highlighted by previous studies which made performance verification an imperative [11,12]. How accurate was the DOE-2 daylighting model? Might the presence of blinds effect the results and how well would manufacturer's equipment perform against specifications? Using two side-by-side offices at FSEC, the daylighting dimming systems demonstrated an average electrical lighting reduction of nearly 30% during daytime hours [13]. Figure 5 illustrates comparative lighting system performance over a single day for a T-12 system with a magnetic ballast and the chosen T-8 system with a photometrically controlled electronic ballast. Our findings agreed well with the daylighting performance prediction from DOE-2.
 Figure 5: Measured energy use of two lighting systems in identical
side-by-side offices at FSEC. The left system is conventional:
two fixtures with two F34 T12 lamps and magnetic ballasts.
The right-hand system is that proposed for FSEC's new facility:
two T8 lamps with open parabolic troffers and continuously
dimming electronic ballasts controlled by a ceiling mounted
photosensor. Overall energy use of dimming T8 system is 66%
lower than of that of standard T12 system between 9 and 5 PM.
Dimming of T8 system reduces power by a maximum of 40% over
its demand under nighttime conditions.
Figure 5: Measured energy use of two lighting systems in identical
side-by-side offices at FSEC. The left system is conventional:
two fixtures with two F34 T12 lamps and magnetic ballasts.
The right-hand system is that proposed for FSEC's new facility:
two T8 lamps with open parabolic troffers and continuously
dimming electronic ballasts controlled by a ceiling mounted
photosensor. Overall energy use of dimming T8 system is 66%
lower than of that of standard T12 system between 9 and 5 PM.
Dimming of T8 system reduces power by a maximum of 40% over
its demand under nighttime conditions.
Controlling Humidity
Maintaining proper humidity levels within air conditioned buildings in Florida is an ever present concern. Air conditioning leads to continuous moisture flow from the outside to the conditioned interior since the indoor vapor pressure is almost always lower than the outdoor ambient levels. With increased requirements for outside air for ventilation, the latent loads on the space conditioning system in Florida often exceed the sensible loads. This is further aggravated by buildings, such as our new facility, in which sensible loads are very low due to energy-efficient building design choices. And since space conditioning systems are most often controlled by a thermostat responding to sensible heat, it becomes imperative to carefully engineer the HVAC system to provide effective control of interior moisture loads under part-load conditions.
Fundamental first steps for designing commercial buildings in humid climates are conventional. These involve minimization of internal moisture generation and the reduction of vapor diffusion through the building envelope by utilization of exterior materials and finishes with a higher vapor resistance than interior surfaces. Producing a positive pressure with properly dehumidified ventilation air will serve to both minimize air infiltration into the building as well as vapor diffusion through wall and roof cavities.
However, as a building is made more efficient, and sensible cooling loads from fenestration, interior lighting and equipment are reduced, the latent load quickly becomes the dominate factor in the cooling system's ability to maintain comfort. Suitable sizing of cooling equipment becomes critically important in providing primary dehumidification under part-load conditions. Thus, as sensible cooling loads in a humid climate are reduced, it is vital that the space conditioning system be continually re-sized in response. Over-sized cooling systems exacerbate the problem since the latent capacity of chilled water coils falls off more quickly than does the sensible capacity. Other common energy saving practices, such as supply air or chilled water reset with outside air temperature, will further reduce coil latent capacity under part-load conditions. Design of a cooling system capable of providing a suitably low sensible heat ratio (SHR) is important, but even this will not usually be adequate in humid climates under the increased ventilation rates specified by ASHRAE Standard 62-1989.
In humid climates, ventilation air must be continually dehumidified to yield acceptable moisture control. In the past this has generally been accomplished by over-cooling the mixture of ventilation and return air, and then using terminal reheat coils to bring the air temperature levels back to comfort conditions. Even when electric reheat is avoided, however, this approach is extremely energy intensive, and minimization of its annual use should be a priority design objective.
A useful concept in the design of ventilation systems for commercial buildings in humid climates is the "central fresh air unit." This involves using a dedicated air conditioner or cooling coil to cool and dehumidify the outside ventilation air prior to being mixed with return air within the space conditioning system. In the past, it has been common practice to mix moist outside air with the interior space return air prior to its being passed over the cooling and dehumidification coils. However, by directly conditioning the moist outside air before being mixed with system return air, the thermodynamic effectiveness of moisture removal is improved. For a given chilled water coil, not only is moisture removal increased by such a dedicated outdoor unit, but the coil's cooling capacity is also slightly enhanced.
A fresh air unit also provides a centralized opportunity for air filtration or the use of heat exchange devices to exchange sensible and latent heat between the supply and exhaust air streams. It is also cheaper to add enhancements like heat pipes, etc. on small central fresh air unit compared to larger conventional coils that are typically designed to treat a mixture of fresh air and recirculated air. The air can be pre-cooled and dehumidified using either heat pipes, chilled water coils, a dedicated low SHR vapor-compression air conditioner or a rotary enthalpy heat exchanger.
Energy Efficiency Measures and Simulation Results
Eighteen ECMs were considered in the energy analysis which compared the performance of the base building with and without each of the examined options. The description of the individual measures and the simulation results is lengthy and is detailed in an early source report [14]. In performing the analysis, a number of studied measures, often advocated in more temperate zones, were found to be of little value in Central Florida's humid climate. For instance, an economizer cycle showed little useful savings, particularly when realistic enthalpy limitations were established. Similarly, higher than code-mandated levels of wall and roof insulation were shown to be produce little savings. Thus, seven of the eighteen measures were eliminated from the list of options considered for the optimized building. Ultimately, ten types of measures were found to confer beneficial energy savings and comfort control relative to the base case building:
Primary Measures
- Lighting: Incorporation of a high-efficiency lighting system (0.9 W/ft2; 0.08 W/m2) consisting of T-8 fluorescent lamps in a reflective troffer with electronic ballasts reducing both lighting electrical consumption and internal heat generation.
- Glazing System: Specification of high-performance windows consisting of spectrally selective glazing units with a high visible transmittance (0.56) for daylighting and a very low shading coefficient (0.33) for rejecting unwanted solar heat gain [15,16]. A low unit U-value (0.31 Btu/hrft2oF) (1.76 W/m2K) provides effective control of conductive gains under peak load conditions.
- Daylighting: A long and narrow perimeter office plan with extensive north and south facing glazing provides high quality daylighting suitable for perimeter office illumination. This, coupled with solar control devices on the south facade enables effective utilization of the continuously dimming electronic ballasts. These are controlled by photometric sensors which adjust ballast output in response to available daylight to maintain a constant desk-top illumination level. Roof-top monitors are used to project daylight into the building core zones.
- HVAC: Substitution of two high-efficiency (IPLV=0.65 kW/ton; COP=5.41) helical-rotary screw chillers for a standard reciprocating chiller. These will be used in tandem to take advantage of their attractive part-load characteristics (0.60 kW/ton at 50% load condition) while increasing overall cooling system reliability. Parallel fan powered VAV boxes are used to exchange air between the building core and the perimeter zones, significantly reducing the need for re-heat. Straight cool VAV boxes are used for the building's core zones. Variable speed fans are used to reduce fan-energy.
- Humidity Control: The new facility will use a central fresh air unit with heat pipe heat exchangers. The low temperature side of a closed-loop refrigerant heat pipe is first used to lower the temperature and moisture of filtered outside air. The air is then passed through a chilled water coil for further cooling and dehumidification after which the condensing side of the heat pipe adds heat back to the air stream. Should the air still be too cool to be introduced to the space, natural gas fired hot water coils are used to add reheat. However, depending on the ratio of outdoor air to total supply air, it may not be necessary to reheat at all except under extremely low load conditions.
Another common occurrence in Florida commercial buildings without significant reheat is to note an imbalance between the interior air temperature distribution between the north and south sides of buildings -- particularly during the spring and autumn months when fenestration heat gains on the south zone can become significant. To address this need, we specified parallel fan-powered boxes on the perimeter zone with transfer grills to exchange air with the cone zones. High-maintanence, high energy-use fan powered induction boxes were avoided.
Secondary Measures
- Energy Star Equipment: Promotion of a purchase policy to acquire energy saving "Energy Star" personal computers, printers and copiers to replace existing equipment. Direct savings of 100 - 200 kWh per year per computer workstation.
- Reflective Roof Finish: Selection of a reflective white EPDM single-ply roofing membrane rather than gray or black to reduce heat gains to the top floor plenum. Experiments by FSEC whitening the roofs of six residences over a three year period have shown an average 23% reduction in air conditioning energy use [17]. Although savings are certain to be much less in internal load dominated commercial structures, increased aesthetic acceptance and low incremental cost should make this a beneficial measure for non-residential buildings in Florida. Figure 6 shows the white single ply membrane being unrolled over the roof insulation of the new facility. Note the north-facing light monitors designed to project daylight into the building interior.
- Variable speed fans and pumps: Inverter controlled drives for larger chilled water pumps and variable speed fans rather than inlet vanes for the VAV system allows improved part load performance along with demonstrated energy savings [18]. Generally, our analysis showed it to be cost-effective to use variable frequency drives for motors larger than 15 horsepower.
- Demand Controlled ventilation: The overall building outside air ventilation rate is decreased from an average of 20 cfm/person to 15 cfm/person (9.4 - 7.1 L/s/person) using CO2 sensor controlled ventilation for intermittently occupied spaces and zones. A non-smoking classification is used for the building.
- Energy Management System (EMS): Our simulation assumed that the finer control tolerance of the Direct Digital Control (DDC) systems coupled with the EMS permits an increase (0.6oC) in the cooling setpoint from 75oF to 76oF (23.9 - 24.4oC) as well provide optimal stop capability. A similar credit was taken for heating season performance, resulting in a very conservative estimate of annual EMS savings (5%) [19]. We believe this temperature range will be adequate for interior comfort since the temperature maintained inside our current facilities averages 75.6oF (24.2oC) based on actual measurement.
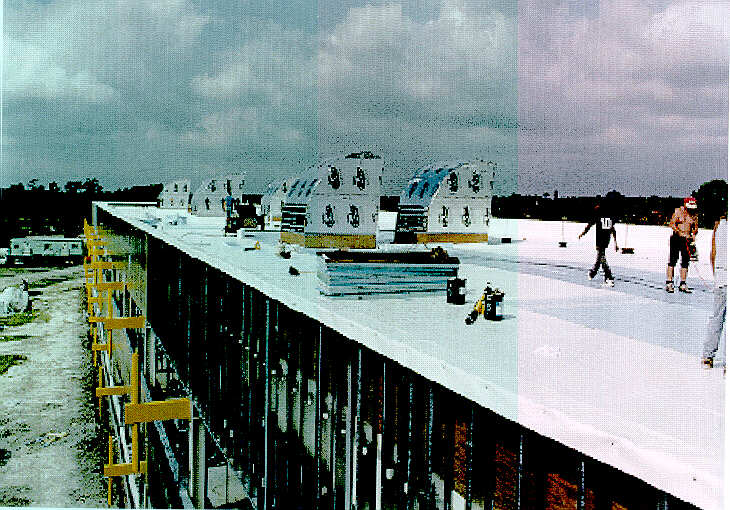
Figure 6: Workers roll out the reflective single-ply roofing
membrane (solar reflectance - 70%) over rigid insulation on
a metal roof deck. The reflective roof is predicted to reduce
building energy use by 4% at virtually no incremental cost.
The daylighting roof monitors are clearly visible. These are
used to project light into the interior core of the building.
Energy Optimization Analysis
After the analysis of the individual ECMs, we added the successful options to the base case in an incremental fashion to determine a package of measures that would yield optimum performance [4]. Although economics are ultimately important with any design, we desired to examine the energy-reduction potential purely from a technical standpoint. What combination of measures would provide the greatest energy reduction? Later we would re-visit the project economics. The fundamental point was to engineer an advanced design that pushed the limits of current technical feasibility.
With this methodology, all potential ECMs were examined. The one which yielded the greatest energy savings, T-8 lamps with electronic ballasts, was incorporated into the building model resulting in a new base case building. Then, all remaining measures were subsequently re-evaluated for the revised base case. This process, optimization by steepest descent, continued until there were no additional measures with significant benefits. This analysis is shown in Table 1 and Figure 7.
Figure 7: Graphic illustration of building optimization process. Shown are the incremental reductions in energy use (kBtu/ft2) and cooling system capacity (tons) from each measure. The optimized building reduces the base building energy use by 62% and cooling capacity by 52%.
The optimized building design is predicted to reduce energy use and associated operating costs by more than 62% over the schematic design. Lighting related measures accounted for fully 58% of the identified savings in the package. This finding is consistent with measured savings from other commercial building retrofits and analyses [20]. However, even if the more contemporary base case is taken as a lighting system with T8 lamps with electronic ballasts, the overall predicted savings from the remaining measures is still capable of reducing energy use by 50%. Other important ECMs producing these savings included efficient HVAC systems, daylighting and high-performance windows.
Many of the more successful strategies, particularly the improved lighting system and the spectrally selective glazing, had a very beneficial impact on the monthly peak electrical loads. Reduction to peak demand is not only desirable for utilities, but also to building operators since monthly peak demand charges comprise a large fraction of recurring energy costs. Note that the optimum package of measures reduces the building peak electrical demand to only 38% of its original value.
Table 1
Incremental Analysis of Energy Efficiency Measures for FSEC Building
| Measure
Description |
Use
kWh |
Peak
kW |
Gas
MCF |
A/C Size
Ton |
kBtu/ft
yr |
Elec Cost
$/Yr |
Gas
$/yr |
Total
$/yr |
Savings
$ |
| Base Case FSEC | 850,532 | 320 | 320 | 140.8 | 71.3 | $72,930 | 181 | $73,111 | 0 |
| T-8s w/elect ballasts | 640,993 | 256 | 681 | 125.7 | 54.6 | $55,843 | 293 | $56,123 | $16,988 |
| Spectrally selective glazing | 550,354 | 212 | 275 | 97.9 | 46.2 | $47,026 | 118 | $47,145 | $ 8,978 |
| Daylight dimming ballasts | 449,435 | 169 | 337 | 85.5 | 38.0 | $37,673 | 145 | $37,818 | $ 9,327 |
| Helical-rotary chillers | 397,833 | 142 | 279 | 85.5 | 33.6 | $32,667 | 120 | $32,787 | $ 5,031 |
| Energy Star equipment | 366,091 | 147 | 307 | 84.2 | 31.0 | $30,859 | 132 | $30,992 | $ 1,795 |
| Reflective roof finish | 353,732 | 129 | 240 | 75.0 | 29.8 | $29,253 | 104 | $29,356 | $ 1,636 |
| Occupancy sensors | 344,245 | 131 | 257 | 74.5 | 29.1 | $28,823 | 111 | $28,934 | $ 422 |
| Variable speed fans | 336,753 | 131 | 266 | 74.5 | 28.5 | $28,498 | 115 | $28,613 | $ 321 |
| Energy Mngt. System | 331,548 | 129 | 197 | 70.9 | 27.9 | $27,543 | 85 | $27,628 | $ 985 |
| Variable Speed Pumps | 326,693 | 129 | 189 | 70.9 | 27.5 | $27,233 | 81 | $27,315 | $ 313 |
| Controlled Ventilation | 323,800 | 125 | 186 | 68.2 | 27.2 | $26,899 | 80 | $26,979 | $ 336 |
Benefits also accrue from the reduced size of the HVAC system.
The required cooling capacity for the office building drops from
141 tons (496 kWt) for the base case to only 68 tons (239 kWt) for
the optimized building. This saves an estimated $40,000 in avoided
expenses for the larger chiller and cooling tower alone. Such a
value-based engineering approach further reduces costs when the
smaller size of the distribution system, pumps and fans are taken
into account. Including savings from down-sizing HVAC equipment
the estimated incremental cost of the energy-related improvements
was approximately $220,000. The project simple payback is attractive
at 4.8 years.
Comparison with other Commercial Buildings
In our analysis, the annual energy use index (EUI) for the base case building dropped from 71 kBtu/ft2 (224 kWh/m2) to only 27 kBtu/ft2 (85 kWh/m2) for the optimized building. This compares to 96 kBtu/ft2 (303 kWh/m2) for the measured use of 74 existing U.S. office buildings of various vintages [20]. In Florida, the average energy use of 160 state-owned office buildings in Florida in 1991 was 67 kBtu/ft2 (211 kWh/m2). FSEC's current facilities in Cape Canaveral used about 79 kBtu/ft2(249 kWh/m2).
Control and Metering
The new facility will have an extensive energy management system (EMS) capable of optimizing and verifying system performance. It will also include a detailed data acquisition system to examine how the facility performs compared with expectations. Fifteen minute data will be obtained on chiller, fan, pumping, lighting system and plug load electrical use as well as interior comfort and meteorological conditions. Recent studies have emphasized the importance of building energy monitoring to properly commission HVAC systems in order to realize their maximum efficiency potential [21]. The collected data will also allow determination of the various factors affecting the success of the overall design. This will enhance our ability to proffer lessons learned to the Florida design community through our Building Design Assistance Center.
Conclusions
An analysis of the new FSEC building indicates that very large benefits in reducing energy consumption in a hot-humid climate can be obtained from improvements to the building and its equipment. A 62% overall (71 - 27 kBtu/ft2yr) reduction in energy use over code-mandated levels was predicted using a detailed simulation analysis. The most important measures included a high-efficiency lighting system with careful daylighting design, spectrally-selective windows and a high efficiency HVAC system engineered for effective humidity removal.
The high-efficiency fluorescent lighting system along with daylighting accounted for over half of the savings. Other identified measures that resulted in energy savings included reducing the solar absorptance of the building roof, reduction of the per person ventilation rate from 20 to 15 cfm (7.1 L/s) per person using demand controlled ventilation and a purchase policy for new personal computers that encourages procurement of Energy Star machines.
The Future
We are now examining strategies that might further improve the energy efficiency of our new facility. One explored approach is to use a grid-connected 50 - 60 kW photovoltaic (PV) system. An initial analysis was conducted using an hourly PV simulation, coupled with the hourly loads from DOE-2. Our analysis indicates that most of the daily electrical lighting load could be met with such a PV system. The timing of the load is thus well suited to the power production profile from photovoltaic arrays. Furthermore, the high efficiency lighting technologies along with daylighting could result in lighting and equipment electrical demands averaging less than 0.5 W/ft2 (20 kW for the office building). Results showed that a 50 kW PV system would reduce the overall annual building electrical load by about 76,000 kWh and further lower the facility's utility energy use to approximately 21 kBtu/ft2 (66 kWh/m2) per year.
Thus, through a combination high-efficiency lighting, equipment, and envelope measures along with use of renewable energy sources, we expect our new FSEC facility to become a model for energy-efficient office building design in hot and humid climates. Construction of the $6 million project began in June 1994 and is slated for completion in late summer of 1995.
Acknowledgements
This work was sponsored by the Florida Energy Office whose support is gratefully acknowledged. Special thanks to Architects Design Group and Ralph Hahn and Associates for their cooperation within the project. Tim Merrigan, Ross McCluney and Don Shirey provided important input into the analytical process and Jim Dunlop performed the analysis of augmenting the facility with photovoltaics. Wanda Dutton assisted with article preparation.
References
- S. Ternoey, L. Bickle, C. Robbins, R. Busch and K. McCord, 1985. The Design of Energy Responsive Commercial Buildings, John Wiley and Sons, New York, NY.
- R. A. Rundquist, 1991. "Daylighting Controls: Orphan of HVAC Design," ASHRAE Journal, Atlanta, GA, November, 1991.
- A.J. Rubin, B.L. Collins and R.L. Tibbott, 1978. Window Blinds as a Potential Energy Saver-- A Case Study, NBS Science Series 112, National Bureau of Standards, Washington, DC.
- Lawrence Berkeley Laboratory, DOE-2 Reference Manual, Building Energy Simulation Group, Applied Science Division LBL-8706, Rev. 2, Berkeley, CA, May, 1984.
- P.C. Jacobs, C.E. Hancock, D.R. Roberts, D.N. Wortman, P.S. Reeves and F.W. Parker, 1992. Engineering Methods for Estimating the Impacts of Demand-Side Management Programs: Volume 1: Fundamentals of Engineering Simulations for Residential and Commercial Buildings, EPRI-TR-100984, Electric Power Research Institute, Palo Alto, CA.
- L.K. Norford, R.H. Socolow, E.S. Hsieh and G.V. Spardaro, 1994. "Two-to-One Discrepancy Between Measured and Predicted Performance of a Low Energy Office Building: Insights from a Reconciliation Based on the DOE-2 Model," Energy and Buildings, 21, Elsevier-Sequoia, Netherlands.
- Kaplan Engineering, 1992. Guidelines for Energy Simulation of Commercial Buildings, DOE/BP-26683-2, Bonneville Power Administration, Portland, OR.
- Z.T. Taylor and R.G. Pratt, 1990. Comparison of ELCAP Data with Lighting and Equipment Load Levels and Profiles Assumed in Regional Models, PNL-7449, Pacific Northwest Laboratory, Richland, WA.
- Z.T. Taylor, 1992. Description of Electric Energy Use in Commercial Buildings in the Pacific Northwest: 1992 Supplement, DOE/BP-1958, Pacific Northwest Laboratory, Richland, WA.
- P.G. Lapujade and D.S. Parker, 1994. "Measured Energy Savings of an Energy-Efficient Office Computer Systems," Proceedings of the 1994 Summer Study on Energy-Efficiency in Buildings, Vol. 9, p. 213, American Council for an Energy Efficient Economy, Washington, DC.
- J. Reed, C. Pinkowski, B. Caldwell, J. Mapp, S. White and N. Hall, 1994. "Energy Savings from an Active Daylighting Retrofit and Impact on Building Practices," Proceedings of the 1994 Summer Study on Energy Efficiency in Buildings, Vol. 3, p. 217, American Council for an Energy Efficient Economy, Washington D.C.
- A.F. Rubinstein, 1991. Automatic Lighting Controls Demonstration: Long Term Results, LBL-28793, Lawrence Berkeley Laboratory, Berkeley, CA.
- D.S. Parker, T.C. Stedman and J.K. Sonne, 1994. "Side-by-Side Testing of Commercial Office Lighting Systems," FSEC-PF-265-93, DA/DSM Fourth International Symposium on Demand Side Management, Orlando, FL.
- D.S. Parker, 1991. The Florida Solar Energy Center: Preliminary Analysis of Potential Improvements, Florida Solar Energy Center, FSEC-RR-26-91, Cape Canaveral, FL.
- J. McIlvaine, K. Hannani, R. McCluney, and P. Fairey, 1992. Office Daylighting Experiments and Assessment, FSEC-RR-28-92, Florida Solar Energy Center, Cape Canaveral, FL.
- R. McCluney, 1993. "Choosing the Best Window for Hot Climates," Proceedings of the Innovative Housing '93 Conference, FSEC-PF-253-93, Florida Solar Energy Center, Cape Canaveral, FL.
- D.S. Parker, S.F. Barkaszi and J.K. Sonne, 1994. Measured Cooling Energy Savings from Reflective Roof Coatings in Florida: Phase II Report, FSEC-CR-699-94, Florida Solar Energy Center, Cape Canaveral, FL.
- M. Abbas, A. Athar, V. Challa, J. Haberl and D. Claridge, 1992. "Texas LoanSTAR Monitoring and Analysis Program: Characterizing Loanstar Buildings and Energy Consumption," Proceedings of the Eighth Symposium on Improving Building Systems in Hot and Humid Climates, p. 178, Dallas, TX.
- G. Wheeler, 1994. "Performance of Energy Management Systems," Proceedings of the 1990 Summer Study on Energy Efficiency in Buildings, American Council for an Energy Efficient Economy, Washington D.C., August, Vol. 5, p. 257.
- K.M. Greely, J.P. Harris and A.M. Hatcher, "Measured Energy Savings and Cost Effectiveness of Conservation Retrofits in Commercial Buildings," Proceedings of the 1990 Summer Study on Energy Efficiency in Buildings, American Council for an Energy Efficient Economy, Washington D.C., August, 1990.
- M. Liu, J. Houcek, A. Athar, A. Reddy, D. Claridge and J. Haberl, 1994. "Identifying and Implementing Operation and Maintenance Measures in Texas LoanSTAR Buildings," Proceedings of the 1994 Summer Study on Energy Efficiency in Buildings, Vol. 5, p. 183, American Council for an Energy Efficient Economy, Washington D.C.
1. At the time our initial analysis was conducted in 1991, this was considered a typical office lighting system. Since that time improved lamps and electronic ballast have become more common place. However, we retained this configuration as the base case for our analysis, in part to illustrate the desirability of the new lighting systems that typically comply with ASHRAE Standard 90.1.
2. Our results are conservative since the tested computer system received heavy use and thus had less opportunity to go into the energy saving mode.
© 2007-2014 University of Central Florida. The Florida Solar Energy Center (FSEC)
is a research institute of the
University of Central Florida.
For more information about FSEC, please contact us or learn more about us.
Find us on Facebook!