

Reference Publication: Floyd, D., Parker, D., "Field Commissioning of a Daylight-Dimming Lighting System," Presented at the Right Light Tree, 3rd European Conference on Energy Efficient Lighting, Newcastle upon Tyne, England, June 18-21, 1995. Disclaimer: The views and opinions expressed in this article are solely those of the authors and are not intended to represent the views and opinions of the Florida Solar Energy Center. |
Field Commissioning of a Daylight-Dimming Lighting System
Florida Solar Energy Center (FSEC)
FSEC-PF-283-95
Abstract
An Elementary School cafeteria in Florida was commissioned with a
fluorescent lighting system that dims in response to available daylight.
The lighting system's performance and commissioning aspects were evaluated
through real time measurement of lighting and air conditioning power,
work plane illumination, and interior/exterior site conditions. The
new system produced a 27% reduction in lighting power due to dimming.
Lower than expected dimming system performance was observed prior to
effective commissioning. Difficulties encountered are discussed as
well as recommendations for performance improvements.
Introduction
Lighting energy usage in commercial office buildings accounts for
a substantial portion of the total energy use. A recent study conducted
in the state of Florida found that 33% of all commercial electricity
use was from lighting loads. (Parker et al. 1993) While there are
many strategies to reduce lighting loads, automatic dimming electric
lighting systems appear attractive where daylight is available.
(Rubinstein 1991) A recent in situ study of an automatic dimming
system in a large office building measured up to 60% lower electricity
use during the day, relative to a non-dimming system (Reed et al.
1994). Other investigations have also demonstrated the capabilities
of these systems in reducing lighting loads, however few of these
field studies have explored the commissioning aspects of automatic
dimming lighting systems (Schrum and Parker 1995; Rubinstein et
al. 1989; Verderber and Rubinstein 1994). The intent of this paper
is to explore the performance and commissioning aspects of a daylight
dimming lighting system in a typical windowed building and show
how these systems might be optimized.
Building Characteristics
A 263 m2 (13.5 m x 19.5 m) school cafeteria, located in central
Florida (latitude 28°, longitude 81°), was selected for
the field test of the daylight-dimming lighting system. The building's
east and west facades are more than 70% glazing which provides
abundant natural daylight to the buildings interior which doubles
as a cafeteria and auditorium. The east facade is partially shaded
from a covered walkway. Vertical blinds had been previously installed,
on all windows, in an attempt to control unwanted heat and glare.
Prior to retrofit, the building was lighted by 25 60 cm x 120 cm,
recessed luminaries, each with two magnetic ballasts and four 40
W cool white, T12 lamps. Before monitoring began all the luminaires
were thoroughly cleaned and new lamps (seasoned 100 hours) were
installed to eliminate the effects of lamp lumen depreciation and
luminaire dirt depreciation. Four ductless 10.5 kW/thermal heat
pumps, located on the west wall, provide the necessary heating ventilating
and air-conditioning (HVAC) requirements for the predominately hot,
humid climate. The building and lighting system performance were
monitored in the base condition for 3 months.

School cafeteria
The new controllable lighting system, installed in late June, near the summer solstice, replaced the inefficient magnetic ballasts and poor color rendering 40W T12 cool white lamps with a single electronic dimming ballast and two high color rendering (85CRI) 32W T8 lamps in each luminaire. The outer lamp sockets were used to mount the two new lamps to avoid the added labor of recentering the lamps. The building was divided into five linear north-south zones, with each zone of five luminaires controlled by a single ceiling mounted photosensor (Fig. 1).
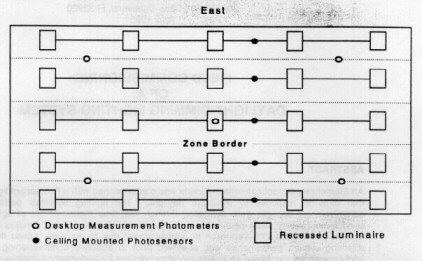
Figure 1. Schematic showing the five control zones, ceiling mounted
photosensors, and measurement photometers.
The photosensor regulates the light level (to a minimum of 20%) for the ballasts in each zone based on the available light measured in it's conical field of view. These changes brought the lighting levels closer to the recommended Illumination Engineering Society (IES) level for cafeterias (300 Lux), increased the lighting system efficacy and allowed for more effective utilization of daylight.
To measure the effectiveness of the lighting retrofit, the building
was monitored for lighting and air conditioning energy consumption,
desktop light levels, meteorological parameters including horizontal
insulation, interior conditions and luminaire temperatures. Five
photometers mounted at desktop height record illuminance.
Instrumentation
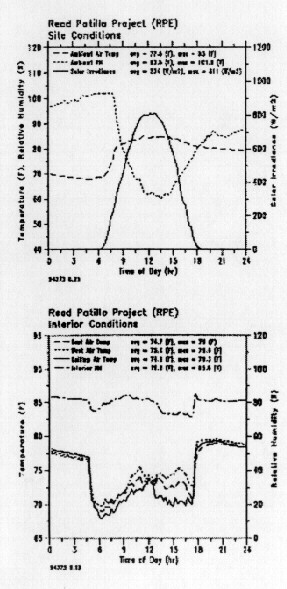
Instrumentation used to monitor power, illumination and the interior/exterior site conditions consisted of an expanded multi-channel datalogger (12 bit precision) and various monitoring devices. All sensors and power monitoring equipment was calibrated to a known accurate source before installation. The datalogger scans all 30 channels (except power) every ten seconds with integrated averages outputted to final storage every fifteen minutes. Power measurements are polled every ten seconds and totaled on fifteen minute intervals. The datalogger is interrogated nightly by a mainframe computer which archives the data and produces daily plots showing the 24 hour site conditions and lighting system performance. A sample plot is presented below:
The datalogger was used to poll the following types of sensors:
| Power | Watt hour transducers recorded true root mean square (rms) power regardless of wave form distortion (±1% accuracy of reading). |
| llluminance | Silicon photodiode photometers were used to record work surface illuminance (±5% CIE curve match and 80° cosine correction). A precision 604W resistor was used to convert the output to millivolts. |
| Solar Irradiance | Silicon photodiode pyranometer (80° cosine correction). |
Results
Comparison of pre-retrofit data with post-retrofit data was performed to measure lighting energy savings and variations in desktop illumination levels. Overall lighting energy savings are further analyzed to determine actual energy savings solely due to the dimming capabilities of the system.
Actual measured performance
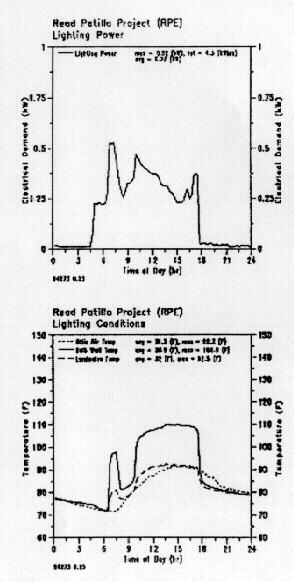
Figure 2. Average Daily lighting load profile showing a 66% decrease
Before analysis of the lighting energy savings can be presented, it is important to understand the building's lighting usage pattern. Lighting is used only from Monday to Friday beginning at approximately 7AM and continuing through approximately 6PM. During the afternoon one or more of the three lighting circuits is usually switched off for a short period (30 to 60 minutes). While this off time is somewhat regular, it is, nevertheless, an uncontrolled variable that must be accounted for in the data analysis. Data used in all the analyses excludes weekend and holiday periods when the lighting was also off.
Initial examination of the average measured daily lighting power usage (kWh) before and after the new lighting system was installed shows a 66% decrease (Fig. 2). This value represents the actual lighting energy saved by the building (excluding heating and cooling interactions) and is influenced by weather, lighting "off" periods, and window blind control. When the influence of lighting "off" periods is removed, the total savings increase slightly to 69%.
Calculated annual energy savings
Before the dimming response of the system is analyzed, one must account for uncontrolled variables, primarily occupant control of the blinds and weather. In order to account for changes in day length, solar angle, and clouds, average solar irradiance for the year was calculated from pyranometer data at the site. This was calculated to be an hourly average of 380 W/m2 . Average solar irradiance for the months of August and September combined was 385 W/m2, within 2% of the yearly average. This time period was therefore used to estimate yearly dimming response for the lighting system. The graph in Figure 3 shows the average response during this time period and the power that would have been consumed without the dimming capabilities (full power).
Figure 3. Average system dimming performance for a representative yearly period.
The system dims an average of 27% over the period for a 402W average reduction for the period. Under ideal conditions (blinds open, clear day), the data show that 36% dimming ( 58Wwreduction) from full output could be achieved.
The overall lighting power savings (nearly 76%) is a result of converting to a more efficient electronic ballast/lamps system, adding ballast dimming capabilities, and tuning light levels through delamping. The old system of magnetic ballasts and 40W T12 lamps consumed a maximum of 4.65 kW (186 watts/luminaire). The new system at full output was measured to consume a maximum of 1.5 kW (60 watts/luminaire). This equates to an impressive 67% reduction in full output lighting load and represents the savings attributed to the more efficient ballast/lamps and light level tuning only. The average additional savings from daylight dimming capabilities amount to 9% (402W), which equates to a total reduction of 76%. The dimming system on average dimmed 27% from full output. The lower than expected dimming performance is thought to be due to a number of factors including occupant control of the blinds, a less than optimal building design for daylighting and poor control photometer response. Desktop Illumination
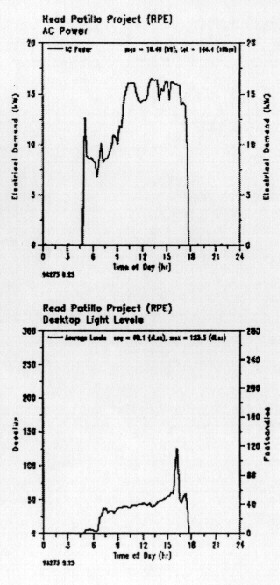
Energy savings are meaningless if lighting quality is compromised to such a degree that occupant comfort and productivity is affected. While all aspects of good lighting design cannot easily be measured, monitoring desktop illumination can provide information on the relative performance of a dimming system. As shown in Figure 4, average light levels in the cafeteria after commissioning fluctuated less and were still above the IES standard of 300 lux. (IES 1992) Average post-retrofit light levels averaged 428 lux, only a 30% decrease from the average pre-retrofit level of 610 lux.
Figure 4.
Commissioning Difficulties
The dimming capacity of the system produced approximately a 27% reduction in the new systems lighting use. While the significant energy savings were anticipated from the new system, the difficulties associated with installing and calibrating the control photosensors were not. When early data showed minimal dimming, an attempt was made to recalibrate the photosensors. However, proper dimming response was not achieved until the manufactured supplied shields were installed. It is believed that the shields prevented saturation of the sensor from daylight and reflections originating from the other side of the room. This allowed the sensor to better respond to light originating near the controlled zone. Post recalibration data showed an improvement to the dimming response.
Photosensor calibration difficulties such as the ones experienced during the case study are by no means unique. Our investigation, as well as a parallel study performing side by side testing of different photosensor designs, disclosed a number of problems. First, all manufacturer supplied instructions on proper adjustment of the photosensor-ballast response were found to be woefully inadequate. Proper adjustment of the daylighting system response required knowledge of the photosensor sensitivity range (for example, turning the set potentiometer too high can result in poor dimming response). We also found it difficult to adjust the photosensors to the desired illuminance level with any accuracy (± 50 lux) and the illuminance levels were often less during the day than at night (for example, an illuminance of 500 lux set at night would measure 400 lux during the day). We often resorted to a trial and error approach to obtain good dimming response. Lastly, the photosensor mounting location and shield (if supplied) use varied amongst the manufacturers. Most directions suggested a location of two-thirds the distance into the room from the window, however this was not applicable for our case study since we used linear control zones. Perhaps most importantly, none of the instructions suggested verification of realized room illuminance levels using hand held meters. We found this practice paramount to obtaining reasonable results.
Another factor affecting system performance is the control of the
blinds since they are frequently drawn to reduce glare and localized
overheating. Closing just one blind near the photosensor can drastically
alter system dimming response. In our case study we could achieve
as much as 36% dimming savings when the blinds were left open, but
overall savings attributable to dimming diminished to 27% when control
of the blinds was left to the occupants (Fig. 3). While such control
is necessary, less obstruction of visible light is desirable so
that the daylighting system will function as designed.
Conclusions
The retrofit resulted in an significant 76% overall reduction in interior lighting energy use from the original system, with the dimming capacity of the system responsible for approximately 11% (402W) of the total savings. Although this may appear low, it should be kept in mind that the dimming system produced a 27% reduction in lighting energy use for the new lamp/ballast configuration. Our study finds that a daylight dimming lighting system has the potential to save substantial energy, however if all factors influencing system operation are not addressed, then visual comfort and savings may be compromised. Proper commissioning of such systems is therefore seen as vital to realizing full system efficiency potential.
The Next Step
New building designs incorporating spectrally-selective glazings, light gathering devices, and controllable fluorescent ballast technology can offer significant reductions in energy use. However, older buildings with poor orientation and glazing present more challenges to successfully realize daylighting savings. Since the glare and solar heat gain need to be controlled without obstructing the visible light, we plan to apply a spectrally selective window film to exposed east and west windows of the cafeteria during July 1995. Spectrally selective films reject the near infrared solar radiation (heat) while admitting visible light. This is expected to significantly lower air conditioning consumption while also affecting the performance of the dimming system. Although adding the window film to the clear window glazings should theoretically reduce available daylight and dimming system performance (the film we plan to use has a visible transmittance of ~70%), the way in which the lower shading coefficient (0.50) may effect user operation of the east and west window blinds is potentially a large factor influencing the overall results. Since there will be less heat and glare, will the blinds remain open more often resulting in improved dimming savings? Our future research should provide some answers.
References
1. Lighting Handbook.- Reference & Application volume, 8th Addition, New York: Illumination Engineering Society of North America SRC. 1992. Energy Conservation and Energy Efficiency in Florida: Phase I Final Report, SRC Report No. 7777-R3, Synergic Resources Corp. , Bala Cynwd, PA, USA.
2. Parker, D.S., Stedman, T.C. and Sonne, J.K.. 1993. "Side-by-Side Testing of Commercial Lighting Systems", Florida Solar Energy Center FSEC-PF-265-93, Cocoa, Fl, USA
3. Reed, J., Pinkowski, C., Caldwell, B., Mapp, J., White, S. and Hall, N., 1994. "Energy Savings from an Active Daylighting Retrofit and Impact on Building Practices", Proceedings of the 1994 Summer Study on Energy Efficiency in Buildings, Vol. 3., p. 217, American Council for an Energy Efficient Economy, Washington D.C.
4. Rubinstein F., Ward G., Verderber R. 1989. "Improving the Performance of Photo-Electrically Controlled Lighting Systems", Journal of the Illuminating Engineering Society of North America 18, no. 1 pp. 70-94 USA.
5. Rubinstein, F. 19 1. "Automatic Lighting Controls Demonstration: Long Term Results". Lawrence Berkeley Laboratory LBL-28793 Rev. UC-350, Berkeley, CA, USA. IES. 1993..
6. Schrum, L. and Parker, D.S., March 1995. "Daylight Dimming and Energy Savings: The Effects of Window Orientation and Blinds", Florida Solar Energy Center FSEC-CR-792-95, Cocoa, Fl USA
7. Verderber R. and F. M. Rubinstein. 1984. "Mutual Impacts
of Lighting Controls and Daylighting Applications". Energy
and Buildings, 6, pp. 133-140
Presented
at:
Right Light Three
3rd European Conference on Energy Efficient Lighting
June 18-21, 1995 in Newcastle upon Tyne, England
© 2007-2014 University of Central Florida. The Florida Solar Energy Center (FSEC)
is a research institute of the
University of Central Florida.
For more information about FSEC, please contact us or learn more about us.
Find us on Facebook!