

Reference Publication: Parker, D S (1992). Measured natural Cooling Enhancement of a whole House Fan. FSEC-PF-273-92. Florida Solar Energy Center, Cocoa, FL. Disclaimer: The views and opinions expressed in this article are solely those of the authors and are not intended to represent the views and opinions of the Florida Solar Energy Center. |
Measured Natural Cooling Enhancement of a whole House Fan
Danny S. Parker
Florida
Solar Energy Center (FSEC)
FSEC-PF-273-92
Abstract
An experimental study was carried out in the summer of 1991 to investigate the natural cooling potential of use of a whole house fan in Central Florida's hot and humid climate. The residential building, in Cocoa Beach, FL, is typical of much of the existing housing stock in Florida: a concrete block structure with R-11 ceiling insulation. The building was ventilated with all windows open during the three month summer test period (June-August). Air temperatures and relative humidity inside the home interior along with exterior meteorological conditions (insolation, wind speed, air temperature, relative humidity) were scanned every five seconds with integrated averages recorded on a multi-channel data logger every 15-minutes. The house was naturally ventilated during the first half of summer. After a significant period of pre-retrofit summer data had been collected characterizing the building's thermal response, a 24" whole house fan was installed. The house was then force ventilated during evening hours for the remainder of the summer to establish potential of whole-house fans to improve interior comfort conditions. The electrical consumption of the fan was measured at both available fan speeds.
Measurements revealed that the building interior was 3 - 6oF cooler during the evening hours after the whole house fan was operated. However, data also showed that nighttime humidity levels rose: relative humidity increased from 74% to 83% during the nighttime period where fan-powered ventilation was used. Using the data results, an analysis was performed using Orlando, Florida TMY data to see how limits to whole house ventilation based on humidity and temperature conditions would affect the potential of such a cooling strategy.
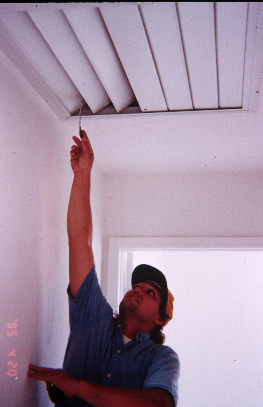
Pressure activated louves on whole house fan installed in central
hallway.
Introduction
Before the advent of vapor compression air conditioning, the use of whole house fans was a popular means to enhancing natural ventilation to achieve greater comfort in hot climates. This paper seeks to empirically determine the potential cooling effect of using a whole house fan to improve the effectiveness of natural ventilation. We also extend the empirical results to a more general analysis of the potential savings of a whole house fan used in conjunction with a conventional air conditioning system. Florida's hot and humid summers represent a very difficult challenge for the utilization of such a cooling strategy. The dry bulb temperature on mid-summer afternoons hovers in the 90s, with very high humidity levels. The popularity of mechanical cooling in Florida reflects the climate; the percentage of air conditioned homes has soared from a mere 18% in 1960 to 95% in 1990 (1,2). Of new Florida homeowners, 98% report some use of air conditioners between May through September of each year (3).
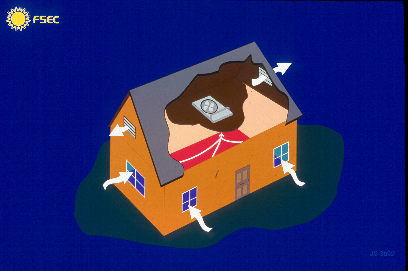
Schematic of whole house fan operation.
However, available data suggest that the longer the natural ventilation season can be extended, the lower will be the overall air conditioning consumption. A study of 384 single family homes, apartments and condominiums in the Central Florida area revealed that each month from May - September that a household claimed to use natural ventilation rather than air conditioning resulted in an average savings of 777 kilowatt hours (kWh) (3). This suggests that considerable electricity can be saved if we can extend the natural ventilation season and air condition only during the hottest periods. The fact that society survived without air conditioning before 1960 indicates that alternatives exist; the goal is to arrive at some acceptable level of comfort. Although options to compressor cooling may be viable in arid climates such as California and the Southwest, potentials in hot-humid climates remain undemonstrated (4).
Monitoring Project
A monitoring study was conducted in Central Florida to learn about important influences on residential cooling energy use in an occupied home in a hot and humid climate. Monitoring began in June, 1990 and has continued up to the current time. The intention of the study was to examine influences of house characteristics on natural cooling potential. The monitored home was air conditioned in the months of July and August of 1990 to examine influences on this large electrical end use. However, during the summer of 1991 the home was not air conditioned to investigate natural cooling potential and how it might be improved through the use of a whole house fan. During the first half of the cooling season the house was naturally ventilated; during the second half of summer the house was forced ventilated by a whole house fan activated during evening hours.
Building Description
The monitored building was the author's home, a single family detached structure with a total floor area of approximately 1,795 square feet. The traditional attached Florida room (a 300 square feet area surrounded by jalousie windows) and garage (200 square feet) were not conditioned. The house, with a conditioned floor area of approximately 1,300 square feet, faces north-south and is located two blocks from the Atlantic Ocean in Cocoa Beach, Florida. Each room in the house had a ceiling fan to improve interior comfort during summer conditions. The floor consists of slab on grade construction without carpeting (terrazzo). Built in 1958, the walls are typical concrete block construction with no insulation. However, approximately four to six inches of fiberglass insulation has been blown into the attic. The attic was ventilated by soffit vents and two roof-top rotary ventilators. The attic is open to the garage space which does not have a ceiling and is open directly to the roof decking. The house was fairly well shaded by a tree on its east face.
Instrumentation
The installed instrumentation, with a total of 13 measurements, was considered important to answer the established research objectives. Site weather data is gathered on ambient temperature, relative humidity, wind speed and horizontal insolation. Temperature, relative humidity and power consumption measurements were taken on the interior of the building. Table 1 lists the data taken in the study.
Table 1. Monitoring Data Set.
Temperature
- Outside air temperature (oF)
- Living room air temperature (oF)
- Kitchen air temperature (oF)
- Supply register temperature (oF)
- Slab floor temperature (oF)
- Attic air temperature (oF)
- Garage temperature (oF)
- Ground temperature (oF)
Single-ended voltage measurements
- Pyranometer (insolation) (W/m2)
- Ambient relative humidity (%)
- Interior relative humidity (%)
Pulse Count Measurements
- Wind speed (10 ft height) (mph)
- Air conditioning (Whrs)
Type-T (copper-constantan) thermocouples were used to record temperatures. The exterior temperature measurement thermocouple was shielded from radiation. Humidity was measured using bulk-polymer resistive type hygrometers. Insolation was measured using a silicon-cell pyranometer with a current output; wind speed was measured with a cupped anemometer which provided pulses to the data logger. Although not used during the test period, AC electrical consumption was recorded using a 30 amp pulse-initiating power meter. All instrumentation was calibrated according to established procedures. A multi-channel data logger provided the data collection with all instruments scanned every five seconds with integrated averages and totals output to final storage every fifteen minutes. The data were removed periodically using an on-site personal computer with a direct link to the data logger. The data were then read into a statistical package for plotting and analysis.
Natural Ventilation
An extensive literature documents the potential of natural ventilation of homes to reduce air conditioning energy use (5,6,7,8). Most of the methods involve maximization of operable window area with a building orientation to take advantage of the prevailing breeze to provide cross ventilation. Thermal mass may be used to moderate interior temperature swings (9). More elaborate architectural features, such as "wingwalls" have been proposed to enhance ventilation (10). However, in all cases the primary intent is to reduce interior building temperatures by promoting air flow through the building when the ambient air is cooler than the interior air. Nighttime ventilation is particularly effective in this regard, especially for arid locations which experience large swings in the daily temperature range. One identified problem is that the lack of a suitably high coincident wind speed can be particularly acute in warm-humid climates. Site wind speeds may be considerably lower than those recorded at the local airport at 10 meters since suburban residential neighborhoods typically feature many local obstructions from other nearby buildings and trees that are close to window height.
The wind speed data collected at the site for the month June, 1991 are shown in Figure 1.
Figure 1. Variation of Wind Speed Over Time: June, 1991.
The measurements were made two feet above the south exposure of the roof-top. Each data point is the average windspeed in mph measured over a 15 minute period. Although located only two blocks from the Atlantic Ocean, the site is characterized during the summer by low incident wind speeds. As in most locations, wind speeds are highest during the afternoon hours dropping to the lowest velocities during the evening hours. Unfortunately, if natural ventilation is to be a viable strategy, a residential building needs the most ventilation during the cooler evening hours when the incident wind speed is lowest.
Influence of Building Mass on Ventilation Potential
The monitored house has concrete wall construction with a slab on grade foundation which is typical of many existing Florida homes. Such massive construction moderates the swing in daily internal air temperatures. Simulation analysis suggests that buildings with a higher thermal capacitance will benefit considerably more from enhanced natural ventilation than will lighter frame buildings (11). Such cooling strategies using the building mass will also provide relatively greater benefits in more temperate or arid climates, since the nighttime temperature depression allows forced cooling of the building mass to provide enhanced daytime comfort.
Figure 2 shows the measured temperature difference between the main zone (living room) of the building and the outside air temperature for the month of June, 1991.
Figure 2. Variation of Delta Temperatures Over Time: June, 1991.
Positive values (TR-Ta) indicate that the temperature is cooler outside than inside the home. As shown, the house interior is usually warmer than the outside for most of the evening hours, with the interior air temperature being lower than the outside air only during the hot mid-day period. The higher interior air temperature during the evening hours is caused both by the thermal storage within the building as well as by the release of heat from occupants and appliances. Comparison with Figure 1 reveals that the period of time when we would most like to ventilate the building (the outside is cooler than the inside), the wind speed is at its lowest. Clearly, some method of inducing building ventilation will be required if comfort conditions are to be achieved.
Figure 3 shows a plot of the average air temperature and living room air temperatures over a five day period in June in which the house was naturally ventilated.
Figure 3. Ambient and Interior Temperatures: Natural Ventilation.
The moderating influence of the building mass is clear; the ambient air temperature both rises higher during the day and, at night, it falls lower than the indoor air temperature. The interior air temperature varies considerably less than that of the ambient. However, the data also show a trend of massive houses which are to be cooled through ventilation. Note that the outside nighttime temperatures are always closer to comfort conditions than the interior air temperature even with windows open. Reasons for this nightly difference are:
- Delayed solar heat flux through the walls of the building
- Internally generated heat from people and appliances elevates interior temperatures.
- Low wind speeds on hot summer evenings that do not provide sufficient ventilation.
Figure 4 shows the average interior air, slab and ambient air temperatures for the entire natural ventilation period in June, 1991.
Figure 4. Average Main Zone and Kitchen Temps: Natural Ventilation.
The data show that on average the outside air temperature becomes less than the interior air temperature at about 4 PM, and that substantial differences exist during the entirety of the evening hours. During this period ambient air temperatures are much closer to comfortable levels.
Whole House Ventilation
These data indicate that forced ventilation at night could provide significant improvements in comfort during periods when natural ventilation is utilized. Such ventilation would help to rapidly remove the accumulated heat within the concrete walls while maintaining comfort conditions to a more acceptable level. Presumably, such forced ventilation would also extend the morning comfort conditions by providing a daytime heat-sink within the massive construction of the house.
To test this hypothesis, a whole house fan was installed in the central hallway of the home in July of 1991. The fan was a 24-inch model with a 1/3rd horsepower motor, designed to draw 3,100 cubic feet per minute (cfm) against a static pressure drop of 1-inch of water. The actual efficiency of the fan was measured using a calibrated flow hood. As installed with the automatic louvers, the whole house fan was measured to produce an average air flow of 1,150 cfm at the low speed setting and 2,060 cfm at the high speed setting. Since the fan motor drew 265 Watts at low speed and 350 Watts at high speed, the results indicate a greater efficiency in air movement (cfm/W) at the high speed setting.
The home was monitored for several weeks to locate before-and-after periods with similar ambient air temperature conditions. Figures 5 and 6 compare interior air and ambient air temperatures during two "hot" weeks in July and August, 1991 in which natural ventilation was used.
Figure 5. July 6-12, 1991: Natural Ventilation.
Figure 6. August 3-9, 1991: Whole House Fan.
During the second week the whole fan was used beginning at 7 PM when the ambient temperature generally became lower than that on the building interior. The fan was shutoff at 7 AM, when the data generally showed the ambient temperature rising above that inside. The windows were opened in the house so that the kitchen area could be ventilated by the fan operation. The living room thermocouple was only indirectly affected by the resulting air flow pattern.
Experimental Data
The increased air flow caused by the whole house fan was quite noticeable near windows during fan operation. Under no-wind conditions, the produced interior air velocities were measured using a hot wire anemometer. The air velocities produced in the center of the kitchen without the fan and with the fan at the low speed and high speed settings averaged 12.1, 53.8 and 75.0 feet per minute (fpm), respectively. The analogous values for the center of the living room were 6.7, 44.0 and 54.8 fpm. Velocities measured near open windows were more than twice the above values. Increased air velocities can have a very beneficial effect on comfort at high temperature conditions. Fanger's Predicted Mean Vote (PMV) for comfort shows a very large influence for air velocities between 0 and 100 fpm (12). PMV is a correlated comfort index based on test responses from a large group of people who were exposed to differing temperature and air velocity conditions.
The effect of fan use on interior temperature conditions was also very noticeable. Before the fan was used, the kitchen and living room temperatures generally floated above the ambient air temperature during all but the hottest part of the day. Use of the fan dropped the nighttime temperatures such that they were much closer to ambient conditions.
The conditions during the no-fan and fan use weeks are summarized in Table 2. Our results show reductions in the evening interior comfort conditions of 3 - 6oF with the largest increases in comfort in the kitchen area. Moreover, the data reveal that the total daily average interior temperature was reduced by over 2.5oF due to the removal of heat from the thermal mass of the building; thus providing for cooler morning temperatures on the interior.
One large problem with the use of whole house fans is their increase in interior humidity levels. Generally, the fans are used during evening hours when outside air in Florida's climate is approaching saturation. Figures 7 and 8 reveal the extent of the problem, comparing the same two weeks for which temperatures were examined in Figures 5 and 6.
Figure 7. July 6-12, 1991: Natural Ventilation.
Figure 8. August 3-9, 1991: Whole House Fan.
Interior relative humidity is plotted against exterior relative humidity for each of the two week periods. Average interior relative humidities were increased by approximately 9 percent when the whole house fan was used from 74% to 83%. These moisture levels are clearly outside relative humidity levels considered acceptable for human comfort (12).
Table 2. The Influence of Whole House Ventilation on Main
Zone and Kitchen Temperatures.
7 PM - 7 AM, Summer, 1991
| Value | Mean | Std Devn | Min | Max |
| No Whole House Fan: July 6-12, 1991
Ambient (oF) Kitchen (oF) Living Room (oF) Interior RH (%) Kitchen (oF) Living Room (oF) Whole House Fan: August 3 - 9, 1991 Ambient (oF) Kitchen (oF) Living Room (oF) Interior RH (%) Kitchen (oF) Living Room (oF) |
80.3
90.5 86.0 74.0 10.20 5.73 80.6 84.6 83.9 82.9 3.95 3.23 |
2.64
2.39 1.90 3.03 1.79 1.41 2.37 2.57 2.21 3.22 1.28 0.79 |
76.1
84.9 82.1 68.0 3.90 1.29 76.5 78.7 80.2 73.3 1.30 1.30 |
88.0
95.7 89.8 82.2 15.70 8.40 87.4 91.0 89.7 91.3 7.50 5.80 |
Generally, the high humidity levels in Florida's outdoor environment serves to exact stringent limits on the usefulness of natural ventilation if interior moisture levels are of concern. As part of our analysis, we examined Typical Meteorological Year (TMY) data for Orlando, Florida to determine how critical weather parameters might influence natural ventilation potential. We analyzed the weather data between May and September to establish the number of hours when ventilation might be feasible. Of the 3,672 hours during this period, some 1,697 hours had an outside air temperature less than 78oF (46% of the time) -- a seemingly promising value. However, scrutiny of the data, shown in Figure 9, shows that the periods with low temperatures during summer coincide closely with the times of highest relative humidity.
Figure 9: Source: Burch, D.M. and Treado, S.J., 1979. "Ventilating
Residences and their Attics for Energy Conservation" in Summer
Attic and Whole House Ventilation. NBS Special Publication 548, National
Bureau of Standards, Washington, DC.
If outside moisture levels are considered, there are only 63 hours during the same period when the temperature is less than 78oF and the outside humidity is less than 70% (2% of the time). These values would seem to suggest that 2 - 46 percent of the air conditioning season might be eliminated by natural ventilation depending on tolerance to elevated interior humidity. Realistically, however, a smaller fraction of the overall space cooling energy would be eliminated, since the hours when ventilation is feasible are precisely those times when building loads are low and mechanical cooling system efficiency is highest. The electricity consumption associated with the twelve hours of fan use at low speed was measured to average 3.2 kilowatt-hours (kWh) per day and 4.2 kWh at high speed. This is approximately one tenth of the air conditioning electricity consumption sub-metered the previous July, which averaged 36 kWh per day.
Whole House Fan Savings with Air Conditioning
In hot-humid climates, practical use of whole house fans will usually require supplemental air conditioning to reach reasonable levels of comfort on the hottest days. The usual mode of operation is to operate the air conditioner during the daytime hours and then to use the whole house fan for nighttime cooling after exterior temperatures have become more acceptable. Most studies of the potential energy savings of such a strategy have been based on hourly building energy simulations carried out in differing geographic locations. These studies are significant in that they have shown potential savings of up to 56% of annual air conditioning electrical use (13). As expected, savings are predicted to become potentially larger as the cooling thermostat setting is advanced to higher temperatures. The absolute savings (kWh) were greatest for the warmest climates (Southeastern and Southwestern U.S.), but greatest in terms of fraction of cooling hours that could be offset in northern regions which experience with large differences in day and nighttime temperatures (14).
More significant than these analytical studies, however, were two empirical studies which measured the performance of a whole house fan in reducing air conditioning consumption. In the first, an instrumented unoccupied house was of typical brick construction and located in Houston, Texas. During the summer monitoring period in 1977 the energy consumption of the air conditioner was measured under two test configurations (15). In the first test configuration, the whole house fan was not used and a central air conditioning system was operated whenever the temperature ranged above 75oF. In the second configuration, the whole house fan was used whenever the outside air temperature was less than 82oF and greater than 75oF. These conditions were usually met only during the summer evening hours.
Figure 10 shows the air conditioning energy use plotted against the daily average outdoor temperature both with and without whole house fan use.
Figure 10: Source: Burch, D.M. and Treado, S.J., 1979. "Ventilating Residences
and their Attics for Energy Conservation,: in Summer Attic
and Whole House Ventilation. NBS Special Publication 548, National
Bureau of Standards, Washington, DC.
On days when the daily average temperature was below 75oF, the whole house fan was able to satisfy all the cooling requirements. Savings in air conditioning consumption from use of the whole house fan varied between 65 percent (19 kWh/day) to 10 percent (5 kWh/day) at a daily average temperature of 76oF and 84oF, respectively. The later temperature represents the hottest daily average temperatures experienced in many locations in the United States.
The second monitoring study was performed on two side-by-side unoccupied houses in Gainesville, Florida in 1982 (16). Both of the frame houses were air conditioned, although one was equipped with a whole house fan and a control which automatically disengaged the air conditioner, opened windows and powered the fan when the ambient air temperature was less than 82oF. The comparative experimental data on the two houses collected during the summer months revealed a 22 percent electricity savings for the house with the whole house fan. The automatic control operated the fan most evenings, with this strategy reducing daily air conditioning use by up to 44 percent on milder summer days.
Several caveats must be made relative to the described savings; realized air conditioning reductions may be lower than suggested. For one, the nightly temperatures may only drop below 82oF for a short period of time during summer evening hours and occupants would have to open windows and operate the fans to realize savings. More importantly, nighttime ventilation under conditions of high ambient levels of humidity may increase the latent cooling load on the air conditioner on the following morning when it is activated. This is due to moisture adsorption into building materials during the ventilation period. A series of experiments were performed on a townhouse in Central Florida which was air conditioned during the day and ventilated at night (17). The data showed that the measured condensate removed by the air conditioner increased from 6.8 to 26.2 liters per day when the house was monitored in a bare, unfurnished state to one with carpet, drapes and a heavy level of moisture adsorbing materials located on the interior. Air conditioning energy use was increased by 10 - 20 percent from the increased latent load. This does not mean, however, that this phenomenon would obviate the savings from whole house ventilation. It does suggest that a house with fewer furnishings (specifically carpet) would incur less latent load on the air conditioner when nighttime ventilation is utilized.
Conclusions
Based on our results, we can draw some conclusions relative to natural cooling potential and the use of whole house fans in hot and humid climates:
- Local wind velocities will often not be great enough to provide continuous comfort using natural ventilation in a typical built-up suburban environment. Forced ventilation will be necessary to provide effective ventilation.
- Massive buildings offer improved interior comfort only if the building can be strongly ventilated by mechanical means at night or if breezes are adequate during the evening hours.
- Nighttime use of whole house fans offer significant potential to enhance natural ventilation when evening wind velocities are low. Interior temperature reductions of 3 - 6oF are possible, even during the hottest weather.
- Ventilation of homes using whole house fans may do best to draw air from the warm kitchen area.
- Consideration of moisture levels can serve to significantly reduce the potential of whole house ventilation in humid climates. Use of a whole-house fan during nighttime hours was measured to increase interior relative humidity by approximately 10%.
- Measured daily whole-house fan energy consumption varied from 3.2 - 4.2 kWh when used 12 hours per day. This compares to a sub-metered air conditioning energy consumption averaging 36 kWh/day during the previous summer. However, the achieved comfort levels of the two modes of cooling were very different and do not lend themselves to a meaningful comparison.
References
- Shrode, W., et al., 1975. Patterns of Energy Consumption in Florida: 1960-1972, Florida Energy Committee, Tallahassee, FL.
- SRC, 1992. Electricity Conservation and Energy Efficiency in Florida: Phase I Final Report, SRC 7777-R3, Bala Cynwd, PA.
- Vieira, R.K. and Parker, D.S., 1991. Energy Use in Attached and Detached Residential Developments, FSEC-CR-381-91, Florida Solar Energy Center, Cape Canaveral, FL.
- Feustel, H., Almeida, A. and Blumstein, C., 1991. Alternatives to Compressor Cooling in California Climates: Review and Outlook, Lawrence Berkeley Laboratory, LBL-30041, Berkeley, CA.
- Givoni, B., 1986. "Ventilation Problems in Hot Countries," Research Report, Building Research Station, Technion-Israel Institute of Technology.
- Byrne, S.J., Huang, Y.J., Ritschard, R.L. and Foley, D.M., 1986. "The Impact of Wind Induced Ventilation on Residential Cooling Load and Human Comfort," ASHRAE Trans., Vol. 92, Pt. 2, pp. 793-803.
- Fairey, P., Chandra, S. and Kerestecioglu, A., 1985. "Ventilative Cooling in Southern Residences: A Parametric Analysis," Proceedings of the 1985 ASHRAE/DOE/BTECC Conference on the Thermal Performance of the Exterior Envelopes of Buildings III, Clearwater Beach, FL.
- Bowen, A., Fairey, P. and Chandra, S., 1981. Passive Cooling by Natural Ventilation: World Literature Review and Annotated Bibliography, Florida Solar Energy Center, Cape Canaveral, FL.
- Givoni, B., 1991. "Performance and Applicability of Passive and Low-Energy Cooling Systems," Energy and Buildings 17, Elsevier Sequoia, Lausanne.
- Chandra, S., Houston, M., Fairey, P. and Kerestecioglu, A., 1983. "Wingwalls to Improve Natural Ventilation: Full Scale Results and Design Strategies," Proceedings of the 8th National Passive Solar Conference, American Solar Energy Society, Boulder, CO.
- Fairey, P., Kerestecioglu, A., Vieira, R., Swami, M. and Chandra, S., 1986. Latent and Sensible Load Distributions in Conventional and Energy Efficient Residences, FSEC-CR-153-86, Florida Solar Energy Center, Cape Canaveral, FL.
- Fanger, P.O., 1970. Thermal Comfort -- Analysis and Applications in Environmental Engineering, McGraw-Hill, NY.
- Kusuda, T. and Bean, J.W., 1981. Savings in Electric Cooling Energy By the Use of a Whole House Fan, NBS Technical Note 1138, National Bureau of Standards, Washington D.C.
- Olszewski, M. and McLain, H.A., 1983. Using a Whole House Fan to Decrease Air Conditioning Energy Use, ORNL/CON-115, Oak Ridge National Laboratory, Oak Ridge, TN.
- Burch, D.M. and Treado, S.J., 1979. "Ventilating Residences and their Attics for Energy Conservation," Summer Attic and Whole House Ventilation, NBS Special Publication 548, National Bureau of Standards, Washington D.C.
- Ingley, H.A., Dixon, R.W. and Buffington, D.E., 1983. Residential Conservation Demonstration Program, prepared for the Florida Public Service Commission, University of Florida, Gainesville, FL.
- Cromer, C.J. and Cummings, J.B., 1987. Thermal Performance Field Monitoring of Various Conservation Construction Techniques, FSEC-CR-172-87, Florida Solar Energy Center, Cape Canaveral, FL.
© 2007-2014 University of Central Florida. The Florida Solar Energy Center (FSEC)
is a research institute of the
University of Central Florida.
For more information about FSEC, please contact us or learn more about us.
Find us on Facebook!