

Reference Publication: Parker, D., Stedman, T., "Measured Electricity Savings of Refrigerator Replacement: Case Study and Analysis", ACEEE 1992 Summer Study on Energy Efficiency in Buildings, Proceedings - Commercial Performance: Analysis and Measurement Panel 3, American Council for an Energy-Efficient Economy. Disclaimer: The views and opinions expressed in this article are solely those of the authors and are not intended to represent the views and opinions of the Florida Solar Energy Center. |
Measured Electricity Savings of Refrigerator Replacement: Case Study and Analysis
Danny
S. Parker and Ted C. Stedman
Florida
Solar Energy Center (FSEC)
FSEC-PF-239-92
ABSTRACT
There are approximately seven million refrigerator-freezers in the State of Florida. The average demand of these units is at least 1,000 MW. The average life of a residential refrigerator is approximately 20 years (U.S. DOE, 1989). At least 25% of Florida's existing stock are old inefficient units built before the advent of recent appliance efficiency standards. The least efficient are existing models of which approximately 5% of the stock is replaced each year. This represents a significant opportunity for efficiency improvement since recently established standards will greatly improve refrigerator efficiency by 1993 (NAECA, 1987). A number of studies have identified technologies that can dramatically improve the efficiency of new refrigerators (Turiel and Heydari, 1988; U.S. DOE, 1989). As example, one analysis found that the annual electrical consumption of an 18 cubic foot refrigerator-freezer could be potentially reduced by 46% to only 515 kWh through the use of improved insulation, high efficiency compressors and fans and adaptive defrost (Turiel et al., 1990).
In order to better define this potential, the Florida Solar Energy Center (FSEC), has conducted a case study of the potential of replacing an existing refrigerator with an energy efficient model to both save energy and alter utility load shape. We also analyzed a database of all available refrigerators manufactured in the U.S. in 1991. This statistical analysis examined differences in refrigerator size and how they may influence annual estimated energy use. Such information may be useful for utility Demand-Side Management (DSM) planners who wish to realize savings from high-efficiency refrigerator programs.
PREVIOUS RESEARCH
The only previous study of the replacement of residential refrigerators in Florida's hot and humid climate was performed by Florida Atlantic University in 1982 - 1983. The study sub-metered refrigerators and freezers in 25 houses for six weeks in the spring of 1982. When the results were extrapolated to a full year, the average Palm Beach household used 3,733 kWh for refrigeration-- 15% of total annual electrical use (Messenger et al., 1983). Seven of the households had a second refrigerator, which substantially increased refrigeration energy end-use. The thirty-two individually metered refrigerators used an average of 2,550 kWh per year. The average size of the existing units was 19.9 cubic feet. Of these 15 were replaced with newer more efficient units. The average consumption of the new units, which was monitored during the spring of 1983, was 1,699 kWh. With Florida's higher indoor ambient temperatures, this represented approximately 20% more electrical use than the average DOE test label estimate. Such a result is in general agreement with findings from field study surveys made of refrigerator electrical use around the country (Spolek, 1985; Meier and Heinemeier, 1988). These conclude that the appropriateness of the DOE test results is influenced by climate. Regardless, the refrigerator replacement program in the 15-unit sample provided a savings in refrigerator electricity end-use of 33%. The estimated reduction to the diversified peak demand from the retrofit was 97 Watts per unit.
STUDY OBJECTIVES
Although the above study indicated that a significant savings potential is available from refrigerator replacement, we desired to perform a more detailed comparison due to the significantly greater efficiency of the current refrigerator models. Also, we wanted to obtain refrigerator load shape data which was unavailable from the previous work. Large sample studies of sub-metered end-use data from other regions of the country indicate that refrigerators exhibit a definite time-of-day load profile (Pratt et al., 1989; Brodsky and McNicoll, 1987).
To address this need for Florida, FSEC conducted a case study of the potential of replacing an existing refrigerator with an energy efficient model to alter utility load shape. Our study objective was to give a verifiable assessment of annual electrical savings and reductions to utility peak loads arising from replacement of an existing refrigerator with a high efficiency model. This task was considered important to convince utility planners of the efficacy of high efficiency refrigerators replacement programs.
DATA COLLECTION AND ACQUISITION
A Campbell C21X data logger provided the data collection for the research effort. A total of eighteen channels of data is recorded. Calibrated copper-constantan thermocouples in the fresh-food and freezer compartments recorded temperatures. Relative humidity was obtained by General Eastern RH-2 bulk-polymer hygrometers. A pulse-initiating watt-hour meter provided data on electrical consumption. All the installed instruments are scanned every five seconds with integrated averages and totals output to final storage every fifteen minutes. The data logger holds 29,000 data values in its volatile memory. With twenty data values stored four times an hour the data logger can store approximately eight days of data before retrieval is necessary. The data has been removed periodically using an on-site IBM personal computer with a direct link to the data logger. The data is then read into a statistical analysis package for plotting and later analysis. With 20 months of data collected thus far, the data retrieval success rate has been 98% with only 11 days of data lost throughout the period.
Consumption of the existing refrigerator was metered for an entire year from June, 1990 to June, 1991. The refrigerator is located in the conditioned space of the primary author's home, a 1,500 square foot residence in Cocoa Beach, Florida. Both kitchen, refrigerator and freezer temperatures were collected as well as recorded door openings. The original refrigerator was manufactured in 1974. It has been in service for approximately 18 years, is similar to other units which are soon to be replaced. The specific model is a 19.2 cubic foot frost-free Sears Coldspot 106-762911 refrigerator-freezer with an automatic ice maker.
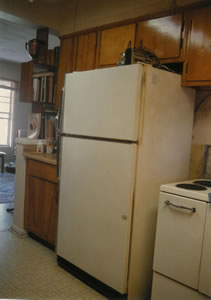
The existing refrigerator was replaced in August, 1991 with the most energy efficient model of its size possessing the identical conveniences (automatic ice-maker, automatic defrost), a 1991 Frigidaire FPES19TIP. As shown in Figure 1, the two refrigerator models have a nearly identical appearance. The newer model has a DOE estimated annual energy use of 760 kWh which is within 8% of being in compliance with the more stringent 1993 appliance efficiency standards.
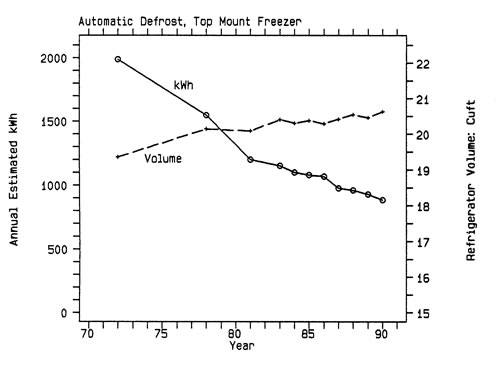
Figure 1. Change in Size and Efficiency of
U.S. Automatic
Defrost Refrigerator/Freezers, 1972-1990
REFRIGERATOR ENERGY USE AND LOAD SHAPE
Residential refrigerator-freezers are commonly assumed to possess a relatively flat load shape. The refrigerator-freezer in the pilot study revealed otherwise. Monitoring showed that the summertime utility peak hour (5 - 6 PM) electrical demand averaged 283 W while the demand from 4 - 5 AM when no door openings or food-loading occurred (the stand-by load) was only 198 watts. Maximum daily electrical demand tended to occur from 7 to 8 PM with a demand of 295 W. This represents an hourly load variation over the course of the day of 49%. even though the house was air conditioned during the hottest part of summer. Annual consumption totalled 1,963 kWh-- a very substantial end-use of electricity in the home. Based on monthly utility bills, the refrigerator represented over 25% of the total annual electrical use in the home. Table 1 summarizes the data taken on the refrigerator performance:
Table 1 Existing Refrigerator Performance |
||||
Value |
Mean |
Std Devn |
Min |
Max |
| Fresh-Food Temp (ºF) | 37.8 |
3.07 |
32.2 |
59.5 |
| Freezer Temp (ºF) | 09.3 |
4.33 |
-4.2 |
44.4 |
| Kitchen Temp (ºF) | 82.6 |
5.71 |
65.4 |
97.2 |
| Daily Door Openings | 42.2 |
29.0 |
0 |
142.0 |
| Daily kWh | 5.38 |
1.17 |
3.24 |
8.28 |
| Electrical Demand (W) | 224.1 |
67.2 |
22.5 |
446.5 |
| 4-5 AM (Standby Load) | 197.7 |
61.5 |
99.0 |
374.4 |
| 8 PM (Maximum Demand) | 295.0 |
54.3 |
174.6 |
397.8 |
| Summer Electrical Demand (W) | ||||
| June-September | 267.7 |
60.7 |
22.5 |
446.5 |
| 2-8 PM (Utility Peak Period) | 280.5 |
62.2 |
22.5 |
446.5 |
| 5-6 PM (Coincident Peak) | 283.5 |
65.5 |
171.9 |
446.5 |
The existing refrigerator was monitored for one complete year to obtain time-of-day demand for each season. This gave an indication of the magnitude of peak and annual electrical demand from older existing refrigerator stock in Florida houses. Figure 2 shows an example of data collected from the existing refrigerator over a five day period in August, 1990. The freezer compartment temperature clearly shows the periodic defrost cycles of the unit (it contains 855 Watt defrost heaters which are powered each eight hours of compressor operation). Heavy use of the unit on August 11th during a dinner party is clearly evident (and a good illustration of the need for occupant reported events that may influence energy use).
 |
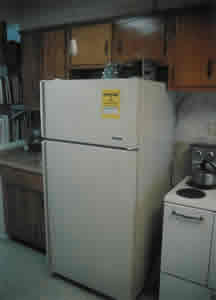 |
Figure 2. Existing
19 Cubic Foot Refrigerator (left) and High Efficiency Replacement Unit (right) |
|
The refrigerators were instrumented with contact switches which recorded refrigerator door and freezer openings. A previous study of 10 refrigerators in townhouses in Twin Rivers, N.J. found an average of 48 fresh-food compartment openings per day with a further 10 freezer compartment openings (Chang and Grot, 1979). Another detailed study of a single refrigerator-freezer in a three person household found 33 average fresh-food openings and 7 for the freezer compartment (Wise, 1983). Average door opening times varied from 7 to 21 seconds. The refrigerator and freezer compartment in the FSEC study two-person household was opened an average of 42 times per day. Figure 3 shows a plot of the time-of-day frequency with which the refrigerator door was opened. As expected, door openings mirror meal preparation schedules and are heaviest subsequent to the evening meal when refrigerator electrical consumption is also at its peak.
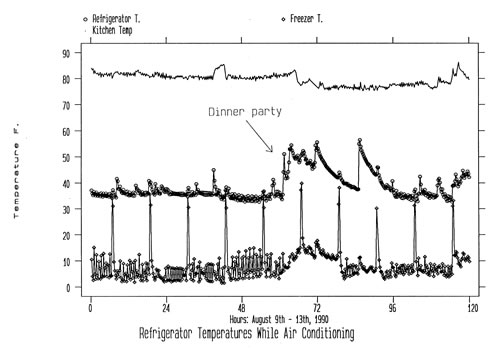
Figure 3. Example of Recorded Refrigerator
and Kitchen Temperatures
To ascertain the relative effect of conditions on the existing refrigerator's daily electric use, a multiple regression model was fit to the collected data. Similar to results obtained by Grimes et al.( 1977), relative humidity was not found to exert a statistically significant influence on consumption. However, we did find kitchen temperature and door openings to account for a good part of the daily variation. The model was:
kWh = -5.79 + 0.121 (Kitchen Temp.) + 0.0095 (Door Openings)
Where:
kWh = daily refrigerator kWh
Kitchen Temp= °F
Door Openings= number of refrigerator door openings per day
R-squared = 0.62
R-squared indicates that about 62% of the daily variation was explained by these factors. Since average daily electricity use was 5.4 kWh with 42 average door openings, this indicates that refrigerator door openings were responsible for approximately 7% of overall consumption. Interestingly, the kitchen temperature turned out to be a better predictor of refrigerator energy use than did the interior to exterior temperature difference.
In August, 1991, the existing refrigerator was replaced with its high-efficiency replacement. The new model has 18.6 cubic feet, a 14.3 cubic foot fresh-food compartment and 4.3 cubic feet of freezer space. The adjusted volume of the unit is 21.3 cubic feet so that its maximum allowable annual energy use under the more stringent 1993 standards would be 696 kWh. At an estimated 760 kWh, the unit is only 8% less efficient than the standard requires for a top-mounted freezer with automatic defrost. The efficiency improvements were obtained with an improved compressor design and cabinet insulation. The compressor uses more copper windings and a heavier iron core to achieve an EER of 5.3 Btu/W at standard conditions (Evaporator temperature = -10 °F, condenser temperature = 130 °F and ambient temperature = 90 °F). The improved insulation results from a low-conductivity high-density foam insulation (which also contains fewer chlorofluorocarbons) and the use of the warm condenser refrigerant line to obviate the need for cabinet anti-sweat heaters. Defrost heater wattage, at 475 W, is also lower than the original unit. The defrost heater is activated every 8-hours of compressor operation for a maximum period of 21 minutes. However, defrost heater operation is usually cut-off in 6 - 8 minutes if the defrost thermostat indicates that the evaporator lines are free of frost build-up. Currently, eight months of monitored data is available with which to characterize the performance of the new unit:
Table 2 Efficient Refrigerator Performance |
||||
Value |
Mean |
Std Devn |
Min |
Max |
| Fresh-Food Temp (ºF) | 39.6 |
1.95 |
28.0 |
55.7 |
| Freezer Temp (ºF) | 10.7 |
2.58 |
-4.1 |
24.8 |
| Kitchen Temp (ºF) | 78.8 |
6.02 |
64.8 |
93.9 |
| Daily Door Openings | 41.9 |
26.6 |
0 |
130.0 |
| Daily kWh | 1.98 |
0.60 |
0.35 |
3.71 |
| Electrical Demand (W) | 82.7 |
42.1 |
12.6 |
93.9 |
| 4-5 AM (Standby Load) | 71.5 |
34.3 |
28.8 |
230.4 |
| 8 PM (Maximum Demand) | 103.8 |
47.8 |
36.0 |
243.0 |
| Summer Electrical Demand (W) | ||||
| August-September | 116.4 |
44.1 |
12.6 |
251.1 |
| 2-8 PM (Utility Peak Period) | 125.6 |
44.1 |
55.8 |
274.5 |
| 5-6 PM (Coincident Peak) | 117.4 |
46.1 |
57.6 |
247.5 |
The energy use over the first eight-months of data collection compares favorably with DOE label predicted value of 760 kWh. If the average electrical demand (87.2 W) continued over the entire twelve month period, the refrigerator would use a total of 724 kWh. However, conditions during the two analysis periods differed somewhat. The interior temperature conditions in the newer refrigerator were slightly warmer, although with a narrower range in the thermostat hysteresis. Attempts to further lower the thermostat setting in the new unit were suspended when freezing became a problem within the fresh food compartment. Weather conditions also varied. The eight month period which has elapsed since installation was cooler than the average over the previous year. Therefore, to obtain comparable results, we used the average electrical demand from August through November (95.1 W) since the average temperature of this period (82.4 °F) closely matched the average annual kitchen temperature from the previous year. This equates to an annual electrical use from the new refrigerator of 833 kWh-- approximately 10% greater than the DOE test value for this particular unit.
Fit of a multiple regression model to daily use data from the newer refrigerator found the same factors significant. However, we did find ambient temperature to now exert a smaller influence on daily electrical use:
kWh = -5.05 + 0.084 (Kitchen Temp.) + 0.0092 (Door Openings)
Where:
kWh = daily refrigerator kWh
Kitchen Temp= °F
Door Openings= number of refrigerator door openings per day
R-squared = 0.85
The fit for the new refrigerator was much better, with 85% of the daily variation explained by this simple model. Each degree of kitchen temperature increase was associated with an 8.4 Wh increase in refrigerator electrical use-- a 31% lower value than for the original unit. The coefficient for the door openings (9.2 Wh each) was remarkably consistent with the previous value. Since average daily electricity use was 2.0 kWh with 42 average door openings, this indicates that refrigerator door openings were responsible for approximately 19% of the overall consumption in the newer unit. The remaining unexplained variation may be due to unmeasured effects such as food loading and length of door openings.
MEASURED SAVINGS AND INFLUENCE ON LOAD SHAPE
The annual energy savings of the replacement refrigerator relative to the original unit totalled 1,130 kWh-- a reduction in energy use of 57.6%. Figure 4 and 5 show the comparative daily energy use of the two refrigerators as they varied with average kitchen temperature. The plot symbols are the number of times the refrigerator and freezer door were opened on each day. The data show that the newer unit uses much less electricity on average, its demand is less sensitive to ambient temperature and its daily electrical use exhibits less variation in general than the original unit.
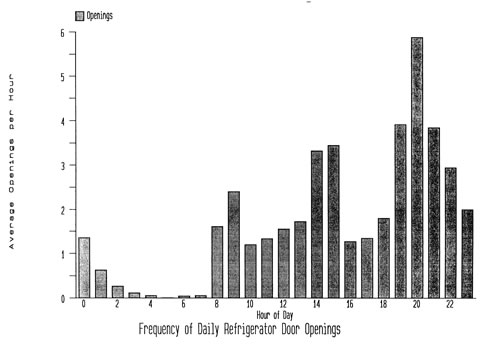
Figure 4. Average of Refrigerator Door Opening
Frequency Over the Daily Cycle
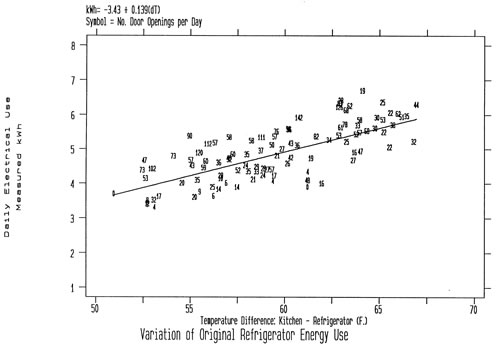
Figure 5. Variation of Existing Refrigerator
Daily Energy
Use with Kitchen Temperature and Door Openings
The seasonal nature of refrigerator electrical consumption is well established (Chang and Grot, 1979; Meier and Heinemeier, 1988; Nelson and Short, 1990). Daily electrical use of the existing refrigerator exhibited strong seasonal variation. However, one advantage of the more efficient refrigerator was that its seasonal load varied less. Figure 6 shows how the daily electrical use of the original refrigerator varied over the course of the year of monitoring. As expected, the energy use responds strongly to variation in the daily kitchen temperature. The lower plot of the replacement refrigerator in Figure 7, while necessarily incomplete due to the on-going status of the second year of monitoring, clearly shows much lower electrical consumption as well as less seasonal variation in use.
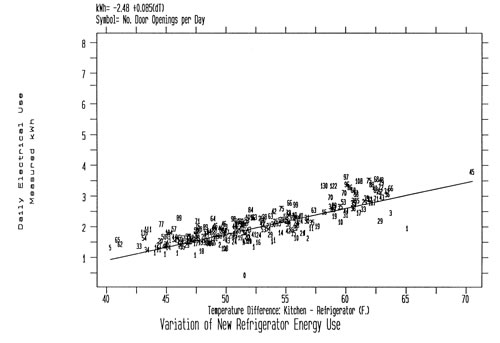
Figure 6. Variation of New Refrigerator Daily
Energy
Use with Kitchen Temperature and Door Openings
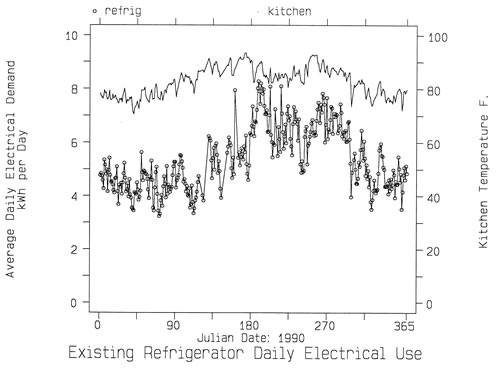
Figure 7. Seasonal Variation in Daily Electricity
Use for Existing Refrigerator
A major objective of the study was to examine the effects of refrigerator replacement on electrical load shape. Figure 8 depicts the electrical demand of the original refrigerator over the month of June, 1990. Even with the scatter, a time-of-day use pattern for the refrigerator is apparent; electrical demand is lowest in the early morning hours and highest at 8 PM after dinner preparation. Figure 9 plots the load shape for the hottest-month of August for the more efficient refrigerator. The average electrical demand is reduced by more than half (287 vs. 122 Watts). Also depicted for both units are the average summer load profiles as a series of box plots. These graphs show another advantage of the more efficient refrigerator: the load varies less throughout the course of the day. The average hourly load of the original refrigerator varied by almost 100 W, while the replacement unit's demand only fluctuated by 30 W throughout the daily cycle. Such characteristics may be desirable for utility planners who seek to smooth the overall daily end-use load profile.
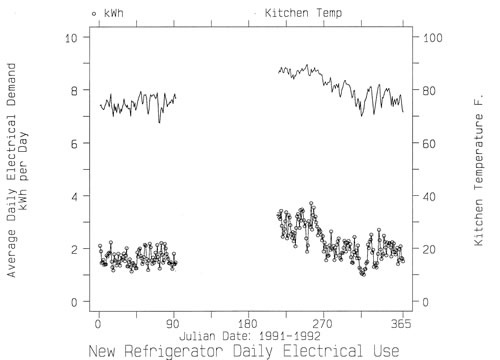
Figure 8. Seasonal Variation in Daily Electricity
Use
for New Refrigerator (8 months of available data)
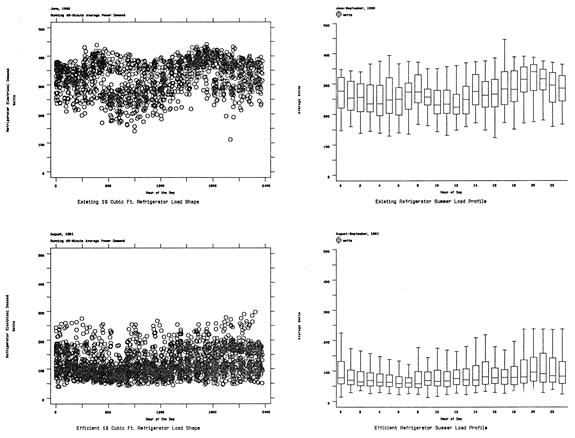
Figure 9. Comparison of Summer
Variation in Hourly Electrical Demand for
Existing Refrigerator (upper plots) and High-Efficiency Unit (lower
plots)
A comparison of late-night stand-by electrical demand showed that the replacement unit used used 36% of the energy consumed by the original unit to maintain food storage at a given condition. This likely results from a lower level of cabinet heat gain and a more efficient compressor. Reduction in utility coincident peak demand from 5 - 6 PM was 59% or 166.1 Watts.
Assuming that similar reductions could be achieved for the 25% of Florida's refrigerator stock that is inefficient and awaiting replacement, the total state-wide peak demand reduction would amount to nearly 300 MW. This is similar in magnitude to the output of a new combined cycle power plant. Although this represents only a single study of refrigerator replacement efficiency potential, this goal may be attainable since utility DSM programs which begin in the next year will enjoy the further savings brought about by the more stringent 1993 appliance standards.
ANALYSIS OF 1991 REFRIGERATOR ENERGY USE CHARACTERISTICS
Obviously, the above study represents an idealized case, since the existing refrigerator was replaced with a unit of an identical size and type. However, in a real-world setting the savings available from replacing older, less efficient refrigerators with newer models may be limited by the energy use characteristics of the new stock and how consumers select from the various options and features. Utility refrigerator DSM programs face several potential hazards in this regard:
-
Users may opt for a larger refrigerator, which may use more electricity.
-
Users may choose a refrigerator configuration that is less efficient.
-
Users may select features that increase energy use.
A good illustration of these potential problems was evidenced in a new residential construction project which measured refrigerator energy use of "efficient" units against "base" units (Quaid et al., 1991). The study found no savings for the "efficient group" due to homeowner choice of larger refrigerators and those with more conveniences relative to the base group. We also note that many homeowners are selecting larger side-by-side units with though-the-door (TTD) ice and water dispensers. To determine the potential impact of such a tendency, we statistically examined all available refrigerators in the Association of Home Appliance Manufacturer's directory for 1991 (AHAM, 1991). The 1,541 refrigerator-freezers were classified into eight distinct types based on their configuration and major features.
Table 3 Comparison of 1,541 1991 Refrigerator Models by Type and Size |
||||
| Configuration Description |
No. Models |
Volume cu. ft. |
Avg. kWh |
Normalized Use (kWh/cu. ft.) |
| 0) Single-door, man. defrost | 133 |
4.9 |
377.0 |
112.6 |
| 1) Single-door, auto. defrost | 14 |
12.6 |
602.2 |
63.5 |
| 2) Side-by-side, auto. defrost | 434 |
22.6 |
1251.2 |
55.6 |
| 3) Top freezer, partial auto. def. | 36 |
12.3 |
708.2 |
62.1 |
| 4) Top freezer, automatic defrost | 905 |
18.0 |
885.1 |
49.9 |
| 5) Bottom freezer, part. auto. def. | 2 |
3.9 |
544.3 |
139.6 |
| 6) Bottom freezer, auto. defrost | 14 |
21.1 |
1145.6 |
54.2 |
| 7) Top freezer, man. defrost, superinsulated | 3 |
14.7 |
261.3 |
17.7 |
Total |
1541 |
18.0 |
938.4 |
57.4 |
The data from the DOE tests are shown graphically in Figure 10. This plot displays the model type indexed against its annual estimated electrical demand and interior volume. The DOE test results have been shown to reasonably approximate real-world consumption of refrigerators, although some bias was evidenced by climate and vintage (Meier and Heinemeier, 1988). The scatter plot shows that consumption varies principally with the refrigerator size although substantial variation is seen by configuration type and by individual models. Two refrigerator configurations, top-freezer and side-by-side units with automatic defrost capability make up 87% of the models produced. However, the data also show that the side-by-side models use 41% more electricity on an absolute basis and 11% more energy even when corrected for the differences in interior volume. This characterization mirrors a monitoring study of 119 sub-metered refrigerators which found that side-by-side units used 39 watts more than other refrigerator styles (131 W)-- a 30% increase in electrical use (Ross, 1991).
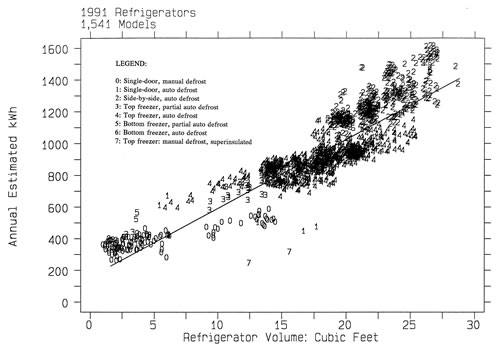
Figure 10. Comparison of the Electricity Use
of All
1991 U.S. Refrigerator/Freezers by Size and Type
Finally, a statistical model was fit to the data to determine the magnitude and importance of the various configurations and design features. With annual DOE test kWh as the dependent variable the multiple regression model examined how refrigerator volume, defrost type and configuration influence energy use:
kWh = 27.36(cubic feet) + 554.3(auto def.) + 528.3(part. auto defrost)
+ 538.7(man. def.) - 296.5 (single door) + 79.2(side-by-side)
- 162.8 (top freezer) - 515.8 (superinsulated)
R-squared = 0.929
n = 1,541
The fit is very good, with the resulting equation predicting nearly 93% of the observed variation in the DOE test results. The t-values in brackets show that all included variables were significant at better than a 99% level. The results indicate that the major influences on refrigerator energy use is their volume, configuration type and insulation level. Each cubic foot of interior volume was estimated to increase annual electrical use by 27.4 kWh. Single door and top freezer units were most efficient. Single door units generally have a smaller door seal area (lower heat gain) and bottom mounted freezer units suffer reduced efficiency from the increased power to move cold air to the top of the fresh food compartment and the supplemental heaters in the crisper to prevent food freezing. Side-by-side units were least efficient, likely due to their greater door seal area and the proximity of the freezer floor to the hot motor compartment containing the compressor and condenser. The superinsulated, manual defrost, dual-compressor Sunfrost units used much less electricity than average.
ENERGY USE ATTRIBUTABLE TO CONVENIENCE FEATURES
In noting the increasing popularity of side-by-side refrigerators we also performed a small study comparing the DOE test predicted energy use of models from individual manufacturers which have units which only differ by the presence of through-the-door (TTD) features. A total of 24 such matched pair models were discovered by examining literature from several manufacturers. A statistical comparison of the data in Table 4 and Figure 11 shows that these features increased DOE test estimated electrical use by an average of 10.3% (120 kWh/year).
Table 4 Comparison of 24 Side-by-Side Refrigerators: Matched Pair Annual kWh with and without TTD |
|
Case |
Avg. Ann. kWh |
Without TTD Feature |
1166.5 |
With TTD Feature |
1286.5 |
Difference |
120.0 |
Percent Increase |
10.3% |
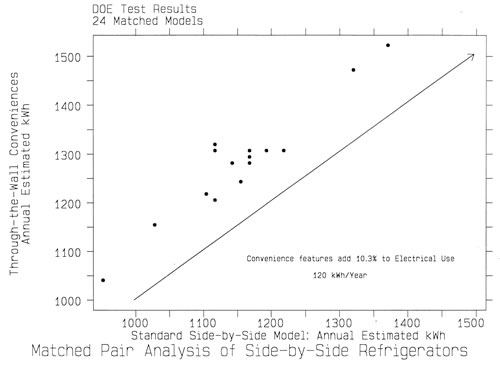
Figure 11. Matched Pair Comparison of Electricity
Use of Side-by-Side
Refrigerators with and without Through-the-Door Features
A fundamental question, yet to be answered, is how this increase is ameliorated by the reduced opening of the freezer and main food compartment to obtain ice and chilled water. Based on our data, and from other sources, it appears that refrigerator door openings make up a relatively small fraction of overall refrigerator thermal load. One detailed study showed that reducing fresh food and freezer compartment door openings by 50% (40 fewer opening each day) lowered electrical demand by only 11% at an 85 °F ambient temperature (Alissi et al., 1988). Another study, performed in a laboratory setting, showed only a 6% increase in electrical consumption associated with a reasonable schedule of door openings over closed only operation (Grimes et al., 1977). Since, the realized reductions in door opening from such features is likely to be less than 50%, such conveniences may actually increase consumption over units without them. On the other hand, side-by-side refrigerator-freezers may be more efficient in application if the larger freezer compartment can obviate the need for a separate household food freezer.
Automatic ice makers are also becoming a highly desirable convenience for refrigerator-freezers. Ice-makers are often an add-on feature to many refrigerators and the DOE test procedure does not take their use into account when estimating energy use. However, measurements made using the test procedure showed that ice-makers can increase test estimated energy use by up to 20% when operated continuously (BR Laboratories, 1986).
Ice maker use in the replacement refrigerator in the FSEC study was monitored over a period of one week. Each cycle of the ice-maker was found to produce 8 ice cubes with a weight of almost exactly 0.5 lbs. Maximum ice production was measured at 4.4 pounds per day (9 cycles). Of course, ice-maker use will depend on ice consumption. Operation over a one-week spring period averaged 5.7 cycles per day. Demand for ice in a hot climate like Florida may be greater than other regions; another study of a single refrigerator in Gaithersburg, Maryland found 2.4 ice-maker cycles per day (Wise, 1983). Assuming a 70 °F temperature difference between the supply tap water and the freezer interior, along with the latent heat of fusion of ice amounts to a thermal load of 31 Watt-hours (Wh) per cycle. To this must be added the energy use of the 165 W ice mold-heater, which operates for approximately 1 - 2 minutes each cycle. Total ice-maker average electrical use is approximately 36 Wh per cycle or 132 Wh per day at the compressor's operational coefficient of performance. With the given unit, the ice maker is probably responsible for approximately 6% of the annual refrigerator electricity use.
These results underscore the need for higher efficiency refrigerators which incorporate such conveniences. Projects such as the "Golden Carrot" Super-Efficient Refrigerator Program (SERP) should insure that side-by-side models and improvements to convenience feature efficiency are not overlooked in the quest for improved efficiency (CEE, 1991). To ignore consumer demand for such conveniences will miss mainstream efficiency improvement opportunities.
CONCLUSIONS
A two-year field study in Florida showed that large savings were available from replacement of a 1974-vintage 19.2 cubic foot refrigerator-freezer with the most efficient unit currently available of its size and type. Both refrigerators have a top-mounted freezer with an ice-maker and automatic defrost. The original refrigerator was monitored for a full year with data recorded at 15 minute intervals. The newer, more efficient refrigerator has been monitored for eight months.
The existing refrigerator was found to use 1,963 kWh over a year or fully 25% of the home's overall electrical use. The DOE estimated energy consumption of the new efficient model (760 kWh) is within 8% of the more stringent 1993 appliance efficiency standards for a refrigerator of its size. Likely due to Florida's warmer climate, the monitored energy use of the new refrigerator (833 kWh) was approximately 10% greater than that suggested by the DOE test label. Measured annual electrical consumption was reduced by 1,130 kWh-- a reduction of 58%.
Both refrigerators exhibited a definite pattern of both seasonal variation in energy consumption as well as a changing load profile over the daily cycle. Maximum monthly energy consumption occurred in August with the maximum daily electrical demand from 7 to 8 PM. The improvement in the utility coincident peak demand at 5 - 6 PM from the refrigerator replacement amounted to 166.1 Watts, a 59% decrease. Assuming that similar reductions could be achieved for the 25% of Florida's refrigerator stock that is inefficient and awaiting replacement, the total peak demand reduction would amount to nearly 300 MW.
However, the savings available from replacing older, less efficient refrigerators with newer models may be limited by the energy use characteristics of the new stock and how consumers select from the various options and features. Users may opt for larger refrigerators, less-efficient configurations or convenience features that increase energy use. A statistical analysis was also performed on the characteristics of all 1,541 available refrigerators in 1991 to determine potential impacts. Results showed that:
Top-freezer and side-by-side units comprise 87% of the units produced.
Manual and partial automatic defrost units use less electricity.
Units with top mounted freezers are more efficient (160 kWh/yr)
Side-by-side units tend to be larger and use 41% more electricity.
Through-the-door features increase consumption by roughly 10%.
Superinsulated units use half as much energy as comparable types.
Ice-makers can increase refrigerator energy use by 6% or more.
The study concludes electrical efficiency gains from refrigerator replacement are potentially large. However, efforts to further improve refrigerator efficiency should address the increasing consumer demand for conveniences such as side-by-side units with ice makers and through-the-door features to capture mainstream efficiency opportunities.
REFERENCES
AHAM, 1991., "1991 Consumer Selection Guide for Refrigerators and Freezers," Association of Home Appliance Manufacturers, Chicago, IL, 1991.
Alissi, M.S., Ramadhyani, S. and Schoenhals, R.J., 1988. "Effects of Ambient Temperature, Ambient Humidity, and Door Openings on Energy Consumption of a Household Refrigerator-Freezer," ASHRAE Transactions, Vol. 88, Pt. 2, Atlanta, GA.
BR Laboratories, 1986. Final Report on Laboratory Testing of Certified Refrigerator/Freezers, prepared for the California Energy Commission, Agreement No. 400-84-011, Huntington Beach, CA, 1986.
Brodsky, J.B. and McNicoll, S.E., Residential Appliance Load Study, Pacific Gas and Electric Company, Research Section, Berkeley, CA, September, 1987.
CEE, 1991. "Super Efficient Refrigerator Program, Inc., " Consortium for Energy Efficiency, Sacramento, CA, 1991.
Chang, Y.L. and Grot, R.A., 1979., Field Performance of Residential Refrigerators and Combination Refrigerator Freezers, NBSIR 79-1781, National Bureau of Standards, Washington D.C., July, 1979.
Grimes, J.W., Mulroy, W. and Shomaker, B.L., 1977. "Effect of Usage Conditions on Household Refrigerator-Freezer and Freezer Energy Consumption," ASHRAE Transactions, Vol. 83, Pt. 1, Atlanta, GA., 1977.
Meier, A.K. and Heinemeier, K.E., 1988. "Energy Use of Residential Refrigerators: A Comparison of Laboratory and Field Use," ASHRAE Transactions, Vol. 94, Pt.2, Atlanta, GA.
Messenger, R., Hays, S., Duyar, A., Trivoli, G., Vincent, J., Guttman, M., Robinson, J., Litschauer, B., Jarvis, J. and Pages, E., 1982. Maximally Cost Effective Residential Retrofit Demonstration Program, prepared for the Florida Public Service Commission, Florida Atlantic University, Boca Raton, FL.
NAECA, 1987. National Appliance Energy Conservation Act, Public Law 100-12, March 17, 1987.
Nelson, P. and Short, J., 1990. "Analysis of 12 Japanese Refrigerators in the Northwest," Vol. 1, Proceedings of the 1990 Summer Study on Energy Efficiency in Buildings, American Council for an Energy Efficient Economy, Washington D.C., August, 1990.
Pratt, R.G., Conner, C.C., Richman, E.E., Ritland, K.G., Sandusky, W.F., Taylor, M.E., 1989. Description of Electric Energy Use in Single-Family Residences in the Pacific Northwest: End-Use Load and Consumer Assessment Program (ELCAP), Bonneville Power Administration, DOE/BP-13795-21, Portland, OR, April, 1989.
Ross, B.A., 1991. End-Use Load and Consumer Assessment Program: Analysis of Residential Refrigerator/Freezer Performance, Pacific Northwest Laboratory, PNL-7656, September, 1991, Richland, WA.
Turiel, I. and Heydari, A., 1988. "Analysis of Design Options to Improve the Efficiency of Refrigerator-Freezers and Freezers," ASHRAE Transactions, Vol.94, Pt. 2, Atlanta, GA.
Turiel, I., Berman, D., Chan, P., Chan, T., Koomey, J., Lebot, B, Levine, M.D., McMahon, J.E., Rosenquist, G. and Stoft, S., 1990. "U.S. Residential Appliance Efficiency: Present Status and Future Directions," Vol. 1, Proceedings of the 1990 Summer Study on Energy Efficiency in Buildings, American Council for an Energy Efficient Economy, Washington D.C., August, 1990.
Quaid, M., Kunkle, R. and Lagerberg, B., 1991. Residential Conservation Demonstration Project Cycle 2 Appliance Analysis, Washington State Energy Office, Olympia, WA, August, 1991.
Spolek, G.A., 1985. Field Performance of Refrigerators, Bonneville Power Administration, Portland, OR, December, 1985.
U.S. DOE, 1989. Technical Support Document: Energy Conservation Standards for Consumer Products: Refrigerators and Furnaces, DE/90-003491, U.S. Department of Energy, Washington D.C., November, 1989.
Wise, R.A., Field Performance Test Results on the Performance of a Refrigerator-Freezer in a Single Family Residence, NBSIR 83-2653, National Bureau of Standards, Washington D.C., January, 1983.
© 2007-2014 University of Central Florida. The Florida Solar Energy Center (FSEC)
is a research institute of the
University of Central Florida.
For more information about FSEC, please contact us or learn more about us.
Find us on Facebook!