

Reference Publication: Parker, D.S., Fairey, P.W. and Gu, L., "A Stratified Air Model for Simulation of Attic Thermal Performance," Insulation Materials: Testing and Applications, Volume 2, ASTM STP 1116, R. S. Graves and D. C. Wysocki, Eds., American Society of Testing and Materials, Philadelphia, PA., 1991. Disclaimer: The views and opinions expressed in this article are solely those of the authors and are not intended to represent the views and opinions of the Florida Solar Energy Center. |
A
Stratified Air Model for Simulation
of Attic Thermal Performance
Danny
Parker, Phillip Fairey, and Lixing Gu
Florida
Solar Energy Center (FSEC)
FSEC-PF-226-91
Abstract
An improved computer simulation model for attics has been developed. The model accounts for detailed radiation, buoyancy and wind driven air flows and thermal stratification within the attic airspace. Through comparison with measured data, the paper examines the relative importance of the various modeling parameters and assumptions upon simulation accuracy. Stratification of the attic air was found to be a critical modeling characteristic which is typically ignored in building energy simulations. Both model and measurement results shows that air stratification increases significantly when low-emittance surfaces are included.
Keywords
Attics, thermal performance, attic ventilation, simulation models, radiant barriers.
Introduction
The critical importance of accurate modeling of thermal processes in residential attics has been acknowledged for some time. Monitored performance of Twin Rivers town-houses showed that 35% of winter heat losses in New Jersey could be attributed to attic heat transfer mechanisms [1]. Recent research at the Florida Solar Energy Center suggests that attic thermal conditions may have critical importance to air conditioning demand when air distribution supply ducts are located within the attic space [2].
The existing design data for attic spaces in the ASHRAE Handbook of Fundamentals is based on early experimental work performed by Joy [3,4]. This research and that of others has shown that radiation accounts for the majority of the total heat transfer from an insulated attic to the house interior. Attic ventilation was determined to play a relatively minor role in heat gain across the attic airspace [5,6]. However, when at least one surface in the attic has low emissivity characteristics, such as with radiant barrier systems (RBS), attic ventilation rates and ventilation air flow paths become relatively more important to performance [7]. Recent studies have evidenced increased stratification of air temperatures within attic spaces when radiant barriers are installed [8,9].
Previous Research
A number of past investigators have developed models to simulate attic thermal performance. Joy created a steady state attic heat balance model in order to generalize his experimental study of attic thermal performance. As described by Wilkes, the model solves a series of simultaneous differential equations which considers inside and outside boundary conditions, direct radiation exchange between the inside roof surface and floor and ventilation [10]. The model did not accommodate capacitance, temperature dependent convective heat transfer coefficients or heat transfer through non-roof/non-floor surfaces such as gable roof ends. Blancett et al. created a transient attic simulation for the Electric Power Research Institute (EPRI) which remedied some of these faults and allowed time-related calculation of attic performance [11]. However, this model did not explicitly model radiative transfer, assumed the attic air was well mixed and treated heat transfer coefficients as non-temperature dependent functions. Three hourly computer simulation models, TRNSYS [12] and NBSLD [13] and BETEH [14] have subroutines that calculate dynamic attic thermal performance. Although attic air temperatures estimated by NBSLD showed reasonable agreement with a monitored Houston, Texas attic, all of these calculation schemes have similar limitations to the EPRI model.
A more comprehensive transient attic model was developed by Peavy [16]. Radiative exchanges within the attic space were explicitly modeled as was thermal capacitance and temperature dependent convective heat transfer coefficients at the various surfaces. As with Joy's model, the ventilation air is not assumed to be well mixed in the horizontal dimension. This results in a more realistic description of the attic's horizontal thermal regime. However, Peavy's model ignored the effects of gabled roof ends and the effects of thermal buoyancy on attic ventilation rates. Wilkes developed a modification of Peavy's model for use by Owens Corning Fiberglas (OCF) which included gabled roof ends and improvements in the correlations for convective heat transfer coefficients [16]. The algorithm did not, however, include buoyancy in the estimation of attic ventilation rates or vertical thermal gradients. Comparison of the various models with a calibrated thermal research facility showed the OCF model to give the best prediction of actual attic thermal performance of the previous models.
Recently, Fairey and Swami created a simplified steady-state attic model [17]. A key difference in the model was that the attic air space was split into two nodes to simulate thermal stratification. The model showed good agreement with Joy's measured steady-state data. The investigators also studied the effects of moisture absorption and desorption within an experimental attic using a very detailed attic simulation incorporating combined heat and moisture transfer. These simulations showed moisture phenomenon to be important to adequate thermal modeling of attics. This agrees with previous findings by Cleary [18] and Ford [19].
Description of a Two Zone Attic Thermal Model
In order
to more accurately characterize the thermal regime of residential
attics, a two zone model of the attic domain was developed. The
model allows explicit treatment of thermal stratification within
the attic air space. A predictive model of attic ventilation rates
was also created using very detailed building simulation, FSEC 2.1
[20]. This finite element computer program has been used study complex
interactions within the building; it is possible to characterize
thermal as well as moisture absorption and desorption properties
within the attic zone. The model's predictions were later validated
using monitored data. This data was taken from measurements made
in three attic test cells at FSEC's Passive Cooling Laboratory (PCL)
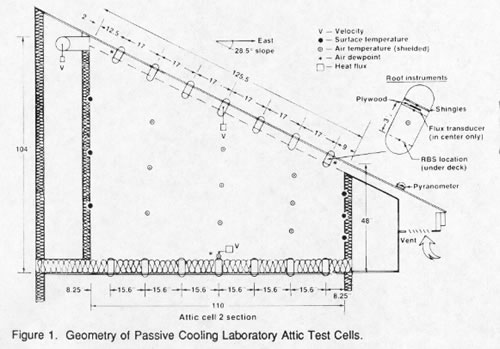
in Cape Canaveral, Florida. The geometry and measurement locations
of these test cells is shown in Figure 1.
Radiant Heat Transfer
Radiative heat transfer is the dominant heat transfer mechanism in residential attics, particularly during summer conditions. The radiation component of attic heat transfer is governed by radiative exchange between pairs of surfaces of a 'N' surface enclosure in accordance with the surface temperature differences, their emissivities, view of the other surfaces and the Stefan-Boltzmann constant. For a pair of surfaces the net radiative heat transfer per unit area is:
Qrad = {σ (T24 - T14) / [(1/ ε1) + (1/ε2)] }*
F
Where
σ = Stefan-Boltzmann constant (5.67 x 10⁻⁸)
T = temperatures of surfaces (°K)
ε = the emissivities of the attic surfaces (dimensionless)
F = view factor (dimensionless)
For the five major surfaces in a simple residential attic (two roof decks, insulation surface, two gable roof ends), the problem is complex. This general equation is transformed to use script-F factors [21] to account for total enclosure emissivity and view factors with respect to each surface:
Qi = Ai Σσ Fij (T*i4 - Tj4)
Where
Ai = areas of surfaces
Fij = script - F factor (dimensionless)
The emissivities of the various surfaces within the attic are taken from ASHRAE [22] and Cess and Sparrow [23].
Convective Heat Transfer
Convective heat transfer coefficients for inside surfaces in the attic enclosure were estimated based on the correlations adopted by ASHRAE [24]. These relationships account for surface orientation and instantaneous temperature differences between the surface and the air node. Natural convection was assumed to be turbulent since measured air velocities over attic surfaces, even under windy conditions with combined ridge and soffit vents, are well below 3 meters per second [8,9,18]. The values for the convective heat transfer coefficients are taken from McAdams [25]:
for vertical surfaces:
hn,v
= 1.31 * (Tsurf - Tair)0.33
for heat flow down:
hn,d
= 0.76 (Tsurf - Tair)0.33
and for heat flow up:
hn,d
= 1.52 (Tsurf - Tair)0.33
for roof surfaces which are neither vertical or horizontal with heat flow down:
hn,rd,d
= {1.805 (Tsurf - Tair)0.33}/{1.375 + cos (β)}
and with heat flow up:
hn,rd,u = {9.624 (Tsurf - Tair)0.33}/{7.333 - cos (β)}
Where
hn = convective heat transfer coefficients (W/m2⋅K)
Tsurf = temperature of component surface (K)
Tair = temperature of air node (K)
β = roof slope pitch angle (degrees)
Although air movement in attics is generally assumed to be dominated by natural convection, attic ventilation may increase surface heat transfer due to forced convection. For instance, Metais and Eckert [26] demonstrated that a mixed convection regime between turbulent and laminar flow regimes will tend to increase free convection over the assumption of uniform turbulent flow.
In order to accommodate potential forced convection, a forced convection term was added for attic surfaces to estimate its magnitude. Peavy recommends the following relationship for turbulent flow over smooth flat plates at low air velocities (V < 3 m/s) [27]:
hf = 7.176 (Va)0.8 L-0.2
Where
hf = the forced air convection coefficient (W/m2⋅K)
Va = attic air velocity over surfaces (m/s)
L= the air flow path length (m)
The air flow path length is taken as the sum of the soffit to ridge vent distance and the attic height. The calculation of average air velocity over attic surfaces is problematic since interior attic air flows are complex. Ford and others have estimated attic air flow velocity based on the volumetric rate of ventilation over the cross sectional area of the attic perpendicular to the direction of flow [28]:
Va = ACsec (Vola)/Afp
Where
Vola = attic volume (m3)
Afp = cross sectional area of air flow path (m2)
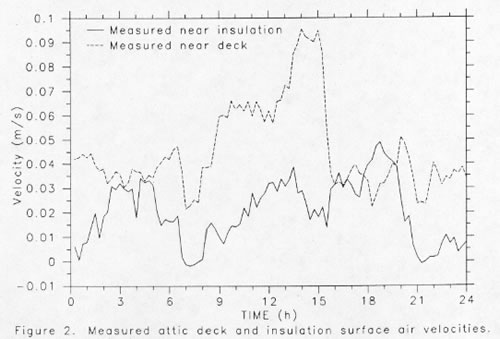
Unfortunately, such a calculation greatly underestimates the actual air velocities proximate to the attic heat transfer surfaces, particularly for the roof deck, since air flow through the attic is non-uniform. Figure 2 shows the relationship between measured roof deck and insulation surface air velocities inside the PCL over the course of a summer day. Other data shows air velocities over attic surfaces at least as great as those measured at the PCL. Ober [29] used smoke pencils to visualize air flow patterns in two test attics in Florida which had relatively low overall ventilation rates (~1.5 ACH). The tests showed that a considerable fraction of the air flowed along the bottom of the roof deck in all tests with two flow layers; a thin fast moving boundary layer with measured velocities of 0.30 - 0.46 m/s and slower boundary region with a measured air velocities of 0.10 - 0.20 m/s. Air movement over the insulation surface was lower, averaging 0.03 to 0.09 m/s.
A simple empirical model was developed based on measured air velocity measurements in made in the PCL. Average attic roof deck and insulation surface air velocities wer approximated as:
Va,surf = {v2/hb2 + (4hb g) ΔT/(Tsum)}0.5 - v/hb
Where
ΔT = temperature difference between air node and surface (K)
Va,surf = air velocity over deck or insulation surface (m/s)
hb = boundary layer thickness (0.05 m)
ν = absolute air viscosity (kg/ m/s)
g = gravitational acceleration (9.81 m/s)
Tsum = (Tsurf + Tair)
Va,insul = insulation surface air velocity (m/s)
Peavy's heuristic method for combining forced and natural convection was adopted:
Where
hn = natural convection coefficients calculated for surfaces.
Potential Uncertainties Associated with Convective Heat Transfer
The empirical data which produced the heat transfer correlations in Equations 3 - 7 were based on laboratory measurements using 0.3 m square smooth plates which were parallel to each other with unrestrained air flow at the edges. Actual surfaces in attics are much larger, feature a number of irregular surfaces and are restrained at the edges.
Past research provides reason to question the appropriateness of laboratory estimates of heat transfer for buildings. As example, ElSherbiny et. al [30] performed experiments which showed that convective heat transfer coefficients were increased by up to 50% for corrugated compared to smooth surfaces. Similarly, Anderson and Bohn [31] examined the effect of heat transfer of roughness elements with the same length as the thermal boundary layer. They found that roughness increased the heat transfer rate of a uniformly isothermal wall by 10 - 15% with local increases of 40%. Finally, analysis of measured convective heat transfer by McAdams [32] reveals that heat transfer rates are approximately 10% higher with rough plates versus smooth ones. In lieu of the very uneven nature of attic surfaces a first order approximation is made:
hc' = hc,i * 1.15
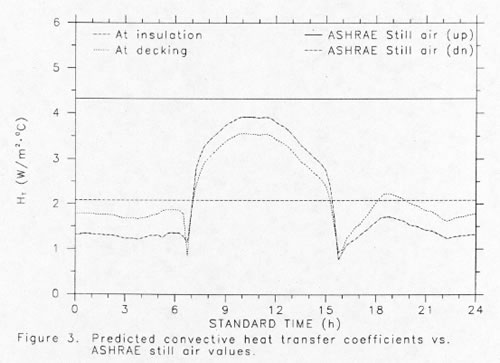
Of perhaps greatest importance in this regard, one notes that the ASHRAE still air heat transfer coefficients for low emissivity materials [33] are considerably higher than the values commonly computed based on the relationships presented by Holman [34] or McAdams [35] as reported in the ASHRAE Handbook. The ASHRAE still air values are based on a 5.5 °K temperature difference between air and surfaces when evaluated at a temperature of 294 °K. Figure 3 shows a plot of the computed convective heat transfer coefficients for the PCL attic insulation surface and roof deck surfaces for October 19th, 1987. Equations 3 - 12 were used to make the estimates. The resulting time varying values are compared to the ASHRAE still air coefficients for those same surfaces at the respective tilts for each surface. A large discrepancy in the convective value for the insulation surface is obvious. Due to their larger magnitude, use of the ASHRAE still air values result in a much better calculation of the attic lower zone air and insulation surface temperatures. This research found that heat transfer coefficients calculated using the above equations were satisfactory if the value for the insulation surface was increased by 100%. This resulted in very accurate predictions of the various attic surface temperatures (see Figures 9 and 10).
In general,
it is concluded that convective heat transfer coefficients associated
with building elements, such as commonly found in residential attics
may have relatively higher heat transfer rates that the common simplified
assumptions arising within most building simulations. Certainly
one must stretch the analogy to propose a fibrous insulation surface
to possess the convective heat flow characteristics of a small smooth
flat plate with unrestrained air flow at the edges.
Forced Convection Coefficient of the Outside Roof Surface
The convective heat transfer coefficient of the outside roof surface was approximated by assuming fully developed turbulent flow across the entire roof section. Relatively few studies have been completed on measured convection heat transfer for building exterior surfaces [36] although the various assessments are in reasonable agreement [37]. A simple correlation is taken from Burch and Luna [38]:
hr = 2.8 + 4.8 (V')
Where
hr = roof convective heat transfer coefficient (W/m2.K)
V' = wind speed parallel to the roof surface (m/s).
The reduced wind speed at the roof surface was determined using the correlation recommended by Sherman and Modera [39] to translate weather tower wind speeds to those on site:
V' = [α,w (Hw/10)γ,w] / [ α,s (Hs/10)γ,s]
Where:
α,w = alpha terrain parameter for weather tower (0.67)
Hw = height of wind tower (m) (10)
γ,w = gamma terrain parameter for weather tower (0.15)
α,s = alpha terrain parameter for site (1.0)
Hs = height of site (m) (3.0)
γ,s = gamma terrain parameter for site (0.25)
V = wind speed at measurement site (m/s)
The predicted roof surface temperature is estimated as an energy balance taking into account the roof surface absorptance and emittance properties, the solar flux, the sky temperature and the associated radiative, conductive and convective heat transfer coefficients.
Measured Attic Ventilation Rates
Although the adequacy of attic ventilation rates to reduce moisture accumulation have received considerable attention [40,41, 42], the actual determination of typical in situ rates in residential attics is less complete. Grot and Siu [43] took test data on three houses in Houston, Texas which had soffit vents. Measured ventilation rates using sulfur hexafluoride (SF6) tracer gas tests for the attics were 1.7 to 2.3 air changes per hour during the month of August, 1976.
Cleary
and Sonderegger [44] made several measurements using SF6 tracer
gas to measure attic air change rates at various wind speeds in
a house in Oroville, California. They found rates of 0.023 m3/s
per m/s wind speed in an attic with 3,000 cm2 of soffit vents. Given
the volume of the residential attic, this equates to an approximate
air change rate of 4.6 air changes per hour (ACH) at a 7 m/s windspeed.
Using similar SF6 equipment Ford [45] measured attic air change
rates of 3 - 4 ACH under moderate wind conditions in Princeton,
New Jersey. Dietz et al., measured a rate of 2.9 ACH in a long term
tracer gas test on an attic in an Illinois house [46]. In a number
of experiments using SF6 tracer gas in two attics in Ocala, Florida,
Ober measured average air change rates of 0.9 to 1.8 ACH in two
attics in test periods ranging from 2 to 27 days [47].
During the summer and fall of 1987 attic ventilation rates were
measured at the PCL in Cape Canaveral. The data was taken from attic
test cells under normal wind and thermal conditions. A calibrated
anemometer and a bulk air flow duct measured ventilation rates during
this period while on-site weather data was collected.
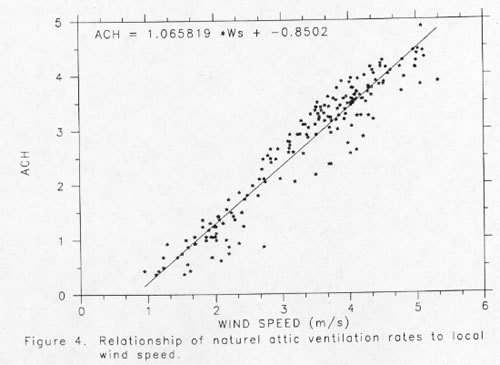
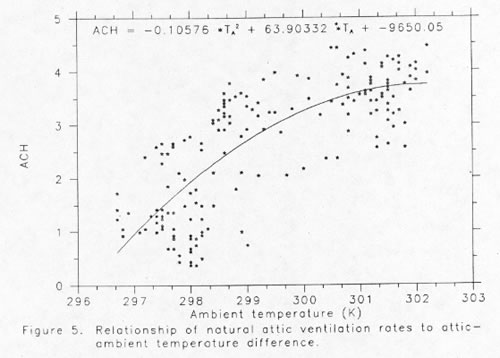
Measured average air change rates were approximately 2.70 ACH over the three day data collection period in a normal attic configuration. Figure 4 shows the pronounced relationship between the attic test cell ventilation rate and site measured wind speeds. Although some scatter is evident, a nearly linear relationship is observed. A similar plot of attic air change rate against inside to outside temperature difference (Figure 5) shows considerably greater scatter, but a definite trend of higher rates at higher temperature differences. As a statistical check, the residual errors from the regression between attic air change rate and wind speed were regressed against temperature difference itself. Although wind speed is the primary driver of attic ventilation, thermal buoyancy appears to be of significant secondary importance. This conclusion was statistically significant at better than a 99% confidence level.
Attic Ventilation Model
There are few existing attic ventilation models. Peavy used results from SF6 tests from three test attics in Houston, Texas to formulate an empirical model of attic ventilation [48]:
Va = 0.45 V (0.087 + 0.131 |sin D|5/2)
Where
Va = the volume air flow rate per ceiling area (cuft min/sqft)
V = wind speed (mph)
D = wind direction measured from south (degrees)
Blancett et al. [49] created a similar model based on the measurements of Hinrichs [50]:
I = 0.5 + 0.245 (V)
Where
I = attic air change rate
Both attic ventilation models ignore the effects of thermal buoyancy on ventilation. Each calculation also relate attic air infiltration rates to empirically fitted parameters that are unlikely to be generalizable to a variety of attic geometries and climatic locations.
Rather than develop another empirical model with only limited application, a more general calculation of attic ventilation was created based on readily available engineering data. Attic ventilation is defined as a function of two primary driving forces, wind and thermal buoyancy. The air flow rate then depends on inlet and outlet areas, local wind speeds and temperature differences and attic geometry. Attic ventilation due to buoyancy is estimated according to the relative air densities of the ambient air and the upper attic zone. Based on observations by Ober [51] and those of PCL data, we assume that the attic roof deck to ambient temperature difference drives the buoyancy phenomenon for the overall attic:
mbuo = Lo [gHs|Td-Tα|/T]0.5
Where:
mbuo = mass flow rate in lower attic caused by buoyancy (m3/s)
Lo = free inlet area (m2; soffit inlet area)
g = acceleration due to gravity (9.81 m/s2)
Hs = height to neutral pressure plane (m)
Tα = ambient temperature (K)
Td = deck surface temperature (K)
T = min {Tα,Td}
The vertical distance to the neutral pressure plane in the attic is determined according to the calculation suggested by ASHRAE [52].
Hs = H / 1 + (A1/A2)2 (To/Ti)
Where
H = the attic inlet to outlet height (m)
A1 = the lower soffit inlet opening area (m2)
A2 = the upper ridge vent outlet opening area (m2)
Ti = inlet air temperature (K)
To = outlet air temperature (K)
The buoyancy driven air flow is assumed to move from the soffit vents to the lower attic air zone and then to the upper attic air zone before exiting through the ridge vents. Calculation of wind driven ventilation requires knowledge of the attic inlet and outlet resistance to air flow. The soffit-ridge vent discharge coefficient is taken from experimental measurements made by Burch and Treado [53]:
mwind = Lo C V'
Where
Lo = free soffit inlet area (m2)
C = soffit discharge coefficient (0.38)
V' = reduced wind speed (m/s)
Attic Air Stratification
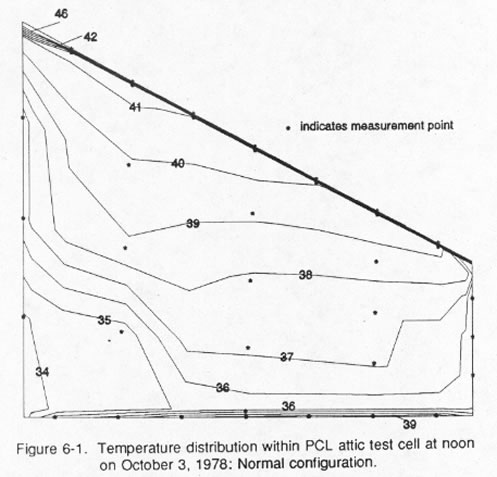
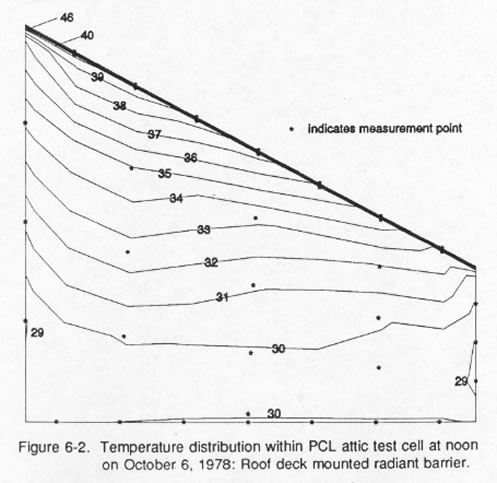
Monitored data shows that attic air temperatures on hot summer days may be quite stratified and use of mid-zone attic temperatures can lead to errors in calculation of ceiling heat flux [54]. The relative degree of stratification is greater when radiant barriers are in place [55, 56]. Figure 6 shows the air temperature distribution in an insulated attic test cell on September 27, 1987. The air temperature near the ridge vent is approximately 3.3 degrees °C warmer than the air temperature directly above the insulation surface. The lower panel shows data taken on the same day for the an adjacent test cell with an attic radiant barrier. The graph shows a stratification between the upper and lower attic temperatures of over 8 °C. Ober found similar levels of stratification in his investigation using attics above a duplex in Ocala, Florida [57].
The two attic air nodes are thermally linked by temperature related buoyancy within the attic. The buoyancy term calculated above computes a mass air flow rate from the lower to upper zone. The air flow to the lower attic zone from outside is assumed to equal the buoyancy driven ventilation between the upper and lower air nodes, with all of the additional air mass flow to the upper zone node. The overall attic ventilation is determined by adding the combined wind and stack terms in quadrature [58]:
minf,tot = R' (mbuo2 + mwind2)0.5
minf,tot
= total attic mass flow rate in upper
attic caused by buoyancy and wind (m3/s)
The estimated mass flow rate is modified made based on the difference in the inlet and outlet data. This relationship is based on regressed values from data given in the ASHRAE Handbook of Fundamentals [59]:
R' = 0.3733 + 1.0171 [1-exp(-φ)]
R'
= increase in flow caused by excess of
one opening over another (dimensionless)
φ =
outlet area to inlet area ratio (ratio ≥ 1) (2.0)
Based on our simplified description of the attic ventilation air flow path, the lower attic zone ventilation is assumed to be equal to the buoyancy mass flow rate:
minf,l = mbuo
Where
minf,l = ventilation mass flow rate to lower attic zone from outside (m3/s)
The remainder
to the ventilation air flows to the upper attic node:
minf,u = minf,tot - minf,l
Where
minf,u = ventilation mass flow rate to upper attic zone from the outside (m3/s)
Description of the Overall Attic Heat and Moisture Balances
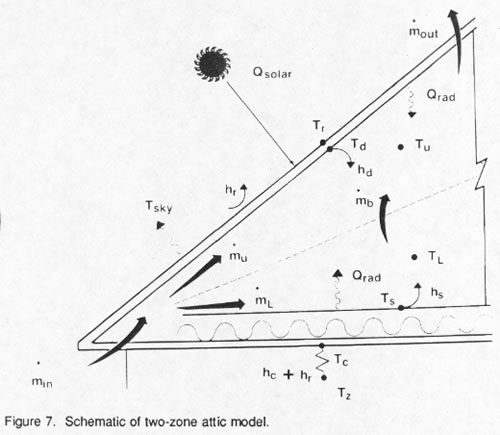
A graphical representation of our attic model is shown in the schematic in Figure 7. The attic is bisected to form two distinct air zones. Each attic surface is radiatively coupled with the other four attic surfaces. Convective heat transfer is estimated from each of the surfaces within the two zones. The upper and lower air zones are linked by buoyancy driven mass flows. A general description of the lower and upper attic energy balances can be summarized mathematically as:
Lower Attic Energy Balance
ρVCp{∂TL/∂τ = mbuoCp (Tα - TL) + Σ hiAi (T* -
TL)
Lower Attic Moisture Balance
ρV ∂WL/∂τ = mbuo(Wα - WL) + Σ hm,iAi (W* - WL)
Upper Attic Energy Balance
ρVCp ∂TU/∂τ = mbuoCp (TL - TU) + Σ hiAi (T* - TU) +
inf,uCp(Tα - TU)
Upper Attic Moisture Balance
ρV ∂WU/∂τ = mbuo(WL - WU) + Σ hm,iAi (W* - WU) + minf,u(Wα -
WU)
Where
Ai = area of i-th surface (m2)
Cp = specific heat (J/kg.K)
hi = convective heat transfer coefficient for i-th surface (W/m2.K)
hm,i = convective moisture transfer coefficient for i-th surface (kg/m2.s)
buo = mass flow rate in lower attic caused by buoyancy (kg/s)
TL = lower attic temperature (K)
Tr = zone temperature (K)
TU = upper attic temperature (K)
Tα = ambient temperature (K)
T* = inside surface temperature (K)
WL = lower attic humidity ratio (kg/kg)
WU = upper attic humidity ratio (kg/kg)
Wα = ambient humidity ratio (kg/kg)
W* = inside surface humidity ratio (kg/kg)
V = volume of each zone (m3)
ρ = air density (kg/m3)
τ = time (s)
Model Comparison with Measured Data
The accuracy of the described attic model was compared with monitored data collected from the PCL attic test cells. As shown in Figure 1, the test cells are highly instrumented 2 x 3 meter sections that approximate one half of a typical attic cross section. The 8.7 m3 test cells have a 28.5 degree roof slope with light gray asphalt shingles and continuous soffit and ridge vents. The free area of soffit vents was estimated for the test cell to be 15.2 cm2. A bulk air flow duct with a calibrated hot wire anemometer is located at the top of the test cells which is used to measure attic ventilation rates. Figure 8 shows a comparison of the measured attic test cell ventilation rates and those predicted by the ventilation model. The predictions are excellent with a standard error of only 0.07 ACH for the three day period.
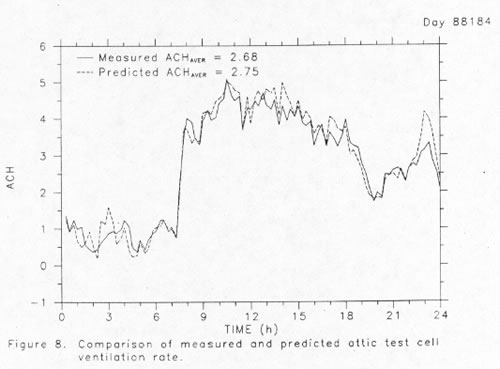
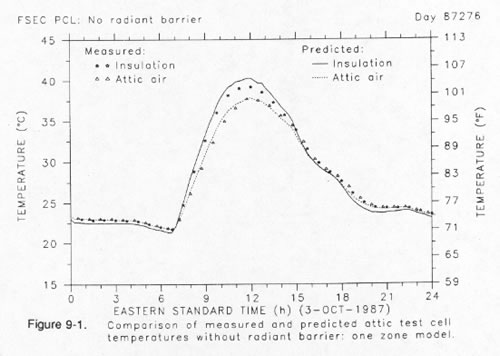
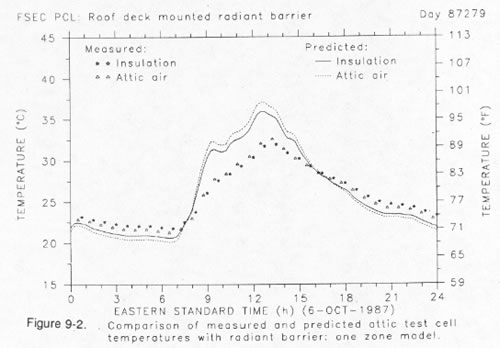
Figure 9 shows a simplified version of our model which uses only a single zone to represent the air node within the attic space and ignores thermal stratification of attic air. The insulation surface temperature is significantly over-predicted in the upper graph. Moreover, the overall thermal regime is poorly predicted for the radiant barrier case relative to the two-zone model as shown in the lower graph. Note that the relative position of the insulation surface and air temperature nodes are inversed. The single zone model under predicts the temperature of the insulation surface while the attic air temperature is over-predicted.
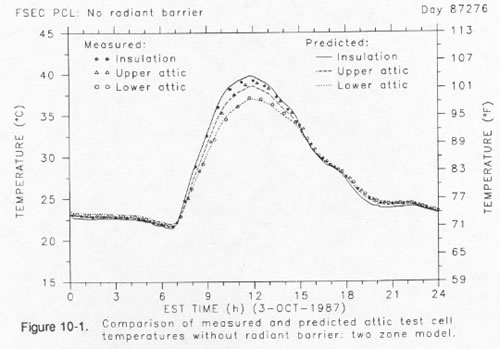
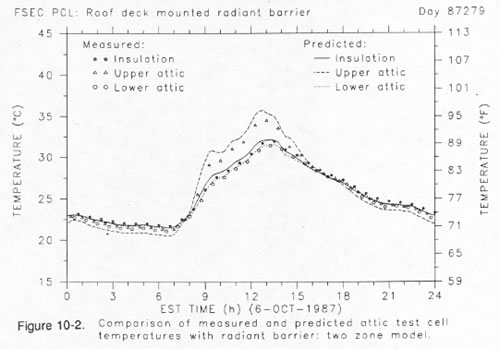
The two-zone model, however, exhibits none of these problems, and accurately predicts the various temperatures within the attic regime for both attic configurations. As shown in Figure 10, the upper graph depicts the predicted attic temperatures in the PCL test cell, both as monitored and predicted by the described model for the upper and lower air zones and the insulation surface. The lower graph shows the predictions for the temperatures when a roof deck mounted radiant barrier is in place on a different day. Thermal stratification of the attic air is clearly visible in both cases. The predictions of the model are quite good for both cases.
The two graphs in Figure 11 show the overall success of our two-zone model in predicting attic thermal performance.
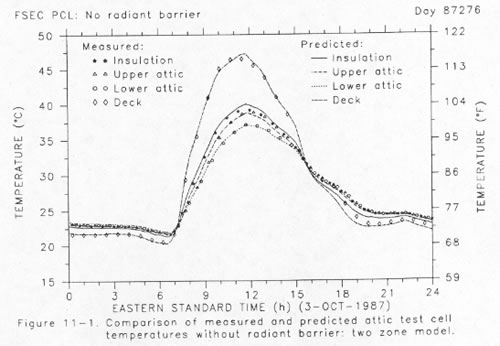
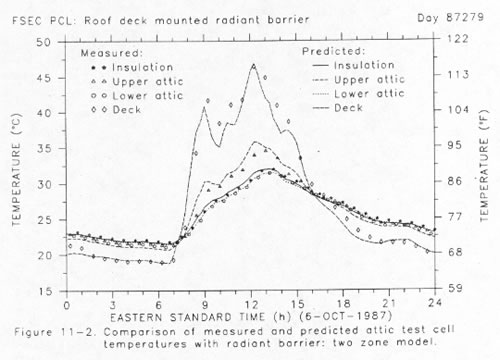
Identical calculations were performed with the roof deck temperature estimated depending on measured solar flux and sky temperature. Graph 1 shows the PCL attic test cell in its standard configuration; graph 2 shows the prediction whn a radiant barrier was installed. In both cases, the deck, internal attic air and surface temperatures all compare well to the measured data.
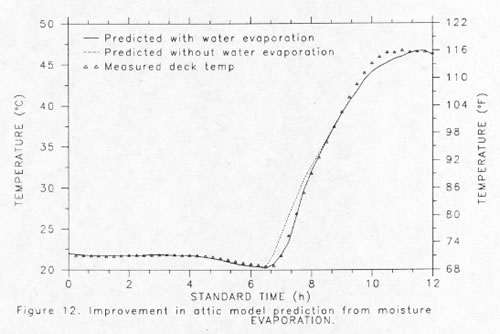
Roof Moisture Accumulation
In performing the comparisons of the model results with the PCL attic data, it was noted that the roof deck temperatures were often depressed between 5 A.M. and 8 A.M. relative to the model predictions. Subsequent early morning examination of the PCL attic roof shingles revealed moisture deposition on the roof surfaces due to dew formation at night. During mornings, the attic roof deck was being evaporatively cooled as the moisture was driven off by the solar flux. This phenomenon was incorporated into the attic model in a simplified fashion. A film of water is deposited upon the roof shingles when the shingle temperature reaches that of the ambient dew point. For this purpose, a calculation by Sissons [60] was adopted to estimate the rate of evaporation. This is a function of the vapor pressure of water and its temperature, the vapor pressure of water in the ambient air and its dewpoint and the velocity of air flow with respect to the surface:
Wp = 9.315 x 10⁻⁴ 0.2(95 + 83.66 V') (Pws-Pw) A/Lat
Where
Wt(p) = water condensation (evaporation) rate (kg/sec)
V' = roof level air velocity (m/s)
Pws = saturation vapor pressure of water at temperature (Pa)
Pw = vapor pressure of the moisture in the air at its temperature and relative humidity (Pa)
A = exposed surface area (m2)
Lat = latent heat of vaporization (J/kg)
Figure 12 shows the improvement in the simulation prediction for the early morning hours with the above evaporatioin equations incorporated in the attic model.
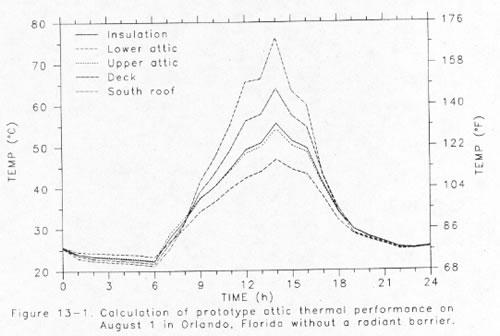
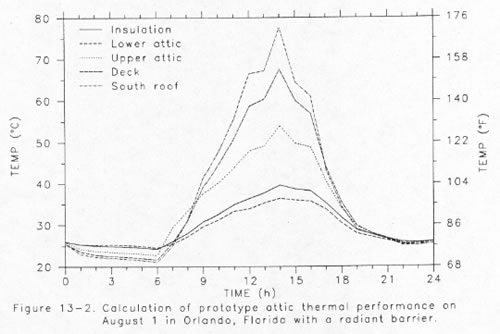
Example Analysis for a Typical Residential Attic
A prototype residential attic is used illustrate our attic simulation model. The attic is conventional with a simple rectangular shape (9.1 x 15.2 m) with asphalt shingles on a gabled roof with a 30 degree slope. The attic floor is covered with RSI 3.34 m2⋅K/W fibrous insulation. Orlando typical meteorological year (TMY) data is used to produce two simulations. Figure 12 shows the temperature distribution within the attic on August 1st for the prototype configuration. The lower graph in the figure shows the temperature distributions in the same attic with a roof mounted radiant barrier installed. The resulting reduction in insulation surface temperature from the radiant barrier and the increase in attic air stratification is clearly evident from comparison of the two plots.
Summary
A stratified air model of a residential attic has been described. The two zone model allows improved estimation of attic ventilation, ceiling heat flux and influence of radiant barrier systems on overall building performance. The ventilation and air node temperature prediction of the model has been compared to monitored attic data. Agreement between the model and the monitored data was very good.
Analysis revealed that characterization of moisture condensation on attic roof assemblies as well as treatment of moisture dynamics within the attic itself is useful to improving the prediction of attic thermal performance. Comparison with measured data also indicated that convective heat transfer coefficients for interior attic surfaces may be significantly higher than commonly supposed in the literature. Air flows within attic structures appear to be quite complex. Future research on attic air flow distributions and interaction with attic surface heat transfer rates is recommended.
Acknowledgements
The U.S. Department of Energy and the Florida Power and Light Company are acknowledged for their support of the research used to validate this model. The Gas Research Institute provided funding for development of the FSEC 2.1 program. Yayi Rickling and Junaid Alim performed the literature search and Premasis Brahma assisted with modeling of attic air flows. Mabel Flumm helped to complete the final manuscript.
References
[1] Beyea, J., Dutt, G. and Wotecki, T., "Critical Significance of Attics and Basements in the Energy Balance of Twin Rivers Townhouses," Energy and Buildings, Vol. 1, No. 3, April, 1978.
[2] Parker, D.S., "Monitoring Attic Duct System Heat Gain in a Test Building," Florida Solar Energy Center, FSEC Proposal, PR-196-90, Cape Canaveral, FL, 1990.
[3] ASHRAE, Handbook of Fundamentals, American Society of Heating, Refrigeration and Air Conditioning Engineers, Atlanta, 1989.
[4] Joy, F.A., "Improving Attic Space Insulation Values," ASHRAE Transactions, Vo. 64, 1958, p. 251-266.
[5] Sandoval, S.B., Experimental Analysis of the Dynamic Thermal Response of an Attic Space, Masters of Science Thesis, Oklahoma State University, 1974.
[6] Hinrichs, H.S., "Comparative Study of the Effectiveness of Ventilating Louvers," ASHRAE Transactions, Vol. 68, 1962, p. 297 - 309.
[7] Joy, F.A., op. cit., p. 251-266.
[8] Ober, D.G., "Attic Insulation Performance: Full Scale Tests of Conventional Insulation and Radiant Barriers," Mineral Insulation Manufacturer's Association, Final Report, Denver, CO, July, 1990.
[9] Fairey, P., Swami, M. and Beal, D. "Radiant Barrier Systems Technology: Task 3 Report," Florida Solar Energy Center, FSEC-CR-211-88, Cape Canaveral, FL, 1988.
[10] Wilkes, K.E., "Modeling of Residential Attics," Proceedings of the ASHRAE/DOE-ORNL Conference on the Thermal Performance of the Exterior Envelopes of Buildings, ASHRAE SP 28, 1979, Kissimmee, FL, p. 436-455.
[11] Blancett, R.S., McBride, M.F., Sepsy, C.F. and Jones, C.D., "A Model for Predicting Residential Attic Space Air Temperatures," ASHRAE Transactions, Vol.85, Pt. 1, 1979, p. 656-663..
[12] University of Wisconsin, "TRNSYS, A Transient Simulation Program," University of Wisconsin Experiment Station, Report 38-9, Madison, WI, 1978.
[13] Kusuda, T., Pierce, E.T. and Bean, J.W., "Comparison of Calculated Hourly Cooling Load and Attic Temperature with Measured Data for a Houston Test House," ASHRAE Transactions, Vol. 87, pt.1, 1981, p. 1185-1198.
[14] Abrantes, V., "Thermal Exchanges Through Ventilated Attics," Proceedings of the ASHRAE/DOE/BTECC Conference Thermal Peformance of Exterior Envelopes of Buildings III, December 2, 1985, Lakeland, FL, p. 296 - 308.
[15] Peavy, B.A., "A Model for Predicting the Thermal Performance of Ventilated Attics,"in Summer Attic and Whole House Ventilation, NBS Special Publication 548, Washington D.C, 1979.
[16] Wilkes, K.E. and Rucker, J.L., "Thermal Performance of Residential Attic Insulation," Energy and Buildings, 1983, p. 263-277.
[17] Fairey, P. and Swami, M., "Analysis of Radiant Barrier Systems Using Mathematical Models," Proceedings of the Fifth Annual Symposium on Improving Building Energy Efficiency in Hot Humid Climates, Florida Solar Energy Center, FSEC-PF-147-88, Cape Canaveral, Florida, 1988.
[18] Cleary, P. and Sonderegger, R., "A Method to Predict the Hour by Hour Humidity Ratio of Attic Air," Lawrence Berkeley Laboratory, LBL-17591, Berkeley, CA, 1984.
[19] Ford, J. K., Heat Flow and Moisture Dynamics in a Residential Attic, Master's of Science Thesis, Center for Energy and Environmental Studies, CEES Report - 148, Princeton University, Princeton, N.J, 1982.
[20] Kerestecioglu, A., Swami, Gu, L., "Combined Heat and Moisture Transfer in Buildings and Structures," American Society of Mechanical Engineers, ASME Winter Meeting, San Francisco, CA, December 10th - 15th, 1989.
[21] Kerestecioglu, A., Swami, Dabir, R., Razzaq, N. and Malek, S, "Theoretical and Computational Investigation of Algorithms for Simultaneous Heat and Moisture Transport in Buildings," Florida Solar Energy Center, FSEC-CR-191-88, Cape Canaveral, FL, 1988, p. H-5 - H-7.
[22] ASHRAE, op. cit., p. 37.3 - 37.4
[23] Cess, R. and Sparrow, E., Radiation Heat Transfer, McGraw Hill Book Company, New York, 1968.
[24] ASHRAE, op. cit, p. 3.12
[25] McAdams, W.H., Heat Transfer, 4th Edition, McGraw Hill Book Co., Inc., New York, 1954.
[26] Metais, B. and Eckert, E.R.G., "Forced, Mixed and Free Convection Regimes," Journal of Heat Transfer, May, 1964, 1964. p. 295 - 296.
[27] Peavy, op. cit.
[28] Ford, op. cit., p. 54-56
[29] Ober, op. cit., 51-53
[30] ElSherbiney, S.M., Hollands, K.G.T. and Raithby, G.D., "Free Convection Across Inclined Air Layers with One Surface V-Corrugated," Journal of Heat Transfer, No. 100, 1980, p. 410 - 415.
[31] Anderson, R. and Bohn, M. "Heat Transfer Enhancement in Natural Convection Enclosure Flow," Journal of Heat Transfer, No. 108, p. 330 - 337.
[32] McAdams, op. cit, p. 249
[33] ASHRAE, op. cit, p. 22.2
[34] Holman, J., Heat Transfer, McGraw-Hill, New York, 1976., p. 197 - 199.
[35] McAdams, op. cit, p. 180 - 182
[36] Ito, N., Kimura, K. and Oka, J., "A Field Experiment Study on the Convective Heat Transfer Coefficient on the Exterior Surface of a Building," ASHRAE Transactions, Vol. 68, 1972, p. 184.
[37] Ford, op. cit., p. 76 - 82.
[38] Burch, D. and Luna, D., "A Mathematical Model for Predicting Attic Ventilation Rates Required for Preventing Condensation on Roof Sheathing," ASHRAE Transactions, Vol. 86, 1980, p. 201.
[39] Sherman, M.H. and Modera, M.P., "Comparison of Measured and Predicted Infiltration Using the LBL Infiltration Model," Measured Air Leakage of Buildings, ASTM STP 904, H.R. Treschel and P.L. Lagus, Eds., American Society for Testing and Materials, Philadelphia, p. 325-347.
[40] Harrje, D.T., Gibson, R.G., Jacobson, D.I., Dutt, G.S. and Hans, G., "Field Measurements of Seasonal Wood Moisture Variations in Residential Attics," Report No. 173, Center for Energy and Environmental Studies, Princeton, N.J., 1984.
[41] Spies, H., "Attic Ventilation: How much you need and why," Progressive Builder, August, 1987, 1987, p. 21-23.
[42] Cleary, P., "Humidity in Attics - Sources and Control Methods," Lawrence Berkeley Laboratory, LBL-17590, Berkeley, CA, 1984.
[43] Grot, R. A. and Shiu, C.I., "Effectiveness of Powered Attic Ventilation on Ceiling Heat Transfer and Cooling Load in Two Townhouses," in Summer Attic and Whole House Ventilation, NBS Special Publication 548, Washington D.C, 1979.
[44] Cleary and Sonderegger, op. cit., p. 3
[45] Ford, op. cit, p. 56
[46] Dietz, R.N., Goodrich, R.W., Cote, E.A. and Wieser, R.F., "Detailed Description and Performance of a Passive Perfluorocarbon Tracer System for Building Ventilation and Air Exchange Measurements," Measured Air Leakage in Buildings, ASTM STP 904, American Society for Testing and Materials, Philadelphia, PA, 1986.
[47] Ober, op. cit., p. 55
[48] Peavy, p. 126
[49] Blancett et al., op. cit., p. 658
[50] Hinrichs, op. cit
[51] Ober, op. cit., p. 51 - 54
[52] ASHRAE, op. cit., p. 22.3
[53] Burch, D.M. and Treado, S.J., "Ventilating Residences and Their Attics for Energy Conservation-- An Experimental Study," in Summer Attic and Whole House Ventilation, NBS Special Publication 548, Washington D.C, 1979.
[54] Dutt, G. S., "Forced Ventilation for Cooling Attics in Summer," in Summer Attic and Whole House Ventilation, NBS Special Publication 548, Washington D.C., 1979.
[55] Joy, op. cit., p. 262.
[56] Fairey et al., 1988, op. cit., p. 3-17 - 3-21
[57] Ober, op. cit., p. 48 - 49
[58] ASHRAE, op. cit, p. 23.6
[59] ASHRAE, op. cit, p. 23.8
[60] Sisson, W., "Nomograph Solves for Water Evaporation," Heating, Piping and Air Conditioning, vol. 57, No. 8, August, 1985, p. 133-134
© 2007-2014 University of Central Florida. The Florida Solar Energy Center (FSEC)
is a research institute of the
University of Central Florida.
For more information about FSEC, please contact us or learn more about us.
Find us on Facebook!