

Reference Publication: Presented at: American Council for an Energy Efficient Economy, August 1990, Asilomar Conference Center, Pacific Grove, CA Disclaimer: The views and opinions expressed in this article are solely those of the authors and are not intended to represent the views and opinions of the Florida Solar Energy Center. |
Electrical
Use, Efficiency, and Peak Demand of Electric Resistance,
Heat Pump, Desuperheater,
and Solar Hot Water Systems
Tim
Merrigan, Danny Parker
Florida
Solar Energy Center (FSEC)
FSEC-PF-215-90
ABSTRACT
Eighty single family residences in Florida were monitored for two years in order to collect data on water heating electrical energy consumption, efficiency, and time-of-day demand. The homes were divided into equally sized samples of four different water heating systems: conventional electric resistance, heat pump, desuperheater and solar hot water systems.
Electrical consumption for electric resistance water heaters averaged 8.3 kWh per day in Florida with an average water heating system efficiency of 82%. Desuperheaters used an annual average of 7.4 kWh per day at an annual system efficiency of 110% and heat pump water heaters used 6.1 kWh per day at an average system efficiency of 153%. Electrical use of solar hot water systems averaged 2.7 kWh per day and the average system efficiency was 235%.
Electrical demand taken at 15-minute intervals showed electric resistance water heaters contribute approximately 1.1 kW of diversified demand to the utility winter peak and at least 0.2 kW to the summer peak. Solar hot water systems exhibited the most desirable demand profile relative to Florida utility coincident peak loads with a 0.7 kW per customer reduction in the winter and a minimum 0.2 kW per customer reduction in the summer. Desuperheaters have the same 0.2 kW minimum peak demand reduction in the summer and 0.2 kW per customer reduction in the winter. Heat pump water heaters exhibited approximately half the peak demands of electric water heaters in the winter but were unable to reduce summer peak demand by any significant amount.
Installation of solar hot water collector.Since electric water heaters account for approximately 25 percent of the utility winter peak demand per customer, encouraging the use of alternative water heating methods is beneficial to a winter-peaking utility in Florida.
INTRODUCTION
Since 1982, Florida's electric utilities have sold more electricity each year in the state than they have produced (Florida Public Service Commission 1985, 1989). Fortunately, this situation is the planned result of purchasing more economical power from electric utilities in the neighboring states of Georgia and Alabama. Since the purchased power is more economical, the transmission lines that carry this power from the neighboring states are generally at full capacity. Unfortunately, when a high demand for electricity occurs, Florida's utilities are severely limited in their ability to increase capacity beyond their own generation. Such a circumstance recently occurred on December 24, 1989 when a strong winter cold front quickly passed through the southeastern United States. The cold weather created a peak demand for electricity that Florida's utilities were unable to meet, in part because the transmission of purchased power was already at full capacity. The result was numerous large-scale service interruptions due to rotated curtailments and an understandable breakdown of overloaded equipment. The state's largest utility, Florida Power and Light Company (FPL), experienced a demand of close to 16,000 megawatts (MW), a level that was not expected until 1998! FPL had forecast a 1989 - 90 winter peak demand of approximately 13,500 MW -- based in part on the previous winter and summer peak demands of 12,876 MW and 13,425 MW, respectively (FPL 1989).
Clearly, the ability to supply the winter peak demand without service interruptions is of major concern to Florida utilities. However, these utilities have historically used summer peak demand as the basis for determining a minimum capacity reserve margin. Winter peak demand is generally only considered in a loss-of-load probability analysis for determining the need for new generating capacity (FPL 1989). The 1989 Christmas Eve power short-fall, however, emphasizes that any method to reduce peak demand -- winter or summer -- should be important to a utility's planning process, especially in a high growth state like Florida.
One area for utility peak load management lies in the residential sector. Since 1970, residential electricity consumption has been approximately 50 percent of the total annual electricity use in the state of Florida. In 1988, residential customers consumed over 63 million megawatt-hours with an annual growth rate of over five percent for each of the preceding four years (FPSC 1989). This growth rate exceeded the population growth rate by at least two percent for each of these years.
Water heating accounts for approximately 21 percent of the residential electricity consumption in Florida (FPL 1978). Over 99 percent of this energy is due to the use of electric resistance water heaters. Alternative water heating technologies -- solar hot water systems, heat pump water heaters, and desuperheater units that recover the waste heat of the refrigerant in a residence's air conditioning equipment -- account for less than one percent of the domestic hot water (DHW) systems in the state (Florida Governor's Energy Office 1981). Of course, these water heating alternatives still require electricity to operate or to supply backup water heating when neither solar nor waste heat is available.
To evaluate the impact of alternative water heating technologies on the electric utility, it is necessary to measure the time-of-day electricity consumption of each system type in a number of occupied residences. However, the electrical consumption of any DHW method can vary considerably depending on the temperature of the hot water delivered and the actual water use of the residences's household. Unless a fairly large number of houses are measured to eliminate the variance in these quantities, it is also necessary to measure the hot water energy delivered by the DHW system. This latter quantity can account for the variations in water temperature as well as volume and, therefore, can serve as a common ground for comparison.
METHODOLOGYA Florida solar energy research and testing institute (FSEC) has had an active program in solar domestic hot water system field monitoring since 1978 (McCluney 1980; Block 1983). In order to compare the measured performance of solar systems with the performance of other types of domestic hot water systems, the field monitoring program was expanded in 1982. Under the sponsorship of the Florida public utility regulatory commission, FSEC collected time-of-day performance data for two years (July 1982 - June 1984) on four types of DHW systems:
1. Electric resistance water heaters (that met ASHRAE Standard 90A-1980)
2. Heat pump water heaters
3. Solar hot water systems (with collectors that met ASHRAE Standard 93-1977)
4. Desuperheater water heaters.Twenty systems of each DHW type were instrumented to determine both their 15-minute electrical demand and hot water energy use. The systems were located in single-family residences in four major population areas of Florida: Jacksonville in north Florida, Orlando/Brevard County in east central Florida, the Tampa Bay region in west central Florida, and Broward/Palm Beach counties in south Florida. The systems were selected both to achieve a geographic balance of five systems of each type in each population region and to reflect relatively similar family sizes (Merrigan 1983).
To measure the hot water energy delivered by the system, a heat (Btu) meter was installed on each system. The heat meter utilized a flow meter located in the cold water supply line to the hot water storage tank, as well as both a cold and hot water temperature sensor to calculate the thermal energy change of the heated water before it is delivered to the household. Laboratory tests on the flow meter indicated flow accuracies within 2.5% of the true mass flow over long time periods. Similar tests on the heat calculation indicated an accuracy of within 5% of the true energy flow (Merrigan 1981), with resolutions of 1000 Btu (1055 kJ) and 1 gal (3.8 L).
A kilowatt-hour (kWh) meter was used to record the resistance element energy as well as any auxiliary energy used by the pumps, controls, and/or compressor of an alternative DHW system. Standard single-phase 30 amp meters were used with pulse initiators that had a resolution of 1 watt hour (Wh). A solid-state demand recorder accumulated contact closure pulses from the kWh, Btu, and flow meters and stored them in 15-minute totals in its internal memory. These totals were routinely acquired by telephone interrogation of the demand recorders, transferred to a microcomputer, and stored on magnetic media for eventual data reduction.
RESULTSTable 1 lists the sample size, the average family size, the daily average hot water use, the daily average electric use, and a dimensionless coefficient of performance (COP) for the four DHW types for the two-year period July 1, 1982 to June 30, 1984. (Two electric and four heat pump water heaters were omitted from these averages because of instrumentation malfunctions or hot water system equipment problems.) COP is defined as the hot water energy use divided by the electrical energy consumption and is, therefore, a measure of the total DHW system efficiency.
Table 1. Florida Group Sizes, Annual Daily Average Hot Water Use, Electric Use, and Coefficient of Performance
Sample Size
No. of SystemsFamily Size
PeopleHot Water Use
Gal (L)/DayElectric Use
(kWh/Day)Coefficient of
PerformanceElectric
Resistance18 3.6 55.7
(211.1)8.3 0.82 Heat Pump
Water Heater16 3.9 74.0
(280.5)6.1 1.53 Solar Hot
Water Heater20 3.1 53.8
(203.9)2.7 2.35 Desuperheater
Unit20 3.6 58.6
(222.1)7.4 1.10 Figure 1 displays the average daily electrical load profiles (based on 15-minute intervals) for the four DHW groups for period of July1, 1982 to June 30, 1983. The hours displayed are clock times, rather than the year-round standard time that is sometimes used in annual data acquisition projects subject to the hour offset of a summer daylight savings period. This approach was taken since household hot water use generally corresponds to actual clock time, as seen by the apparent awakening of the Florida groups around 6:00 a.m.
Table 2 presents the daily average 15-minute electrical demand, the average 15-minute maximum demand and the daily load factor for the four DHW types for the two-year period. Load factor is the ratio, expressed as a percent, of the average kilowatt demand over a designated period of time to the maximum demand occurring in that period.
Load Factor (%) = Average Demand (kW)/Peak Demand (kW)
Load factor is a measure of how well the electrical capacity demanded from the utility is utilized by the load over a period of time.
Table 2. Average Demand, Peak Demand and Load Factor by type of System
Average Demand (kW) Peak Demand (kW) Load Factor (%) Electric Resistance 0.34 0.68 50 Heat Pump Water Heater 0.25 0.48 52 Solar Hot Water System 0.11 0.27 41 Desuperheater Unit 0.31 0.57 54 The winter peak and summer peak days chosen for data reduction are the actual peak load days of Florida Power and Light Company, in whose service territory half of the 80 systems were located. The other half of the systems were located in the service areas of Florida Power Corporation, Tampa Electric Company, and Jacksonville Electric Authority. These utilities either had the same winter and summer peak load days as FPL or their secondary system peaks occurred on these days.
Tables 3 and 4 indicate the FPL winter and summer peak days, respectively, and the hour that the peak occurred. These same tables also contain each DHW system type's maximum 15-minute diversified demand that was coincident with the hour of the FPL system peak. The diversified 60-minute coincident demand is presented in Tables 5 and 6 for the same peak days. This hourly coincident demand is calculated by averaging the four 15-minute demands that occurred during the peak hour. It is important to note in both Table 3 and Table 5 that FPL was unable to meet the peak demand on December 26, 1983 and had to rotate curtailments throughout their service area. Hence, the FPL system peak of the winter of 1982-83 (January 13, 1983) has been included in these tables.
Table 3. Average 15-Minute Demand Coincident with FPL Winter Peak Load (60-Minute Net)
January 13, 1983
9 a.m.December 26, 1983
9-10 a.m.*February 7, 1984
7-8 a.m.Electric
Resistance1.14 kW 1.26 kW 1.36 kW Heat Pump Water
Heater0.53 kW 0.56 kW 0.75 kW Solar Hot Water
System0.46 kW 0.88 kW 0.73 kW Desuperheater Unit 0.94 kW 0.62 kW 1.11 kW * Unserved utility load of 666 MW
Table 4. Average 15-Minute Demand Coincident with FPL Summer Peak Load (60-Minute Net)
August 24, 1982
5-6 p.m.July 25, 1983
5-6 P.M.Electric Resistance 0.74 kW 0.34 kW Heat Pump Water Heater 0.61 kW 0.37 kW Solar Hot Water System 0.32 kW 0.02 kW Desuperheater Unit 0.14 kW 0.19 kW Table 5. Average 60-Minute Demand Coincident with FPL Winter Peak Load (60-Minute Net)
January 13, 1933
8-9 a.m.December 26, 1983
9-10 a.m.*February 7, 1984
7-8 a.m.Electric Resistance 1.07 kW 0.90 kW 1.18 kW Heat Pump Water
Heater0.48 kW 0.36 kW 0.68 kW Solar Hot Water
System0.24 kW 0.59 kW 0.44 kW Desuperheater Unit 0.63 kW 0.30 kW 0.64 kW * Unserved utility load of 666 MW
Table 6. Average 60-Minute Demand Coincident with FPL Summer Peak Load (60-Minute Net)
August 24, 1982
5-6 p.m.July 25, 1983
5-6 p.m.Electric Resistance 0.82 kW 0.23 kW Heat Pump Water Heater 0.51 kW 0.17 kW Solar Hot Water System 0.23 kW 0.01 kW Desuperheater Unit 0.04 kW 0.67 kW Figures 2 through 5 present the average 15-minute demand profiles for the four DHW system types on the FPL winter peak day of February 7, 1984. Figures 6 through 9 presents the same time-of-day profiles for the summer peak day of July 25, 1983. These two days were selected for presentation because they represent the highest utility system loads of all the FPL peak days that did not have service interruptions.
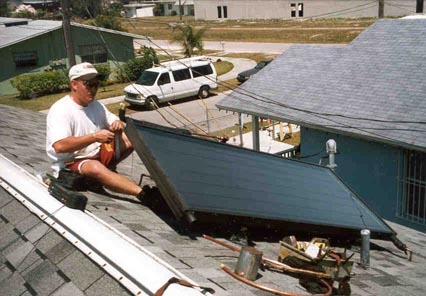
 Figure 2. Average winter peak day electrical load profile for electric resistance water heaters. |
 Figure 3. Average winter peak day electrical load profile for heat pump water heaters |
 Figure 4. Average winter peak day electrical load profile for solar water heaters. |
 Figure 5. Average winter peak day electrical load profile for desuperheater units. |
ANALYSIS
Annual Electrical Use and Demand
The average electricity use of 8.3 kWh per day for the electric resistance water heater group -- with an average family size of 3.6 people -- compares favorably with values obtained by other studies performed in Florida. FPL determined in a 1976-77 study of 165 customers that a family of four used an average of 10.2 kWh per day (FPL 1978). Florida Power Corporation determined in a similar study that a family of three used an average of 8.4 kWh per day and a family of four used 11.6. kWh per day (FPC 1974). Both studies were performed before improved insulation was required on electrical water heaters in order to meet the minimum heat loss rate requirements of ASHRAE Standard 90A-1980.
The shape of the average daily electrical demand profile for electric resistance water heaters as seen in Figure 1 is also consistent with the results of previous studies. The twin peaks of mid-morning and early evening demand correspond to typical residential hot water use patterns of showering, food preparation, and cleanup (Perlman and Mills 1985; Gladhart and Wiehl 1986). As hot water is withdrawn from the storage tank, the electric element turns on when the water temperature drops below the tank thermostat setting. The annual daily average demand of the element is exactly one-half of its average peak demand, resulting in an annual average load factor of 50 percent.
Heat pump water heaters had a similar load factor and annual average electrical demand profile as electric resistance water heaters, although their average demand is approximately 25 percent less. This reduction is due to the higher annual average system efficiency of the heat pump water heater -- approximately twice that of the electric resistance water heaters. However, seven of the 20 heat pump water heaters in this study experienced compressor failures, indicating a problem with long-term reliability in 1982-84.
Solar hot water systems operated with the highest average electrical system efficiency and had the lowest average daily electrical demand profile. However, the solar system's annual load factor of 41 percent compares favorably with the electric resistance water heater's load factor of 50 percent. This is surprising since the majority of solar system owners turned off their storage tank's backup electric element and relied on the solar system to supply whatever hot water they needed during the summer months. The only electrical consumption for these systems was that of the solar circulation pump as can be seen in the summer day average of Figure 9 for the six-hour period around noon. Combined with the occasional winter use of the backup element, this electrical demand was consistent enough during the summer months to create a relatively high annual load factor.
Desuperheater unit owners also typically turned off their backup electric element during the summer. However, these units would only supply hot water when there was a need for air conditioning or, for those eleven desuperheaters that were installed on heat pumps, a need for heating and/or air conditioning. Surprisingly, even in Florida, there are considerable periods of time when neither mode of space conditioning is required. This is reflected in the average two-year coefficient of performance of 1.10 for desuperheaters. Although this COP is better than unity, it is not much higher than the efficiency for an electric resistance water heater. The annual load factor of 54 percent and the average daily electrical demand as seen in Figure 1 also suggest that desuperheater units perform very similar to electric resistance water heaters on an annual basis.
Peak Day Demand
Although both the 15-minute and the 60-minute coincident peak demands for each of the DHW system types (found in Tables 3 through 6) appear to vary considerably from one peak day to another within the same season, it is important to note that these demands are highly dependent on the weather for each day. This is especially true in the case of the winter peak, as evidenced by the fact that FPL system peak occurred at a different hour on each of the three peak days. The peak day electrical demand profiles for each of the DHW system types (found in Figures 2 through 9) also are highly variable due to the weather as well as the hot water use on that day.
Understandably, the consumption of hot water and, therefore the demand for electricity, was greater in the winter than in the summer. For instance, the average hot water consumption associated with electric resistance water heaters on the winter peak day in 1984 (66.3 gallons or 251 L) was 27% greater than the use on the peak day (52.3 gallons or 198 L) during the previous summer. Furthermore, the average electrical consumption used to heat each gallon of hot water shows large differences between winter and summer peak days. On the winter peak day, February 7, 1984, electrical resistance systems used an average of 175 Wh to heat each gallon of water, whereas only 119 Wh were used to heat each gallon on July 25, 1983, the summer peak day. Thus, electrical consumption was 47% greater to heat a given volume of water on the winter peak day. Most of the difference in electrical consumption is due to the seasonal variation in inlet water temperature to the hot water tank. Data recorded over the last two years at FSEC show that inlet water temperatures in Central Florida vary by more than 14oF throughout the year (Parker 1989). Also, since most hot water heaters are located in garages in Florida, lower ambient temperatures on winter peak days increase tank standby losses and add to the daily hot water heating electrical consumption.
To evaluate the peak demand reduction potential of the alternative water heating technologies, it is necessary to first test whether the winter and summer peak day electrical profile of each technology was statistically different from the same peak day electrical profile of the electric resistance water heaters. Since the distributional shapes of the electrical demand are non-normal, a Wilcoxon rank-sum test was performed to compare the profiles. Results showed that the peak day profiles of the alternative technologies were statistically different from conventional resistance systems at the 99.99 percent confidence level.
To calculate actual peak demand reduction, it is necessary to determine the difference in coincident peak demand between each technology and a base technology -- the conventional electric resistance water heaters. Table 7 presents this calculation for both the 15-minute and 60-minute coincident winter peak demands found in Tables 3 and 5. (The winter peak day of December 26, 1983 is omitted from Table 7 because of the service curtailments that occurred on this day.) Table 7 also includes the average value of the coincident peak demand reductions of the two fully-served FPL winter peak days of 1983 and 1984.
As evident from Table 7, the coincident peak demand reduction on the two winter peak days is much more consistent than the individual winter peak demands of Tables 3 and 5. While the coincident peak demand reduction based on 60- minute intervals varies slightly from the 15-minute value, this is simply the result of averaging over a longer time period. Table 7 indicates that solar hot water systems exhibit the largest winter demand reduction of approximately 0.7 kW per customer. Heat pump water heaters contribute approximately 0.6 kW per customer reduction to winter peak demand, while desuperheaters are responsible for at least a 0.2 kW per customer reduction.
Table 8 presents a similar analysis as Table 7 except that the diversified summer coincident peak demands from Tables 4 and 6 are used to determine the demand reduction for each alternative DHW system type. Table 8 indicates that both solar hot water systems and desuperheaters are able to reduce summer peak demand considerably. However, since Table 6 reveals that the 60-minute coincident peak demand for electric resistance water heaters may be as low as 0.25 kW per customer, one cannot claim more than a 0.2 kW summer peak reduction potential for these technologies.
Table 8 also indicates no significant summer peak reduction potential for heat pump water heaters. However, it is important to note that this analysis considers the peak demand reduction due to water heating only and does not consider any increase or reduction that may occur if the space conditioning load is affected by the water heater operation. While most heat pump water heaters were located outside of the conditioned space of a house, there were some that were located inside such that their operation would increase the heating load in the winter and decrease the cooling load in the summer. This analysis does not consider any effect that this contribution may have had on overall residential peak demand.
Table 7. Diversified 15-Minute and 60-Minute Winter Peak Demand Reduction (kW per Customer)
January 13, 1983
8-9 a.m.February 7, 1984
7-8 a.m.Winter Peak
AverageElectric Resistance 15-minute Base
60-minute Base15-minute Base
60-minute Base15-minute Base
60-minute BaseHeat Pump Water
Heater0.61
0.590.61
0.500.61
0.55Solar Hot Water
System0.68
0.830.63
0.740.66
0.79Desuperheater Unit 0.20
0.440.25
0.540.23
0.49
Table 8. Diversified 15-Minute and 60-Minute Summer Peak Demand Reduction (kW per Customer)
August 24, 1982
5-6 p.m.July 25, 1983
5-6 p.m.Summer Peak
AverageElectric Resistance 15-minute Base
60-minute Base15-minute Base
60-minute Base15-minute Base
60-minute BaseHeat Pump Water
Heater0.13
0.07-0.03
0.060.05
0.07Solar Hot Water
System0 .66
0.520.32
0.220.49
0.37Desuperheater Unit 0.60
0.540.15
0.160.38
0.35CONCLUSIONS
Residential water heating offers a significant potential for Florida electric utility load management because of the increasing level of residential electricity consumption and the ability of alternative water heating technologies to reduce coincident peak demand. The common electric resistance water heater contributes approximately 1.1 kW per customer to the utility winter peak and at least 0.2 kW per customer to the summer peak. In 1988, the total peak demand per customer at the time of both FPL's winter and summer peaks was 4.2 kW (FPL 1989). Hence, electric water heaters are responsible for approximately 25 percent of the utility winter peak demand and only about 5 percent of the utility summer peak demand. However, recent circumstances in Florida indicate that the winter peak-may become more important than the summer peak in determining the need for new generating capacity. Fortunately, alternative water heating technologies offer a means to reduce winter and summer peak demand without requiring controlled utility intervention or even significantly reducing load factor.
Solar hot water systems exhibit the highest coincident peak demand reduction of 0.7 kW per customer in the winter and a minimum of 0.2 kW per customer in the summer. Solar systems perform with an average coefficient of performance of 2.35 and have an annual load factor of 41 percent. In comparison, an electric resistance water heater has an average COP of 0.82 and a load factor of 50 percent.
Desuperheater units can also provide the potential of reducing coincident summer peak demand by a minimum 0.2 kW per customer. However, in the winter, only those units that are installed on heat pumps are capable of reducing electrical demand. This winter peak demand reduction is determined to be at least 0.2 kW per customer. Desuperheaters also have an average COP of 1.10 and an annual load factor of 54 percent.
Heat pump water heaters have a system efficiency roughly twice that of an electric resistance water heater and operate at a load factor of 52 percent. The winter peak coincident demand is approximately half that of an electric water heater so its winter demand reduction potential is 0.6 kW per customer. Unfortunately, in the summer, the coincident peak demand reduction of heat pump water heaters is negligible. Heat pump water heaters also demonstrated reliability problems when the study was performed in 1982 to 1984. If these problems have been resolved, heat pump waters also offer significant potential for reducing electric utility winter peak demand.
ACKNOWLEDGMENTSThe sponsorship of the Florida Public Service Commission, the support of the Florida Solar Energy Center management, and the cooperation of Florida's electric utilities are gratefully acknowledged. The FSEC project staff -- Charles Beach, Omar Hancock, Ross McCluney and Tom Tiedemann -- also deserve both credit and thanks for their considerable work on the project. The dedicated assistance of consultants Don Patzsch and Timothy Stryker, as well as numerous FSEC graduate assistants, is also acknowledged. Finally, the participating homeowners deserve special gratitude for their cooperation. Without their assistance, the project would not have been possible.
REFERENCES
ASHRAE. 1977. ANSI/ASHRAE Standard 93-1977, "Methods of testing to determine the thermal performance of solar collectors." American Society of Heating, Refrigeration, and Air-Conditioning Engineers, Inc., Atlanta, Georgia.
ASHRAE. 1980. ANSI/ASHRAE Standard 90A- 1980, "Energy conservation in new building design." American Society of Heating, Refrigeration, and Air-Conditioning Engineers, Inc., Atlanta, Georgia.
Block, D. L. 1983. "Solar domestic hot water system four-year performance results. "Proceedings of the 1983 Annual Meeting, American Solar Energy Society, Vol. 6, pp. 235-240, Minneapolis, MN.
Florida Governor's Energy Office. 1981. "Florida Energy Data: 1960-1981," Tallahassee, Florida.
FPC. 1974. Florida Power Corporation, "Water Heater Test Data," Technical Information No. 37, St. Petersburg, Florida.
FPL. 1978. Florida Power and Light Company, "1978 Residential Electric Water Heater Study," Miami, Florida.
FPL 1989. Florida Power and Light Company, "Petition to Determine Need for Electrical Power Plant: 1993-1996," Miami, Florida.
Florida Public Service Commission. 1985. Research Department, "Statistics of the Florida Electric Utility Industry 1984," Tallahassee, Florida.
Florida Public Service Commission. 1989. Research Department, "Statistics of the Florida Electric Utility Industry 1988," Tallahassee, Florida.
Gladhart, P. M., and Wiehl, J. S. 1986. "Monitored hot water use: A seasonal analysis." Proceedings - 1986 Summer Study on Energy Efficiency in Building, American Council for an Energy-Efficient Economy, pp. l.90-1.103.
Merrigan, T. 1983. "Residential conservation demonstration: Domestic hot water, Final report." FSEC-CR-90-83, Florida Solar Energy Center, Cape Canaveral, Florida.
Merrigan, T., and Wang, M. 1981. "BTU meter dynamic test, Final report." FSEC-CR-81-29(RD), Florida Solar Energy Center, Cape Canaveral, Florida.
McCluney, R. 1980. "Annual performance of 20 solar water heaters in central Florida." FSEC-RM- 80-4, Florida Solar Energy Center, Cape Canaveral, Florida.
Parker, D.S. 1989. "Hot Water Study: Phase I Final report," FSEC-CR-295-89, Florida Solar Energy Center, Cape Canaveral, Florida.
Perlman, M., and Mills, B. "Development of residential hot water use patterns." ASHRAE Transactions, Vol. 91, Part 2, pp. 657-679, Atlanta, Georgia.
© 2007-2014 University of Central Florida. The Florida Solar Energy Center (FSEC)
is a research institute of the
University of Central Florida.
For more information about FSEC, please contact us or learn more about us.
Find us on Facebook!