

Reference Publication: Parker, D., "Monitored Residential Space Cooling Electricity Consumption in a Hot-Humid Climage: Magnitude, Variation and Reduction From Retrofits", Proceedings of the ACEEE 1990 Summer Study on Energy Efficiency in Buildings, 1990. Disclaimer: The views and opinions expressed in this article are solely those of the authors and are not intended to represent the views and opinions of the Florida Solar Energy Center. |
Monitored Residential Space Cooling Electricity Consumption in a Hot-Humid Climage: Magnitude, Variation and Reduction From Retrofits
Danny
S. Parker
Florida
Solar Energy Center (FSEC)
FSEC-PF-213-90
There are few end-use studies that report monitored space cooling
energy consumption for residential buildings in hot-humid climates. This
paper reports data from 25 occupied single-family houses in Palm Beach
County, Florida (Messenger et.al. 1982). The houses were first
monitored for one year in 1981 to establish their space cooling consumption. After
the first year of monitoring they received a battery of retrofits
predicted to reduce household energy use. Incorporated measures
included conversion to high-efficiency air conditioners or heat pumps,
added ceiling insulation, window films, awnings, zoned conditioning
systems and ceiling fans. The houses were then monitored for
an additional year to determine the relative savings achieved by the
installed energy conservation measures.
This paper focuses on the analysis of data taken in the study with
particular emphasis on the variation of space cooling energy use and
how the retrofit treatments affected energy consumption in the monitored
buildings. Although data on energy consumption was recorded
on a monthly basis, all of the comparisons made in this paper are
based on total seasonal energy consumption.
DESCRIPTION OF THE HOUSES
The 25 houses studied were located in Palm Beach County, Florida and represent a mix of the existing housing types that are similar to much of the other housing in Central and South Florida. All houses had slab on grade foundations and the majority had concrete block construction. Eighteen of the houses, mostly concrete block structures, had no wall insulation and three of the older structures had no ceiling insulation whatsoever.
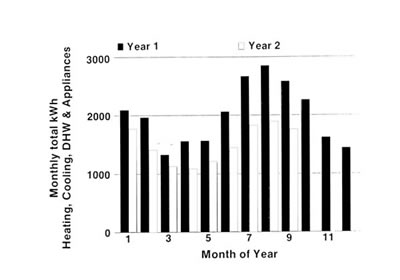
Total annual electricity consumption ranged from 9,398 to 44,918 kWh with an average of 24,661 kWh. The seasonal variation in total monthly electricity consumption over the two years both before and after their retrofits is depicted in Figure 1. Of the annual total, an average of 2,750 kWh was used for space heating, 3,732 kWh used for domestic hot water heating and 4,769 kWh used for other appliances. Typical of Florida houses, thirteen of the houses had pools which used a surprising amount of electricity for pumping and circulation, the average being 2,967 kWh per year.
Figure 1. Seasonal Variation in
Total Monthly
Electricity Consumption Before and After Retrofit
SPACE COOLING CONSUMPTION PRIOR TO RETROFIT
Average annual air conditioning electricity consumption in the houses before retrofit was 8,163 kWh. As expected, floor area was a very significant predictor of space cooling electricity consumption. Figure 2 depicts the variation of air conditioning energy use with floor area. However, space cooling energy use was found to be extremely variable even when normalized by floor area. Cooling electricity use averaged 4.14 kWh/ft², but varied 100:1 ranging from 0.085 – 8.5 kWh ft². The overall data is summarized in Table 1: Survey data suggested that the occupants used very different cooling strategies. A fraction of the households ventilated for most of their cooling needs (Houses 15, 19 and 25), while the other extreme (such as Houses 7 and 24) conditioned the building interior year round.
Figure 2. Variation of Space Cooling
Electricity
Consumption with House Floor Area
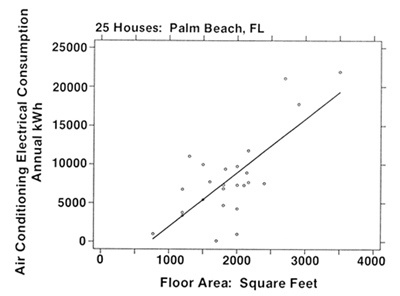
Table 1. Annual Space Cooling Consumption
in 25
Houses in Palm Beach, Florida Prior to Retrofit
House Code |
Area (sq ft) |
Age (Yrs) |
Household Occupants |
Annual KWh |
KWh/ Sq ft |
1 |
2164 |
12 |
5 |
11778 |
5.44 |
2 |
2700 |
10 |
4 |
21103 |
7.82 |
3 |
1800 |
30 |
3 |
4703 |
2.61 |
4 |
1800 |
8 |
12 |
7346 |
4.08 |
5 |
1200 |
20 |
3 |
6781 |
5.65 |
6 |
2400 |
4 |
4 |
7558 |
3.15 |
7 |
2900 |
8 |
6 |
17796 |
6.14 |
8 |
1200 |
8 |
1 |
3379 |
2.82 |
9 |
2143 |
8 |
4 |
8924 |
4.16 |
10 |
2000 |
3 |
3 |
4278 |
2.14 |
11 |
3500 |
20 |
3 |
21934 |
6.27 |
12 |
1500 |
20 |
4 |
9989 |
6.66 |
13 |
1827 |
14 |
6 |
9394 |
5.14 |
14 |
1300 |
8 |
2 |
11504 |
8.50 |
15 |
2000 |
20 |
4 |
1009 |
0.50 |
16 |
2000 |
8 |
5 |
9750 |
4.87 |
17 |
1200 |
20 |
5 |
3785 |
3.15 |
18 |
1800 |
20 |
6 |
6873 |
3.82 |
19 |
1700 |
8 |
5 |
144 |
0.08 |
20 |
1600 |
20 |
3 |
7739 |
4.84 |
21 |
2167 |
20 |
3 |
7671 |
3.54 |
22 |
2100 |
30 |
2 |
7290 |
3.47 |
23 |
1500 |
8 |
4 |
5438 |
3.62 |
24 |
2000 |
60 |
3 |
7325 |
3.66 |
25 |
768 |
20 |
2 |
1033 |
1.34 |
Avg |
1890.8 |
16.3 |
4.1 |
8163 |
4.14 |
Std Devn |
588.9 |
11.8 |
2.1 |
5510 |
2.06 |
Max |
3500.0 |
60.0 |
12.0 |
21934 |
8.50 |
Min |
768.0 |
3.0 |
1.0 |
144 |
0.08 |
AUDITS
Each of the houses were visited by staff assigned to the project and various audit data taken. These audit data included house floor area, age, number of occupants, insulation levels and other characteristics that might influence household energy use such as ventilation strategies. Unfortunately, thermostat settings were not made available for study.
The results of the audit were used together with a computer program developed specifically for the project to recommend the retrofit measures to be installed in each house. The energy consumption of the major house end-uses were sub-metered by conventional kilowatt-hour meters and collected on a monthly basis by site visit. The relative simplicity and accuracy of this approach yielded reliable estimates of space cooling energy use. The end-uses monitored included space cooling, heating, hot water heating, refrigerator use, appliances and pool electricity consumption.
Particular attention was paid to measurements of the air conditioning and air distribution system during the audits. These measures allowed characterization of the field measured air conditioning energy efficiency ration (EER) compared to the rated values. Air flow rates were measured using a Shortridge Flowhood and before and after-coil wet and dry bulb temperatures were measured with an Omega digital thermometer with a resolution of 0.01 °F.
INSTALLATION OF RETROFITS
Each of the 25 houses in the study had a group of energy conservation retrofit measures installed at the end of the first year of monitoring. The measures were selected based on the output of a computer program designed to produce a simplified analysis of the predicted savings of each available measure in the program against their expected costs.
An average of $5,927 was spent on each house on more energy efficient air conditioners and refrigerators, solar water heaters, heat recovery units, insulation, ceiling fans and other equipment and envelope related improvements. Overall annual savings ranged between 24 and 33 percent for total electricity use.
This paper, however, will focus only on the relative savings produced by improvements designed to reduce space cooling needs. Such improvements included 20 high-efficiency air conditioning systems, 20 ceiling insulation upgrades to R-19 or more, 26 ceiling fans, high reflectivity window films, duct system sealing and zoned air distribution systems. Duct systems were typically leaky, especially on the older homes. A total of ten new duct systems were installed, seven of the older systems were repaired and six of the existing air distribution systems were judged to be adequate without repairs. The other two project houses had window mounted heat pumps installed.
AIR CONDITIONING SYSTEMS
Each air conditioning system that was retrofitted had various audit measures taken on the air conditioning units and the air distribution system. Generally, installed retrofit air conditioners were similar in size to the original equipment, but were chosen based on the units with the best Seasonal Energy Efficiency Ratios (SEER) ratings available from local bidders. Before and after coil temperature, enthalpy and mass flow measurements were taken on each of the 20 systems installed (two houses were zoned with two systems). A grid of wet and dry bulb temperatures were taken before and after the coil to make the estimates according to the procedure outlined by ASHRAE (ASHRAE 1989). Typical enthalpy change before and after the coil was on the order of 6.0 Btu/lb°F. Of these systems only 14, or 70%, performed within 20% of the rated SEER. In general, little correlation was found between the capacity (Btu/hour) and SEER as rated, and the capacity and Energy Efficiency Ratio (EER) measured in the field. This finding corroborates results from other field tests of air conditioning systems conducted in North Carolina (Neal 1987).
Of the systems that did not perform as expected, three were two-speed systems and one (House 10) was believed to have restriction in the refrigerant line which was not repaired by the contractor. House 3 had an undersized return air duct system. Equipment exhibiting very different capacities than expected were found to be either over charged with refrigerant (six systems) or under charged (two systems). A comparison of the retrofitted air conditioning equipment is contained in Table 2.
Table 2. Comparison of Audit Data on Retrofit Air Conditioning Equipment
Residence No. |
Rated Capacity (Btu/hr) |
SEER (Btu/W) |
CFM (cu ft/min) |
Measured Capacity (Btu/hr) |
EER (Btu/W) |
CFM (cu ft/min) |
1 |
37000 |
10.5 |
1400 |
23958 |
6.75 |
1420 |
2 |
37000 |
10.5 |
1400 |
32833 |
8.05 |
1265 |
2 |
24200 |
11.1 |
1000 |
28500 |
11.40 |
785 |
3 |
34200 |
11.3 |
1000 |
23477 |
7.87 |
930 |
5 |
37000 |
11.7 |
1200 |
29479 |
10.40 |
1420 |
6 |
41500 |
11.1 |
1600 |
46000 |
11.24 |
1200 |
7 |
48000 |
9.2 |
1600 |
63000 |
10.90 |
1455 |
8 |
24000 |
11.1 |
1000 |
29576 |
11.50 |
960 |
9 |
29200 |
9.1 |
1000 |
30000 |
9.70 |
1075 |
10 |
37000 |
10.5 |
1400 |
20033 |
5.60 |
1410 |
11 |
14000 |
10.5 |
2400 |
55665 |
10.45 |
2265 |
12 |
24400 |
7.8 |
800 |
24500 |
9.20 |
905 |
13 |
37800 |
8.6 |
1200 |
39427 |
9.26 |
1175 |
14 |
24000 |
8.3 |
1150 |
23100 |
8.10 |
965 |
15 |
30000 |
8.6 |
1050 |
31600 |
9.10 |
915 |
16 |
24000 |
12.7 |
1150 |
16000 |
7.50 |
840 |
17 |
19000 |
10.4 |
750 |
33400 |
14.80 |
1000 |
17 |
24200 |
11.1 |
1000 |
25000 |
10.40 |
895 |
22 |
35400 |
10.6 |
1150 |
36230 |
9.80 |
1360 |
23 |
24000 |
9.2 |
1000 |
22600 |
9.30 |
620 |
Avg. |
31995 |
10.2 |
1213 |
31719 |
9.57 |
1143 |
Std Dev |
8487 |
1.3 |
363 |
11763 |
2.01 |
359 |
SPACE COOLING CONSUMPTION AFTER RETROFIT
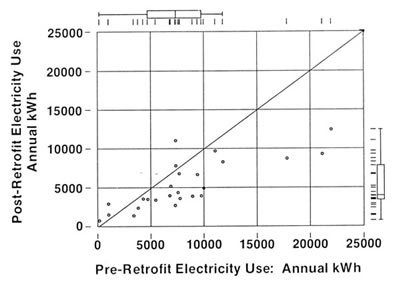
As expected, average annual air conditioning electricity consumption in the houses dropped from 8,163 to 5,320 kWh after the retrofit measures were installed. This represented an annual average savings of 35% even though the cooling degree days (CDD) in Palm Beach in 1982 (4,438) were 15% greater than the CDD in 1981 (3,864). However, savings from the retrofits were not normalized based on this index since comparison of monthly summertime space cooling for individual houses showed very poor correlation between cooling degree days and air conditioning electrical demand. Presumably, this occurs because much of space cooling demand depends on other factors such as relative humidity, solar radiation, wind and occupant behavior.
Figure 3 compares cooling electricity consumption before and after retrofit. As indicated by the box-plots, implementation of the retrofit measures reduced absolute cooling energy consumption as well as the relative variation of space cooling use. In four of the retrofitted houses, cooling energy consumption actually increased. However, three households showing increases did not have more efficient air conditioning systems installed, the most successful of the implemented retrofits. Two of the houses showing increases in cooling consumption relied primarily on natural ventilation.
Figure 3. Comparison of Space Cooling
Electricity
Consumption Before and After Retrofit
Houses using the greatest amount of space cooling electricity also attained the highest savings. The relationship between before retrofit and relative savings is depicted in Figure 4. Some measures were more successful than others; ceiling insulation retrofits, replacement or zoning of duct systems and replacement of low efficiency air conditioning units showed the best relative performance. Analysis of variance estimates indicated that retrofit of air conditioning systems saved an average of 3,603 kWh, replacement of duct systems saved an average of 2,894 kWh and ceiling insulation saved an average of 1,934 kWh. All estimates were statistically significant at a 90% confidence level. Indicated savings for retrofit of ceiling fans was 890 kWh although the estimate was only significant at an 87% confidence level. Data analysis showed no statistically significant savings for the window tinting or the addition of awnings. This finding, does not indicate that these measures do not save cooling energy, but only that the small sample size and the large variation in air conditioning energy use does not allow statistically conclusive estimates of their actual effects on cooling energy use.
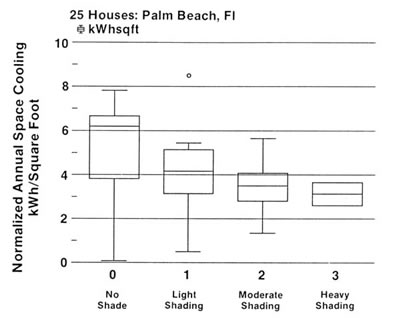
Figure 4. Comparison of Space Cooling
Electricity
Consumption by Degree of Landscape Shading
ANALYSIS OF VARIATION IN SPACE COOLING ENERGY
We undertook a statistical analysis of space cooling consumption to explain some of its large variation. A multiple regression of annual space cooling energy use against the various parameters in the data base revealed the following relationship between pre-retrofit energy use and space cooling energy consumption:
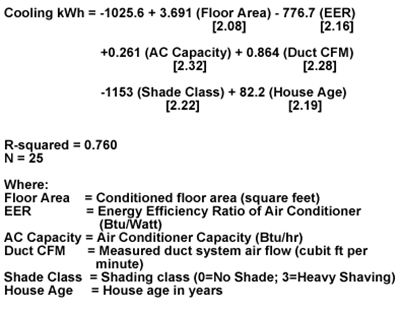
The relationship explains approximately 76% of the variation in space cooling in the data. The t-statistics for the various coefficients are given in brackets under each. All the parameters have the expected signs and were significant at a 90% level or better. The importance of the duct system air flow rates in the model reflects more recent findings which show attic distribution system duct leakage to have a major impact on cooling energy use (Cummings and Tooley 1989). According to the regression, a large, old house with low EER, high-capacity air conditioner with a high duct air flow rate and no exterior landscaping would use the most annual space cooling electricity.
LANDSCAPE SHADING
As part of our inquiry, we subjectively classified the relative house shading from a photograph taken of the houses from the northern exposure. The shading classes were 0 (no shading; full sun); 1 (some shading; small trees or shrubs); 2 (moderate shading; large trees or shrubs on one or two exposures) and 3 (heaving shading; large trees or shrubs on at least three exposures). The shading classes were based on examination of the photographs with particular attention to the east, west and southern exposures. A number of studies, both analytic and empirical have indicated that landscaping has a large potential for providing reductions to space cooling in hot environments (Parker 1983; Huang et al. 1987; McPherson et al. 1989).
A box-plot of average air conditioning energy consumption for the houses grouped by shading class is shown in Figure 4. Houses with moderate or heaving landscaping used 34% less space cooling energy (1.73 kWh/ft²) than houses in full sun. Unfortunately, the small sample size (14 houses) and the large variations in space cooling made statistical comparisons difficult. However, a Wilcoxon signed-ranks test revealed that the means of the two distributions were significantly different at a 99.99% level.
Table 3. Annual Space Cooling Consumption
in
25 Houses in Palm Beach, Florida After Retrofit
| House Code |
Area (sq ft) |
Annual kWh |
kWh\ sq ft |
Savings kWh |
Retrofits 1 Installed |
1 |
2164 |
8308 |
3.84 |
3470 |
ac,ins,fan |
2 |
2700 |
9308 |
3.45 |
11795 |
ac,ins,fan,dcts |
3 |
1800 |
3520 |
1.96 |
1183 |
ac,ins,fan,dcts |
4 |
1800 |
7817 |
4.34 |
-471 |
ins,fan |
5 |
1200 |
3964 |
3.30 |
2817 |
ac,ins,awng |
6 |
2400 |
4375 |
1.82 |
3183 |
ac,zone |
7 |
2900 |
8747 |
3.02 |
9049 |
ac,ins,zone |
8 |
1200 |
1397 |
1.16 |
1982 |
ac,tnt,dcts |
9 |
2143 |
3881 |
1.81 |
5043 |
ac,ins,zone |
10 |
2000 |
3552 |
1.78 |
726 |
ac |
11 |
3500 |
12450 |
3.56 |
9484 |
ac,ins,zone |
12 |
1500 |
4942 |
3.29 |
5047 |
ins,zone,fan |
13 |
1827 |
6685 |
3.66 |
2709 |
ac,fan |
14 |
1300 |
9700 |
7.46 |
1354 |
ac,ins,tnt |
15 |
2000 |
2920 |
1.46 |
-1911 |
ins,fan,dcts |
16 |
2000 |
3950 |
1.97 |
5800 |
ac,ins |
17 |
1200 |
2401 |
2.00 |
1384 |
ins,tnt,zone |
18 |
1800 |
5183 |
2.88 |
1690 |
ac,ins,zone,fan |
19 |
1700 |
762 |
0.45 |
-618 |
tnt,awng,fan |
20 |
1600 |
3617 |
2.26 |
4122 |
ac,ins |
21 |
2167 |
6803 |
3.14 |
868 |
ac,ins,awng,dcts |
22 |
2100 |
2738 |
1.30 |
4552 |
ac,ins,zone |
23 |
1500 |
3403 |
2.27 |
2035 |
ins,tnt,dcts |
24 |
2000 |
11050 |
5.53 |
-3725 |
ins,fan |
25 |
768 |
1529 |
1.99 |
-496 |
ac,ins |
Avg |
1890.8 |
5320.1 |
2.79 |
2842.9 |
. |
Std Devn |
588.9 |
3168.8 |
1.49 |
3561.0 |
|
Max |
3500.0 |
12540.0 |
0.45 |
11795.0 |
|
Min |
768.0 |
762.0 |
7.46 |
-3725.0 |
|
| 1 ac = retrofit
with air conditioner or heat pump ins = add ceiling insulation tnt = tint windows zone = retrofit zoned duct system awng = add window awnings fan = add ceiling fans dcts = replace duct system |
|||||
SUMMARY
Analysis of monitored energy consumption data from 25 homes in Palm Beach County, Florida reveals that space cooling energy consumption is highly variable. Before the retrofits, annual air conditioning electricity use averaged approximately 8,200 kWh, but ranged from 144 kWh to 21,934 kWh annually. When normalized by floor area, average space cooling energy use was approximately 4.1 kWh per square foot. However, even normalized space cooling energy use was found to vary by approximately 100 to 1.
Statistically analysis revealed that house floor area, air conditioner efficiency, capacity and house age were responsible for a large fraction of the variation. Air conditioner performance was found to vary considerably from rated values both in terms of capacity (Btu/hr) and EER. Discrepancies in refrigerant charge, sizing of refrigerant lines and return air ducts were found to be at least partially responsible for the differences.
The analysis also revealed that exterior landscape shading has large effects on annual space cooling energy use. Houses which were heavily shaded used 34% less space cooling electricity (1.8 kWh/square foot) than houses with no shade. We also determined that air distribution system characteristics may also have significant effects on cooling energy use. A multiple regression model which includes the above variables can explain approximately 76% of the variation in space cooling energy use. Audit data suggests that occupant ventilation strategies may have much to do with a large part of the remaining variation. Savings from retrofits designed to save space cooling energy use were substantial, averaging 35% on an annual basis. These savings represent an average reduction in electricity consumption of 2,834 kWh – a savings of over $200 per year at current electricity prices. Of the implemented retrofit measures, replacement of old air conditioners with high SEER models, duct replacement and repair and additions to ceiling insulation showed the greatest level of savings. Addition of exterior landscape shading may offer further potential savings.
ACKNOWLEDGEMENT
Special thanks to Dr. Roger Messenger of Florida Atlantic University for sharing the data collected in this study.
REFERENCES
ASHRAE, 1989. Handbook of Fundamentals, American Society of Heating, Refrigeration and Air Conditioning Engineers, Atlanta, GA.
Cummings, J.B., and Tooley, J.J., 1988. “Infiltration and Pressure Differences Induced by Forced Air Systems in Florida Residences,” ASHRAE Transactions Vol. 95, Pt. 2, ASHRAE, Atlanta, GA.
Huang, Y.J., Akbari, H., Taha, H. and Rosenfeld, A.H., 1987. “The Potential of Vegetation in Reducing Summer Cooling Loads in Residential Buildings,” Journal of Climate and Applied Meteorology, Vol. 26., September, 1987.
McPherson, E.G., Simpson, J.R. and Livingston, M., 1989. “Effects of Three Landscape Treatments on Residential Energy and Water Use in Tucson Arizona,” Energy and Buildings, Vol. 13, Elsevier Sequoia, Netherlands.
Messenger, R., Hays, S., Duyar, A., Trivoli, G., Vincent, J., Guttmann, M., Robinsion, J., Litschauer, B., Jarvis, J. and Pages, E., 1982. Maximally Cost Effective Residential Retrofit Demonstration Program, Florida Atlantic University, Boca Rotan, FL.
Neal, L., 1987. “Real Life Air Conditioning,” Refrigeration Service and Contracting, October, 1987, Troy, MI.
Parker, J.H., 1983. “The Effectiveness of Vegetation on Residential Cooling,” Passive Solar Journal, Vol. 2. No. 2, American Solar Energy Society, Boulder, CO.
© 2007-2014 University of Central Florida. The Florida Solar Energy Center (FSEC)
is a research institute of the
University of Central Florida.
For more information about FSEC, please contact us or learn more about us.
Find us on Facebook!