

Reference Publication: Parker, D., "Analysis of Radiant Barrier Car Shade Performance: Preliminary Experiments and Proof of Concept", August 1988. Disclaimer: The views and opinions expressed in this article are solely those of the authors and are not intended to represent the views and opinions of the Florida Solar Energy Center. |
Analysis
of Radiant Barrier Car Shade Performance:
Preliminary Experiments and Proof of Concept
Danny
S. Parker
Florida
Solar Energy Center (FSEC)
FSEC-PF-160-89
Executive
Summary
The Florida Solar Energy Center (FSEC) has monitored several automobiles
over the lasttwo months in order to investigate how hot interior temperatures
in parked cars might be reduced through the use of improved technology,
car shades. We observed interior temperatures in un—shaded stationary
automobiles in Cape Canaveral, Florida to commonly reach 150 °F
and dashboard temperatures to rise to nearly 200 °F. We found
the addition of a conventional cardboard car shade behind the automobile
windshield on sunny days to reduce the interior air temperatures by
an average of 15 °F. Dashboard temperatures were reduced by 40 °F.
We found radiant barrier system (RBS) car shades to offer further
improvements over conventional cardboard shades. RBS car shades are
similar to conventional ones, but have a low emissivity foil backing
laminated to the interior facing surface of the shade. When using
an RBS car shade, automobile interior air temperatures are reduced
an average of 3 - 5 °F over conventional shades; the steering
wheel and dashboard temperatures are reduced by a further 6 - 11 °F.
The advantages of the RBS car shade are relatively unaffected by
venting by.car windows. Such venting results in less difference in
air temperature between a standard and RBS car shade (1.4 °F).
However, the reductions in the dashboard temperatures and steering
wheel temperatures are relatively unchanged by venting; an RBS car
shade still results in an 8 °F reduction in the car dash temperature.
We tested a number of different car shade configurations. Contrary
to popular belief, we found that a. two sided foil faced car shade
actually performs no better than an RBS car shade with foil only on
the interior face.
The improvements from an RBS car shade results in the following
advantages:
-
Increased passenger comfort.
-
Less thermal stress on car interior components.
-
Lower initial automobile air conditioner loads.
There is considerable need for further experimentation in this area to perform a comprehensive analysis of static automobile thermal performance. FSEC intends to actively pursue further sources of funding for this research.
Introduction
Use
of cardboard car shades to reduce the interior temperatures inside
parked automobiles have become popular in Florida and other hot regions
in the United States. Sealed automobiles commonly encounter interior
temperature conditions that are exceedingly uncomfortable to their
passengers (Rohies and Wallis, 1979)
In experiments at the Florida Solar Energy Center (FSEC) we monitored
interior air temperatures on clear days inside unshaded automobiles
of 150 °F. We observed dashboard and steering wheel temperatures
of nearly 200 °F.. Strategies to reduce these temperatures
are important because they promise to reduce passenger discomfort,
increase the longevity of interior automobile components, and reduce
initial automobile air conditioning loads (Atkinson, 1986). Simulation
analysis of automobile thermal performance have shown solar radiation
through windows to dominate the heat build-up during parked conditions
(Sullivan et. al., 1988).
Such high temperatures exacerbate initial automobile air conditioning loads increasing the capacity requirements for car air conditioning equipment. Treatment of this problem is important in light of recent concerns with depletion of the earth’s ozone layer which is adversely affected by release of chlorofluorocarbons (CFC). Automobile air conditioning systems have been widely implicated in the release of CFCs to the atmosphere.
We decided to see if the effectiveness of conventional cardboard car shades could be increased through the use of a low—emissivity surface facing the interior of the car. Radiant barrier systems (RBS) successfully reduce the heat transfer in houses from hot roof decking to ceilings (Fairey et. al., 1988). We expected that the same physical principal should work equally well for car shades. Although others at FSEC had expressed interest in such an idea, we began some initial experiments to determine how well the concept might work in the field.
Initial
Experiments
We obtained two conventional cardboard car shades and used graphics
adhesive to laminate aluminum foil to the interior surface of one of
the cardboard car shades. This became the prototype RBS car shade for
use in the experiments. We left the other shade as it was-- plain white
with some lettering.
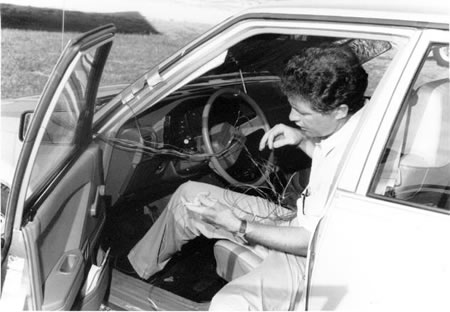
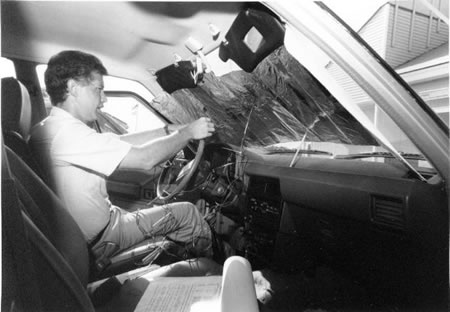
On June
1st, we conducted an experiment at FSEC using my 1973 142 Volvo sedan.
At 8:40 A.M. EDST we oriented the car south. Two shielded thermometers
were installed inside to monitor interior temperatures. One probe
was taped to the car dashboard in the shadow of the car shade; the
other recorded the air temperature at passenger breathing level around
the steering wheel. We then placed the. foil faced radiant barrier
car shade in the front window. From 9:00 A.M. to 5:00 P.M. we took
manual measurements of the thermocouples every half hour using a Solomat
MP 500 thermometer... The car was left sealed and only opened briefly
every hour to switch the car shade from the conventional type to the
radiant barrier one and vice versa.
We decided on a one hour time interval for the series of A—B switch
tests. This seemed the minimum duration for the interior to reach a
steady equilibrium temperature. A longer interval would lead to errors
because, of changing solar angles and outside air temperatures. A shorter
interval would also lead to troubles since we altered the air temperature
each time we switched the shades. We decided to depend on statistical
analysis techniques to sort out the effect of the RBS car shade from
unrelated influences.
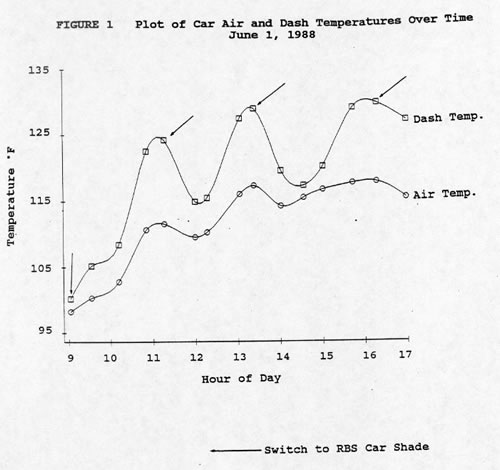
We made a total of 15 observations, eight with the RBS shade and
seven with the conventional shade. The resulting profile of the car
air and dashboard temperatures is depicted in Figure 1. The times when
the RBS shade was installed are clearly distinguishable in the temperature
data, particularly for the car dashboard. Table 1 summarizes the recorded
experiment:
Table
1 RADIANT BARRIER CAR SHADE EXPERIMENT June 1, 1988 |
|||||
Temperature
( °F ) |
|||||
| Shade | Temp. |
Mean |
Std
Devn |
Min |
Max |
| Std
Shade Air RBS Shade Air Avg Difference |
115.2° 108.4° 6.8° |
3.0° 7.2° |
110.6° 98.2° |
117.9° 116.7° |
|
| Std
Shade Dash RBS Shade Dash Avg Difference |
127.0° 112.7° 14.3° |
2.7° 7.2° |
122.5° 100.2° |
129.8° 120.2° |
|
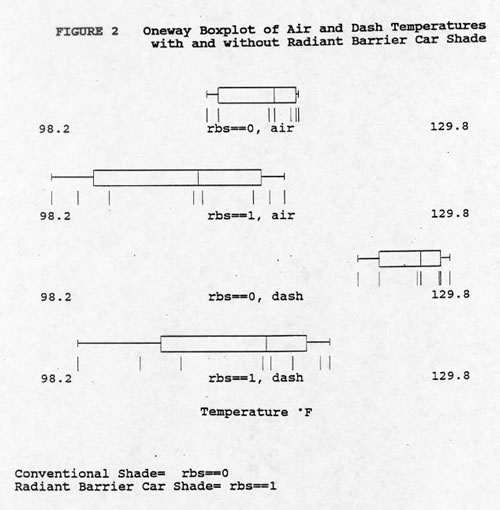
Figure
2 displays a one—way box plot of the car air and dashboard temperatures,
along with etch lines for each individual observation. The box represents
the inter—quartile range of the observations; the vertical line
is the median value. The “whiskers” show the range of
values encountered. The greater variation associated with the RBS
car shade results since the RBS was in place when the experiments
began and the car was still heating to an equilibrium state.
The temperature reduction caused by the RBS car shade is quite apparent
in the data. The interior.temperature while the RBS was in place was
6.8° F. cooler than when the conventional shade was installed; the
dashboard temperature averaged 14.3° cooler. However, this analysis
is simplistic, overlooking environmental conditions which may directly
affect the measured temperatures. These effects include the changes
in air, solar, heat capacitance and wind conditions which took place
while the tests were in progress.
To account for these effects, we assembled the FSEC meteorological
data for June 1st for the periods most closely approximating the observation
schedule. We matched these data to the physical temperature observations
and analyzed the experiment using a statistical model. Multiple regression
and analysis of variance techniques (ANOVA) were used to study the determinants
of the car air and dashboard temperatures. The best model of the car
air temperature was:
| Tair = -61.49 + 1.990 (Tamb) + 0.084 (Insolation) | ||||||
[1.47] |
[1.75] |
|||||
| - 2.354 (Etime) + .328 (Wind Speed) | ||||||
| [1.91] | [1.30] |
|||||
| + 0.023 (Sumso1) - 3.56 (RBS ) | ||||||
| [3.01] | [6.78] |
|||||
| R2 = .994 | ||||||
Where:
Tair = the car interior air temperature (CF)
Tamb = the ambient air temperature (°F)
Insolation= current horizontal solar insolation (W/ft2)
Sumsol= cumulative horizontal solar insolation (W/ft2)
Etime= Elapsed time since test start (hours)
Wind speed= mph
RBS= 0=Conventional Shade; l=RBS Shade
The model
explains 99% of the variation observed in the air temperature measurement.
The values in brackets are, the t— statistics for the various,,
parameters. Given the available degrees of freedom, values for ‘t’ exceeding
1.36 are significant at a 90% confidence level.
The major determinants of the car interior air temperature include
the cumulative solar radiation on a horizontal surface and the presence
or absence Of a radiant barrier car shade. All values were statistically
significant except for wind speed which is explained by its dualistic
affect on heat transfer. Increased wind speeds increase infiltration
of outside air, but also increase convective heat transfer coefficients
from car exterior surfaces. The model shows heat capacitance effects
of the car interior by the positive coefficient associated with cumulative
solar radiation. The automobile heat transfer coefficient is embodied
in the negative term that appears for elapsed time. In absence of solar
radiation, the model shows thatthe car interior would cool off. ‘ The
radiant barrier drops interior air temperatures by 3.6 F (±0.7 °F)
when, other differences are properly incorporated.
The same model was equally success-ful in ‘describing the car
dash temperatures:
| Tdash = 28.60 + 0.933 (Tamb) + 0.128 (Insolation) | ||||||
[0.47] |
[1.82] |
|||||
| + 0.401 (Etime) + .533 (Wind Speed) | ||||||
| [0.224] | [1.44] |
|||||
| + 0.006 (Sumso1) - 11.0 (RBS ) | ||||||
| [0.53] | [14.35] |
|||||
| R2 = .994 | ||||||
Where:
Tdash = the car dashboard air temperature (°F)
Tamb = the ambient air temperature (°F)
Insolation= current horizontal solar insolation (W/ft2)
Sumsol= cumulative horizontal solar insolation (W/ft2)
Etime= Elapsed time since test start (hours)
Wind speed= mph
RBS= 0=Conventional Shade; l=RBS Shade
The model
shows that the important determinants of the car dashboard temperature
are 1) Thea presence or absence of the radiant barrier car shade and
2) the instantaneouá level of solar radiation. The other terms
are statistically insignificant. Thus, the model indicates that the
RBS is responsible for an l1.0F (±1.0 F) drop in the dashboard
temperatures over the use of a standard car shade.
Summary of Initial Experiments
The initial assessment of the radiant barrier car shade concept showed
good promise for improving automobile comfort. Analysis indicated that
use of a radiant barrier car shade reduced automobile interior air temperatures
by 3 — 4 F. Dashboard temperatures were reduced by 10 — 12 °F
over the use of conventional shades.
Potential Improvements to the Radiant Barrier Car Shade
Two problems were noted with the concept in the initial experiment:
-
The interior foil face became hot to the touch after long periods. We planned to monitor the car shade interior surface temperatures to determine the severity of this drawback.
-
Due to the crude technique used to adhere the foil to the car shade, the foil tended to de—laminate from the cardboard backing under high levels of insolation. We solved this problem by the use of contact cement to adhere the foil surface.
FSEC staff
members proposed a number of suggestions to improve the concept. The
most significant of these concerned the optical characteristics of
the exterior facing surface. The white exterior facing surface on
the standard cardboard shade had a significant amount of dark-colored
printing probably gave an overall solar absorptance around 0.40. The
heat absorbed by this exterior color is readily transferred to the
inward foil—facing side of the shade. The low emissive foil
in turn retains the heat leading to excessively high temperatures.
Use of flat white paint with light colored lettering could easily
achieve an absorptance of 0.30 or less and minimize interior foil surface
temperatures. Accordingly, we painted our prototype RBS car shade flat
white to decrease exterior solar absorptance.
The 3—14 company manufactures a fabric like material with good
reflectance properties that also has low emissive characteristics. Such
material might also provide significantly less glare than white paint.
We have obtained samples of this material for future experimentation.
Also, information on radiation properties of various paints indicates
that some metallic silver paints may have absorptances of 0.30 — 0.25.
These paints also have the desireable characteristic of presenting less
glare to the exterior. Due to time limitations, we were unable to evaluate
how these various surfaces might affect performance. Assessment will
have to await additional experimentation.
Initially, we believed that a reflective foil covering on the exterior
car shade surface coupled with a foil low emissivity interior covering
would result in the best performance. The solar absorptance of foil
is fairly low, often in the range 0.15- 0.10. To test this concept,
we assembled a third car shade with PARSEC foil cemented to both sides.
Detailed
Side-by-Side Monitoring
After proving that the basic concept had sufficient promise, we pursued
more detailed experiments to validate our initial findings. We used
the following monitoring protocol:
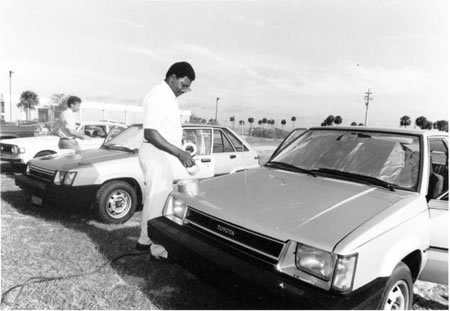
Two automobiles were monitored at FSEC over a period of five weeks.
We decided to use identical automobiles to minimize differences that
were likely to exist from one model to the next. This seemed especially
important in due to the likely dependence of interior thermal loads
on car color and window layout. The test automobiles were two nearly
identical 1987 Toyota Tercels with metallic green exterior color and
gray interiors belonging to FSEC employees.
Five copper—constantan thermocouples recorded the following measurements on each car:
-
Interior air temperature
-
Dashboard temperature
-
Steering wheel temperature
-
Car shade interior surface temperature
-
Car hood surface temperature
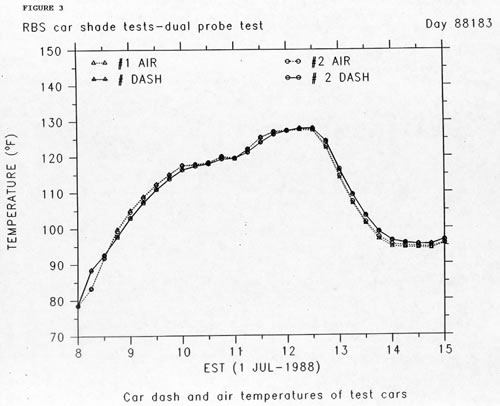
The thermocouples were installed according to procedures established at FSEC to insure accurate temperature measurements (Fairey and Kalaghchy, 1982). Nonetheless, each day the thermocouples were checked within the Passive Cooling Laboratory (PCL) to insure that readings were consistent. Maximum disagreement between probes was less than 0.5 °F and average bias was less than 0.1 °F. We made a final check on July 1st in which a car was instrumented with two probes at each location. Disagreement between temperatures taken averaged less than 0.2 F as shown in Figure 3.
We used
three conventional car shades for the experiments. One was left in
its original condition; another was altered into a prototype for the
RBS car shade. The last car shade had foil faced backing installed
on both interior and exterior surfaces.
We collected the monitored data on a FLUKE 2280 data logger which
was also used to collect meteorological data. on site (ambient temperature,
insolation, wind speed, relative humidity). The following experiments
were planned for entire day periods:
A. No car shade
B. Conventional car shade
C. RBS Car shade
D. Reflective RBS Car Shade -
We also planned several other experiments to determine the effect of window venting on car thermal response.
E. No car shade, windows slightly cracked for venting
F. Conventional car shade, window venting
G. RBS car shade, window venting
H. Reflective RBS Car Shade, window venting
Both cars
were to have all eight experiments performed on each. The experimental
protocol was broken into two blocks analyzing un—vented and
vented cases. We planned that each car would be alternately given
a different part of the four car shade treatments over four days.
The monitoring protocol and instrumentation procedure is described
in detail in Appendix A.
We encountered number of problems during the monitoring process.
Clear or partly cloudy conditions were preferred although not always
present and several experiments were inconclusive due to weather conditions.
The cars themselves were not always available since one the Tercels
is used in an FSEC car pool. This resulted in an experimental availability
averaging two times a week. This was, by far, the greatest handicap
to completion of the experiments.
Experimental
Results: Null Test
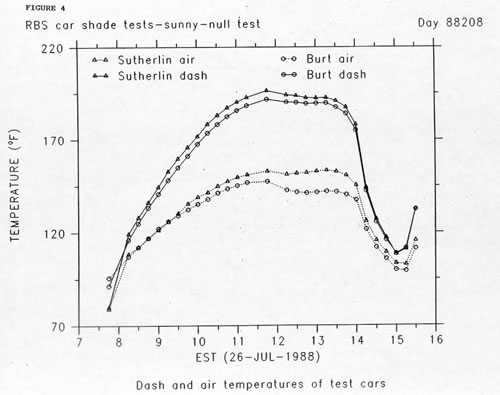
The null test consisted of monitoring both cars under full
sun conditions without any car shades or ventilation. This experiment,
carried out on July 26th, is depicted in Figure 4. The resulting
temperatures show the severity of the problem: air temperatures reached
over 150 F and dashboard temperatures rose to nearly 200 °F.
These values are similar to a previous study of ten car models which
showed interior air temperatures of 142 °F to 158 F in static
tests in Phoenix, Arizona (Atkinson, 1986). Such high temperatures
contribute directly to passenger discomfort, initial automobile air
conditioner loads and the need for large air conditioners to abate
them.
The test also showed that the Tercel from Burt Motors has a tendency
to maintain lower internal temperatures than its twin from Sutherlin
Motors.. The systematic bias was 4.9 °F for the interior temperature
and 3.1 °F for the dash temperature. We attribute some of this differenOe
t.o the somewhat darker color of interior upholstery in the Sutherlin
Motors Tercel. This level of bias posed a significant. problem for the
tests. To compensate for these internal temperature discrepancies we
switched the experimental treatment from one car to another during the
tests.
RBS versus non—RBS Car Shade
The major objective of the study was to identify systematic differences
between a conventional car shade and an RBS car shade. Accordingly,
most of the: initial experiments have concentrated on this determination.
. The most successful experiments were performed on June 16th and 17th
and are shown in Figures 5 and 6. June 16th was typical of summertime
conditions in Florida; it was mostly sunny with.temperatures in the
mid-BOg in the afternoon. With the conventional car shade the interior
temperature reached a maximum of 130- °F at 1:45 P.M. EST. At that
time the temperature rose to 127 °F in the car with the RBS car
shade.
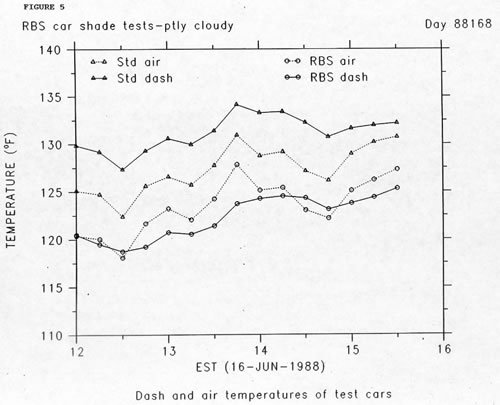
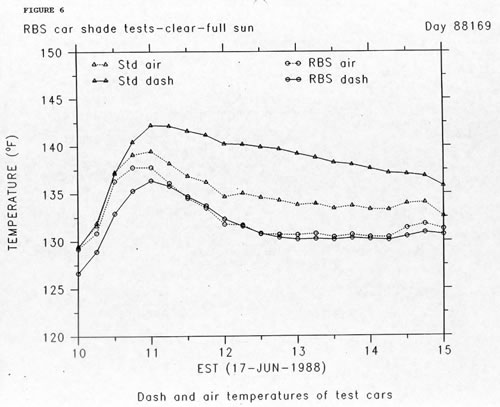
Over
the monitoring period, the car with the RBS car shade remained 3.0 °F
cooler inside than the car with the conventional car shade. The differences
between the dashboard temperatures were significantly greater, averaging
7.6 °F.
The tests on the following day were made under clear sky conditions.
We switched the RBS car shade to the Burt Motors car in order to correct
for differences between the individual automobiles. With the cars facing
south (as they did in all the experiments) the cars heated rapidly in
the morning hours. This results from the large solar input through the
east-facing driver’s side windows. Again the RBS car shade showed
superior performance compared to the conventional shade, with interior
air temperatures averaging 4.0 °F cooler with the improved shade.
Given the high levels of insolation, the differences in the dashboard
temperature were even greater than the previous day, averaging 8.8 °F.
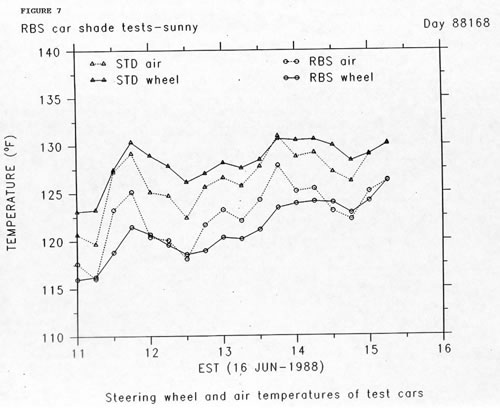
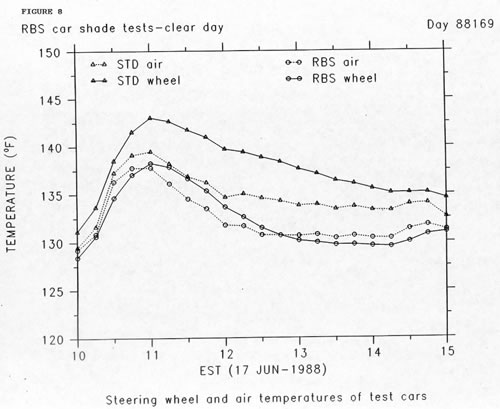
Steering wheel temperature reductions for June 16th and 17th are
summarized in Figures 7 and 8. The temperature differences between the
two shades averaged 6.6°F. over the two days. Since drivers must
handle the steering wheel upon entering the parked automobile, this
temperature reduction should provide improved driver comfort.
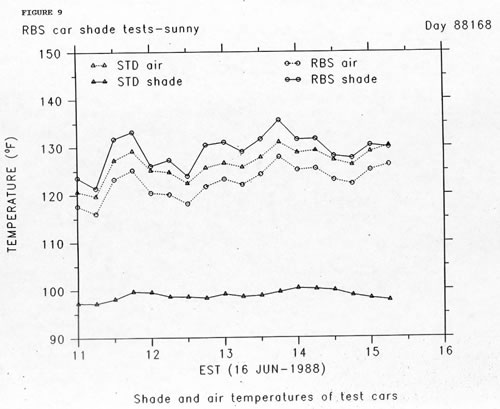
One concern expressed in the initial experiments was the higher surface temperatures on the RBS car shade that resulted from the low-emissive foil surface. We plot this difference for the two days in Figures 9 and 10. The data show that the interior car shade surfaces are raised substantially by the presence of the radiant barrier. The average increase was 22.1 °F over the two days with a maximum temperature on the radiant barrier surface of 165 °F at 11:00 A.M. EST on June 17th. The temperature at the same time was 142 °F on the interior of the conventional shade. We believed at the time that this effect might be minimized through the use of a reflecting surface on the car shade exterior.

Key results of the two day tests are summarized in Table 2:
Table
2 RADIANT BARRIER CAR SHADE EXPERIMENTS Side-by-Side Tests June 16th & 17, 1988 |
|||||
Temperature
( °F ) |
|||||
| Shade | Temp. |
Mean |
Std
Devn |
Min |
Max |
| Std
Shade Air RBS Shade Air Avg Difference |
131.0° 127.7° 3.3° |
2.1° 2.4° |
122.4° 118.1° |
139.5° 137.8° |
|
| Std
Shade Dash RBS Shade Dash Avg Difference |
135.2° 127.0° 8.2° |
1.9° 2.1° |
127.3° 118.7° |
129.8° 135.8° |
|
The
RBS car shade resulted in an average air temperature that was 3.3 °F
cooler than with the conventional shade. Dashboard temperatures were
reduced by an average of 8.2 °F. Maximum differences for any given
observatich were- on the, order of .5 °F for air temperatures
and 10 °F for dashboard temperatures. Data analysis indicated
that although these differences are modest, they are statistically
significant at a 90% confidence.level.
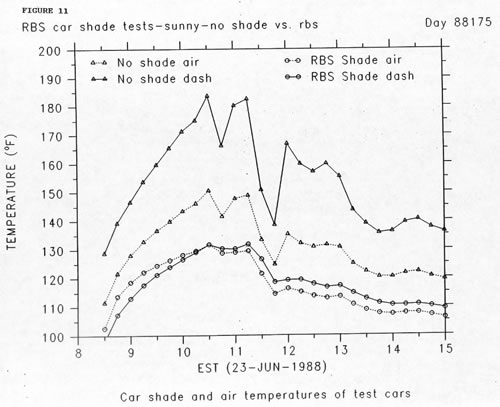
Finally, a test on June 23rd compared the no car shade condition
to the use of an RBS car shade. The results are depicted in Figure 11.
Average air temperature reduction in-the car with-the RBS car shade
was 13.4. °F (Maximum difference = 21.7 °F). Dash temperature
reductions were greater averaging 44.3 °F (maximum
difference = 53.1 °F).
The results of the three days of testing reinforced the- findings
from the single day tests on the Volvo on June 1st. RBS car shades perform
better than standard car shades. They also provide substantial reductions
in interior temperatures in parked automobiles when compared to no car
shade at all.
Vented Cases
Two
types of venting tests were desireable for our study of automobile
thermal performance. One of these wàuld determine how sensitive
the performance of the RBS car shade is to ventilation. The other
test would simply determine how much venting, can- reduce interior ‘temperatures
in unshaded automobiles. We defined our venting strategy as rolling
down the driver side car window so it provides a two inch vertical
crack length for venting. Other studies have examined how photovoltaic
power ventilation might be used to reduce interior temperature (Chiou,
1986). This is, unfortunately, beyond the limits of our study.
Our primary objective in the study was to define the difference between
the RBS and non-RBS car shade. Given this priority and the relatively
low number of available side-by-side test days with good weather, we
have only managed two tests the effect of venting strategies. We gave
these tests a lower priority since acceptance of this strategy is unlikely
due to concerns for automobile security, rain etc.
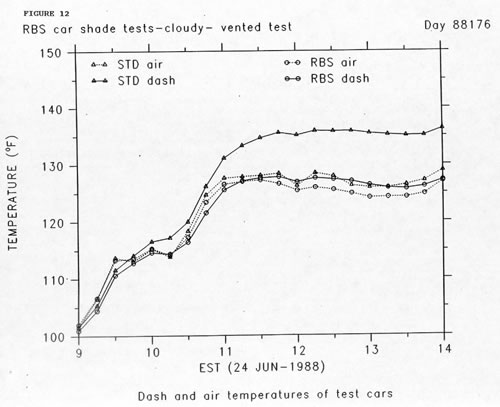
Of the two venting test types, we managed only to test the effect
of ventilation on the advantage of the RBS car shade. We performed the
test on June 24th; its results are shown in Figure
11. Conditions on this day were cloudy until 11:00 A.M. EST and then
sunny thereafter. Nevertheless, the vented test showed that the RBS
car shade resulted in air temperatures that averaged 1.4 °F lower
than the conventional shade. More importantly, the difference in the
dash temperature caused by the RBS shade was still similar in magnitude
to the un—vented case—— an average temperature depression
of 8.2 °F. Although not shown, the difference in the steering wheel
temperatures averaged 6.0 °F during the late afternoon. Thus, the
radiant barrier shade still results in lower interior surface temperatures
within the car during vented operation although reductions to interior
air temperature are less substantial.
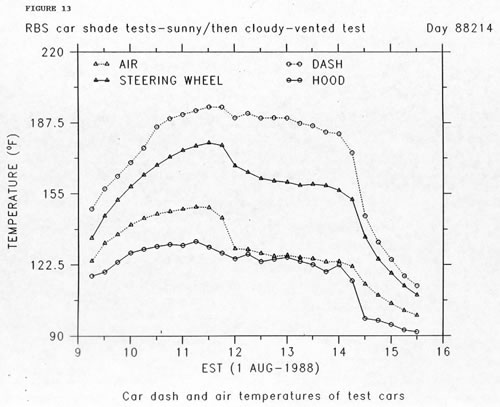
We performed a single experiment on August 1st on one of the test cars to determine venting potential (Figure 13). We left the single available Tercel sealed until 11:30 A.M. EST at which time we cracked its driver side window two inches. The automobile had no car shade during the test. The results show about a 10 °F drop in interior air temperature from the venting, although little effect on dashboard temperature. We conclude that venting potential may be significant, but that further experiments are necessary.
Specular-Reflective RBS versus RBS Car Shade
A
limited series of experiments have attempted to determine the relative
benefits of the a specular reflective car shade with an interior radiant
barrier (SRBS) over the conventional RBS car shade. Such a car shade
has foil laminated on both the interior and exterior faces. Analysis
of the data taken shows that such an exterior reflective surface results
in little or no performance improvement.
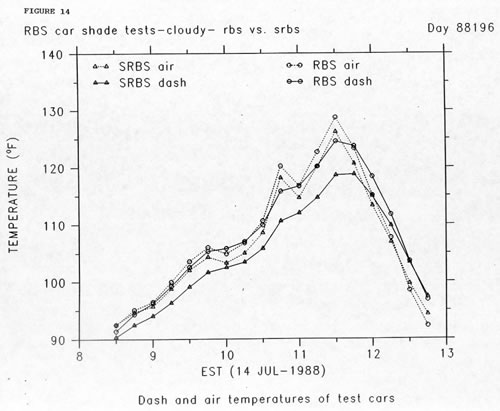
An experiment on a cloudy day, July 14th, (Figure 14) showed the
Burt Motors car equipped with the SRBS to perform only slightly better
than the conventional RBS car shade. We considered this result insignificant
given the tendency of the Burt Motors car to remain cooler than its
twin as observed in the null test. The experiment was terminated at
12:45 EDT in a heavy rainstorm when lightning struck the PCL and disabled
the data-logger. This ended the experiments for the project for over
a week.
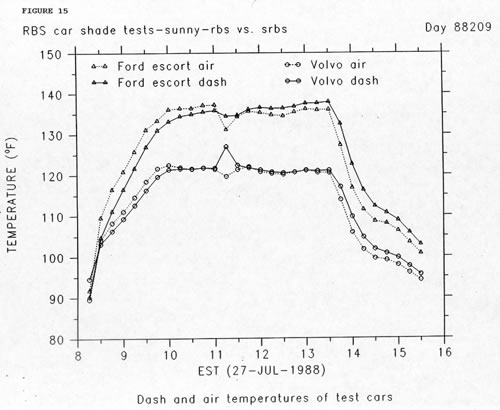
We
completed a much more successful experiment on July 27th using two
different cars, the 1973 Volvo and a 1987 Ford Escort. We used a mid—day
switch procedure to attempt to isolate the effect of the SRBS versus
the RBS car shade from the differing car types. The Escort began with
the SRBS shade, switching to the RBS shade at 11:30 EST.
These results, which are shown in Figure 15, conclusively show that
the SRBS offers no discernable advantage over the RBS shade for interior
air or dashboard temperatures. Furthermore, the monitored temperature
of the car shade interior surface actually showed the SRBS to be hotter
than the RBS shade. We explain this by the fact that the exterior foil
face on the SRBS shade exterior is also a low emissive surface. As a
result it retains most the heat absorbed from the sun rather than re-emitting
it to the glass above it, the coolest surface in view of the absorption
plane. On the other hand the flat white exterior face of the RBS car
shade is also highly emissive. Although it absorbs more of the incident
solar radiation, it readily- re-emits, much of it back to the car window.
The car shade temperature plot, depicted in Figure 16, readily shows
from the switch procedure how the SRBS actually results in higher car
shade temperatures.
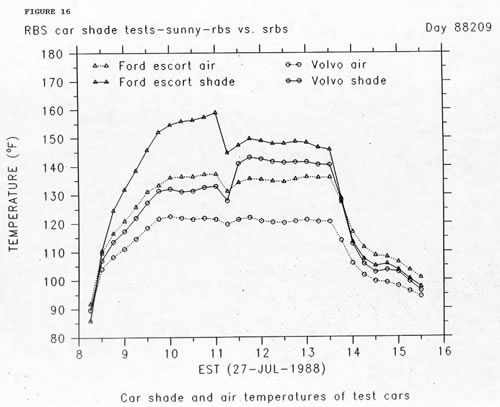
In summary, monitored results show that a double foil faced car shade performs worse than a standard RBS car shade.
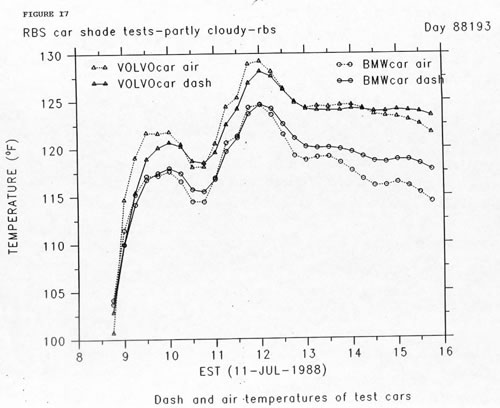
Non-similar
Car Types
Examination of various car types showed substantial variation among
models. We compared my 1973 Beige Volvo against a 1972 BMW 2002 on July
11th (Figure 17). Both cars had RBS car shades. The experiment pointed
to fundamental differences in the thermal performance of individual
cars. We expected this since different cars have substantial differences
in window configuration,
exterior paint color and interior layout, color and ai,r volume.
We determined cross-sectional A-B tests with switching of car shade
treatments at mid-day to be the most promising technique for simple
evaluation of experimental treatments on different automobile types.
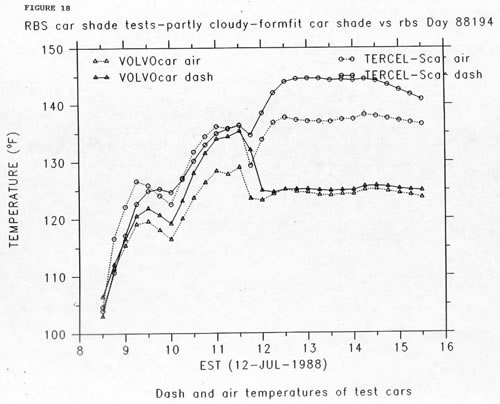
An
experiment on July 12th compared the Sutherlin Notors Tercel with
the RBS. car shade versus a custom made car Shade made- for - the
Volvo. The TJVS100 car shade is an insulated shade (Reliable Motoring
Accessories, San Luis Obisbo, CA) similar to the cardboard type. However,
it features a metallic silver painted exterior and thick-insulated
cloth panels. The silver color is not reflective and is actually more
absorptive than the white exterior on a conventional car shade. Consequently,
we expected its performance to be worse than the RBS shade. However,
the custom made shade does much more exactly fit the Volvo windshield
profile than does the car shade for the Tercel. Also, we could not
expect the automobiles to perform similarly being of different exterior
color, size and volume.
In the test during the morning test period the form-fit car shade
on the Volvo actually performed slightly better than the RBS shade in
the Tercel—— a seemingly contrary result. To isolate differences
coming from the indigenous thermal response of each automobile, we then
switched the car shades at 11:30 A.M. EST. Figure 18 shows that the
RBS car shade performed much better than the form—fit shade. The
RBS shade results in nearly a 20 °F difference in dashboard temperatures
and a 10 °F difference in air temperatures within one hour of the
change in the Volvo.
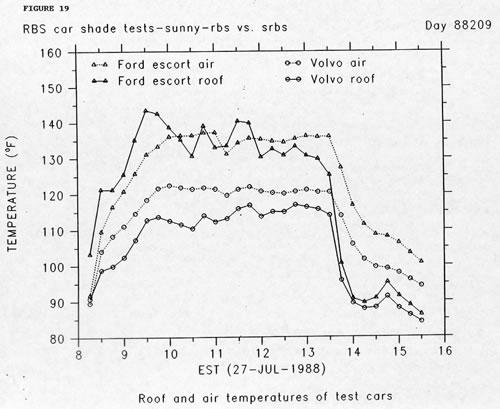
We observed exterior paint color for the automobiles to be a significant
factor in overall interior thermal load during sunny conditions. We
made a test of the off-white Volvo with the dark blue Ford Escort on
July 27th. The results showed over a 20 °F difference in the exterior
roof temperatures between the two automobiles during the sunny. morning
and early afternoon. This is shown in Figure 19. The rise in car surface
temperatures during sunny periods will obviously translate into an increased
thermal load for the car interior. Without different colors of the same
model car, however, it is difficult to quantify this effect.
A
comprehensive understanding of the variation between differing car
types and their interaction with car shades will require a significantly
greater monitoring effort coupled with ANOVA statistical analysis
methods to separate the effects of car type from the experimental
treatment. Such work must await additional funding.
The Need for Further Experimentation
The limitations of this study did not allow sufficient resolution of several key issues related to stationary automobile thermal performance:
-
Effect of venting on general performance and on benefits from car shades.
-
Assessment of various types of car shade coverings on thermal performance.
-
Determination of automobile model influence on thermal performance.
-
Assessment of effectiveness of fabric automobile covers.
-
Evaluation of automobile paint color on thermal loads for similar models.
-
Evaluation of window tinting effectiveness for similar models of automobiles of identical exterior color.
-
Statistical evaluation of data using auto—regressive moving average models as commonly used for building analysis (Rabi, 1988).
Attainment
of these various research goals will require further monitoring and
analysis. A large problem with the previous tests has been the poor
availability of the cars on a day-by-day basis. We are currently trying
to get a month long loan of automobiles from the Kennedy Space Center
G.S.A. Fleet Management Center in order to simplify our test procedures.
This will allow the monitoring equipment to remain set up for periods
without time-consuming set-up and tear-down of the instrumentation.
We envision the monitoring of three cars so one automobile is always
in a null-test configuration, while the other two can have varying
treatments applied. This will allow assessment of differences in experimental
treatment and null-tests to be carried out simultaneously.
There is currently no funding source available for. the proposed
work. We accomplished the previous effort by drawing upon internal resources
at FSEC. The monitoring performed thus far is, particularly important
since most of the previous- work on- automobile thermal performance
has used analytical simulation models. These models require a large
number of assumptions to predict performance (Ruth, 1975; Shimizu et.
al., 1982; Chiou, 1987; Aschenbrenner and Andersen, 1987; Sullivan et.
al., 1988). We believe our empirical approach offers benefits to research
by providing data which others can use to verify simulation methods.
We intend to actively seek funding opportunities to sponsor further
work in this area.
Conclusions
Monitored interior temperatures in un—shaded parked automobiles
in a hot climate such as Cape Canaveral, Florida commonly reach 150°F
and dashboard temperatures can approach 200 °F. The addition of
a conventional cardboard car shade behind - the automobile windshield
on sunny days can reduce the interior air temperatures by and average
of 15 °F and reduce dashboard temperatures by 40 °F.
Radiant
barrier system (RBS) car shades offer further improvements over conventional
cardboard shades. RBS car shades are similar to conventional ones,
but have a low emissivity foil backing laminated to the interior facing,
surface of the shade. When using an RBS car shade, automobile interior
air temperatures are reduced an average of 3 - 5 °F over conventional
shades. Steering wheel and dashboard temperatures are reduced by a
further 6 - 11 °F.
The advantages of the RBS car shade are relatively unaffected by
venting by car windows. Such venting results in less difference in air
temperature between a standard and RBS car shade (1.4 °F). However,
the reductions in the dashboard temperatures and steering wheel temperatures
are relatively unchanged by venting; an RBS car shade still results
in an 8 °F reduction in the car dash temperature.
In summary, the improvements from an RBS car shade results in the
following advantages:
-
Increased passenger comfort.
-
Less thermal stress on car interior components.
-
Lower ihitial automobile air conditioner’ loads.
Addition
of a reflective material to the car shade exterior does not appear
to improve performance significantly. Because of the low emissivity
characteristics of the absorptive surface, the shade surface temperatures
to become hotter than a shade with foil only on the interior facing
surface. Furthermore, such reflective coatings can be nearly blinding
to. individuals approaching such a car.
Performance of radiant barrier car shades are maximized with light
conventional colors on the exterior face of the car shade which have
a high emissivity. The exterior car shade color should be double coated
flat white with a minimum of dark.1ettering or othër patterns.
Preferred colors for such letters should be light blue or light green
with yellow for decor or other designs.
There is considerable need for further experimentation in this area
to perform a comprehensive analysis of static automobile thermal performance.
FSEC intends . to actively pursue further sources of funding for this
research.
Acknowledgements
Many individuals provided important contributions to this
project: Charlie Cromer afforded me the research flexibility to undertake
this work. David Beal and the staff at the PCL assisted with instrumentation
and instruction for its use in the study. Elvis GUmbS helped to carry
out the day-to-day installation of the instrumentation and maintenance
required for the experiments. Ross McLuney and Carol Emrich provided
useful suggestions to improve the conoept and pointed out other available
products. Philip Fairey and Sa.fat Kalaghchy assisted with data analysis
and interpretation. Finally, important mention must be made of the
individuals who volunteered their automobiles for use in the study:
Jim and Mary Huggins and Brian Roth and Joy Brafford.
References
Aschenbrenner, R. and Andersen, J., 1987. “Photovoltaic Glazing
for Automotive Applications,” SAE Paper 870036, February, 1987.
Atkinson, W.J., 1986. “Occupant Comfort Requirements for Automotive
Air Conditioning Systems,” SAE Paper 860591, February, 1986.
Chiou, J., 1986. “Application of Solar Powered Ventilator in Automobiles,” University
of Detroit, Detroit, MI.
Chiou, J., 1987. “Sunroofs and Cooling Loads of Automobiles,” University
of Detroit, Detroit, MI.
Fairey, P., Swami, M. and Beal D., 1988. RBS Technology: Task 3 Report,
FSEC-CR-211-88, Florida Solar Energy Center, Cape Canaveral, FL. April,
1988.
Fairey, P. and Kalaghchy, S., 1982. “Evaluation of Thermocouple
Installation and Mounting Techniques for Surface 3emperature Measurements
in Dynamic Environments,” FSEC-PF-21-82,
Proceedings from the 7th National Passive Solar Conference, Knoxville,
TN.
Rabi, A., 1988. “Parameter Estimation in Buildings: Methods of
Dynamic Analysis of Measured Energy Use,” Transactions of the
ASME, February, 1988.
Rohles, F. and Wallis, S., 1979. “Comfort Criteria for Air Conditioned
Automobile Vehicles,” SAE Paper 790122, February, 1979.
Ruth, D.W., 1975. “Simulation Modeling of Automobile Comfort Cooling
Requirements,” ASHRAE Journal, University of Manitoba.
Shimizu, et. al., 1982. “Analysis of Air Conditioning Heat Load
of Passenger Vehicles,” JSAE Review, 1982.
Sullivan, R. et. al., 1988. Potential for Down—Sizing Automobile
Air Conditioners Using Innovative Glazing Technology, Lawrence Berkeley
Laboratory, Unpublished paper prepared for U.S. Environmental Protection
Agency, Berkeley, CA, January, 1988.
Appendix A
Experimental Protocol for Car Radiant Barrier Experiment
Channel Map for Car Radiant Barrier Experiment
Channel
Numbers |
||
PCL |
As
Marked |
Measurement |
|
--------------------------------------------------------------------------- |
||
151 |
1 |
Control Car Air Temperature |
152 |
2 |
Control Car Dash Temperature |
153 |
3 |
Control Steering Wheel Surface Temperature |
154 |
4 |
Control Car Shade Interior Temperature |
162 |
10 |
Control Car Hood Surface Temperature |
159 |
5 |
RBS Car Air Temperature |
156 |
6 |
RBS Car Dash Temperature |
157 |
7 |
RBS Steering Wheel Surface Temperature |
158 |
8 |
RBS Car Shade Interior Temperature |
163 |
9 |
RBS Car Hood Surface Temperature |
|
--------------------------------------------------------------------------- |
||
Procedure
for Car Radiant Barrier Experiment
-
While probes are in PCL note temperature reading on each for calibration check.
-
Install probes with proper tape and at proper location. Be careful that air temperature probes are in the same are tied to the same area on the steering wheel.
-
Seal cars and check that all windows are closed and door secured.
-
Check that all channels are operating in PCL.
-
Note time, date and sky conditions when experiment began.
-
Check again in 15 minutes to make sure all probes are in place.
-
Remove probes at 4:30 P.M. Clean dash and steering wheel with a small amount of mineral spirits. Note time experiment terminated.
-
Put probes and car shades away in the PCL.
-
Note any problems encountered in the day’s monitoring or other observations.
Full Day Experiments
-
Roll down driver side windows on both cars by exactly two inches. Keep all other protocol the same.
-
Seal cars, but place RBS in car from Burt Motors.
-
On days that other cars are available, do standard instrumentation with sealed operation noting car model type used for RBS and control.
-
Control Car has no car shade at all, place interior car shade sensors on upper part of driver’s seat in both cars. Use RBS shade in other car.
-
Same as above, but use standard car shade.
-
Standard protocol but turn radiant barrier so that it faces outside (reflective surface to the sun).
-
As above experiment but with one car with reflective RBS exterior and the other with RBS with white exterior.
CAR RADIANT BARRIER EXPERIMENT LOG
Date
_______________________________
Calibration Check
Channel |
Reading |
151 |
________ |
152 |
________ |
153 |
________ |
154 |
________ |
156 |
________ |
157 |
________ |
158 |
________ |
159 |
________ |
Describe Day's Experiments:
Control Car and Test:
Control Car Other Notes:
RBS Car and Test:
RBS Car Other Notes:
Date and Time Begun:
Initial Sky Conditions:
Problems Encountered:
Date and Time Experiment Terminated:
© 2007-2014 University of Central Florida. The Florida Solar Energy Center (FSEC)
is a research institute of the
University of Central Florida.
For more information about FSEC, please contact us or learn more about us.
Find us on Facebook!