

Reference Publication: Parker, D., Sonne, J., Sherwin, J., "Demonstration of Cooling Savings of Light Colored Roof Surfacing in Florida Commercial Buildings: Retail Strip Mall," Final Report, October, 1997. Disclaimer: The views and opinions expressed in this article are solely those of the authors and are not intended to represent the views and opinions of the Florida Solar Energy Center. |
Demonstration
of Cooling Savings of Light Colored
Roof Surfacing in Florida Commercial Buildings:
Retail Strip Mall
Danny
S. Parker, Jeffrey K. Sonne, John R. Sherwin
Florida
Solar Energy Center (FSEC)
FSEC-CR-964-97
Executive Summary
A series of tests were conducted in seven retail shops in a strip mall in Cocoa, Florida to examine how roof whitening would impact air conditioning load. The roof of the strip mall was conventional: unsurfaced galvanized corrugated metal with R-11 insulation suspended by purlins underneath. Below the insulation was the roof plenum which contained both the air handler and duct air distribution system. Cooling was accomplished in each shop by a dedicated direct expansion air conditioning (AC) system between 3 and 4 tons in size. Each had its air conditioning metered for half of the summer in a baseline condition. Building temperatures as well as meteorological conditions were also obtained on a 15-minute basis. The roof was then resurfaced white at mid- summer using a commercially available roof coating product. The measured roof surface reflectivity was altered from approximately 29% to 75%. The tests were phased over a two summer period so that the impact of surface degradation could be measured in the second year of exposure.(1)
The results for both phases of the project, showed a 25.3% average reduction (8.6 kWh) in summer space cooling energy (34.1 kWh/day to 25.5 kWh/day) in the seven shops with a range of savings of 13 - 48%. The percentage savings varied with the temperature maintained in the shops; those maintaining the lowest interior temperatures saved the least on a percentage basis, although the absolute space cooling energy reductions were more similar ranging from 6.4 to 13.4 kWh/day. Total annual air conditioning in the seven monitored shops averaged 6,780 kWh; estimated savings averaged 1,670 kWh. Impacts on space heating were not measured.
The space cooling energy demand reduction was concentrated during the summer afternoon and early evening hours between 11 AM and 7 PM as seen in Figure E-1. During the utility coincident peak demand period (defined as 4 - 5 PM EST or 5 - 6 PM EDST) the overall electric demand reduction averaged 592 W (from 1469 to 877 W) or 40.3%.
We also used coincidental peak load factor (CPLF) analysis to examine the impact of the reduction on load shape. Using the defined peak period, the coincidental peak load factor of space cooling in the aggregate sample of buildings was altered from 0.97 in the baseline configuration to 1.21 after the roof was made white. This analysis indicates that the change to a white roof had a favorable impact on the building cooling load shape - the reduction during the utility peak demand hour was greater than the average reduction over the 24-hour cycle.
Finally, the application of the reflective roofing material was found to have a beneficial impact on the ability of the cooling systems in each of the monitored store fronts to maintain interior comfort during peak summer load conditions. Most of the shop owners mentioned that after the application they found the interior much cooler when opening for business and two increased the interior thermostat setting to compensate. Measured interior temperatures showed both less variation during the day as well as lower values in several shops during the late afternoon hours.
The estimated annual savings averaged $150/year per store front against a cost of application of $1,375. However, the economics for an operating utility program would likely be much more favorable in targeting commercial facilities which are in the process of installing new roofing system or re-roofing. In either case, the incremental costs for using white roofing materials can be negligible for white standing seam metal, white single ply membrane or white coatings over modified bitumen roofs.
1. Introduction
Architects in hot climates have long recognized that reflective roof colors can reduce building cooling loads (Givoni, 1976). Experimentation spanning nearly three decades has shown that white roofing surfaces can significantly reduce surface temperatures and cooling loads (Givoni and Hoffmann, 1968; Reagan and Acklam, 1979; Griggs and Shipp, 1988; Anderson, 1989; Anderson et al., 1991 and Bansal et al., 1992). A recent report by the U.S. Environmental Protection Agency (EPA) has suggested that reflective surfaces and landscaping has significant potential to reduce building cooling energy needs (Akbari et al., 1992). More importantly, measured cooling energy savings of white surfaces have been significant in California's climate (Akbari et al., 1991, 1992, 1997).
In Florida, field research by the Florida Solar Energy Center (FSEC) over the last three years has quantified the impact of reflective roof coatings on sub-metered air conditioning (AC) consumption in tests in a dozen occupied homes (Parker et al., 1993; 1994; 1995; 1997). The coatings were applied to the roofs of each home in mid-summer after a month-long period of monitoring during which meteorological conditions, building temperatures and AC energy use were recorded every 15 minutes.
Data analysis revealed significant reductions in space cooling energy at all sites. Using weather periods with similar temperatures and solar insolation, air conditioning energy use was reduced by 10% - 43% in the homes. The average drop in space cooling energy use was about 7.4 kWh/day or 19% of the pre-application air conditioning consumption. Utility coincident peak electrical demand reduction between 5 and 6 PM varied between 201 and 988 W (12% - 38%), averaging 427 W or 22%. The recorded load profiles showed that the energy use reduction occurred primarily during daytime hours between 10 AM and 8 PM. Recorded temperatures and infrared thermography revealed very large changes to the roof-attic thermal performance in each building as well as interactions with the thermal distribution system.
Unfortunately, until this project there has been no objective testing of the impact of roof whitening on the AC load of commercial buildings in Florida. This lack of information has impeded utility interest in Florida in developing utility-related programs. A group of Florida utilities, the Florida Electric Power Coordinating Group (FCG) expressed interest in further research in this area. The Lawrence Berkeley National Laboratory (LBNL), FCG and FSEC coordinated a research and demonstration project to address this need. Two demonstration sites have been monitored. The first was an elementary school in Cocoa Beach, Florida which was monitored for a year before and after a white roof coating was applied. A final report on this project was produced in 1996 for LBL/FCG and published recently in the CADDET Newsletter (Parker et al., 1996a, b). The project demonstrated a 10% annual savings in chiller energy with a 30% reduction in peak cooling electrical demand during the late summer utility peak demand period. The current report summarizes the project findings from the second demonstration project which was performed at a commercial strip mall.
2. Site Selection
The project team surveyed existing retail strip malls in the Central Florida area and chose 11 promising sites and took photographs and other site survey information. We then established criteria for a potential candidate site within the project:
Primary
- Representative of typical construction and vintage
- Sufficient number and diversity of shops
- Appropriate roof material for alteration
- Cooperation from the owners
Secondary
- Sufficient pedestrian traffic for the demonstration
- Roof-top AC system
- Reasonable ease in metering the individual shops
In review of the candidates, FSEC and FCG chose Rockledge Mall as the most promising site for the demonstration. A number of sites were eliminated from the process because they did not meet the established criteria; the most common problem was a built up roof with gravel for which we had no ready capability of altering to a suitable solar reflectance. After an initial screening, we then contacted the preferred sites.
After favorable initial negotiations, FSEC, FPL and the Conklin Company met with the Rockledge mall owner on May 24th, 1996. Unfortunately, the owner ultimately rejected our proposal to whiten the roof of the facility. In spite of expert roofing consultant testimony to the contrary (Dr. Dean T. Kashiwagi of Arizona State University), the owners were uneasy with application of the coating product to the torch-down roofing system, believing the upkeep of the roof system would differ from similar roofing systems within the owner's commercial properties. The owner felt that such circumstances could potentially increase his future costs of operation.
We then contacted the owners of the other sites and found a variety of problems in recruiting a facility, many stemming from the fact that the property managers do not bear the energy costs for the facilities:
- Built-up gravel roof would be too expensive to alter(2)
- Remote landlord not interested in the project
- Not interested in altering functional roof ("not broke, don't fix it")
- Alteration of the roof system could void existing roofing warranty
- Roof too large to pay for re-surfacing within the project budget
The difficulty of obtaining a volunteer mall for the project required extra effort to locate a potential site. Two of the previous 11 surveyed sites also backed out subsequent to our losing Rockledge Mall. Without incentives for participation in the project, we found owners generally indifferent to energy costs except when they became so large as to potentially effect vacancy rates. Others were found infeasible due to the physical roof configuration. Regardless, we were able to locate a small strip mall in Cocoa, Florida, suitable for the project, and obtained a signed agreement for the project in mid June, 1996.
3. Description of Test Site
The site is on U.S. Highway 1 (Figure 1); the metal building is 12,500 square feet with a total of eight shops. Each store front is approximately 25 x 50' with large glazed store fronts facing east. The shops are as follows from the north to the south:
Table
1
Description of Commercial Facility for Test
| Address | Description | Type | Schedule |
1559 1555 1553 1551 1549 1547 1545 1541 1543 1539 |
Bagel
Shop
Real Estate Insurance Cellar Phone Store Book Store Bedding Store " "The Embers" " Vacant |
Restaurant
Office Office Office Retail Retail1 " Day Care " Vacant |
Mon.
- Sat.
Mon. - Fri. Mon. - Fri. Mon. - Fri. Mon. - Fri. Mon. - Fri. " Mon. - Fri. " Not occupied |
1 Occupancy changed to phone service center in December 1996.
The roof is an un-surfaced galvalum metal roofing over metal studs with R-11 insulation suspended underneath on purlins (Figure 2). Dropped acoustic ceiling panels are located in each bay with the plenum containing the air handler and thermal distribution system. R-11 fiberglass batts are located on above the acoustic insulation panels. A contractor examined the roof and indicated that the site's metal roof could be readily resurfaced to white using available products.
All of the shops are served by 3-4 ton split system ACs on 220 volt single phase power. The air handlers are located in the roof plenum space with the exterior compressors on concrete pads to the rear of the wall behind each shop. Each shop is individually metered and served by the Florida Power and Light Company (FPL).
4. Experimental Plan
To isolate the impact of adding a reflective roof surface, a before-and-after experimental protocol was used. With this experimental approach, a period of base line data is collected on the space cooling performance at the facility. The data includes meteorological conditions and space cooling energy use. Preferably, this data would cover a long period of time, or at least contain good data spanning a large portion of the space cooling season. After the base line data is collected, the roofs of the various shops is altered to white at mid cooling season and the results on space cooling monitoring during the post period. With this approach, both the pre and post periods should contain sufficient data from the cooling season to obtain long periods (several weeks) with matching weather conditions for comparison.
Due to the need to obtain immediate results from the project, we planned to alter the roof color over two phases. In Phase I we would monitor all of the shops in their baseline condition for half of the summer of 1996. Two of the northernmost shops would then be changed to a white roof system at mid-summer. Their performance could then be compared with that in the pre-surfacing period, as well as with other non-surfaced shops in the post period. Thus, Phase I would provide immediate data on summer cooling related performance on two of the shops.
In order to obtain longer-term data, a second Phase of the roof resurfacing was envisioned. The other six shops would be monitored for a full year in their baseline condition and then be altered a mid-summer in 1997. This would allow long term full year pre and post data for these shops by the fall of 1998. We also desired to examine how much degradation of the Phase I re-surfacing could be observed after one year. This is a key issue associated with the cooling related performance of the technology.
5. Pre-evaluation Maintenance Needs
An early surprise from the first data collected was that several of the shop cooling systems being monitored were not operating properly. All of the units were direct expansion split AC systems with 3 - 4 ton nominal capacity. The following problems were identified:
- Intermittently operating condenser fan Cellular phone office
- Loose electrical terminal on contactor Bedding store (one of 2 systems)
- Refrigerant leak, low on charge Day Care center
- Refrigerant leak, no charge Vacant shop
- Fouled condenser coils All (high condenser head pressures)
- Fouled and faced over air handler filter All (except Cellular phone office)
Knowing that fixing these problems could potentially alter our results, we decided in favor or making the repairs. Not doing so could jeopardize the results from the roof resurfacing when AC equipment failed or was repaired or replaced in the middle of the experiment. Hence, an AC contractor was brought into the project and the problems were corrected between June 27th and July 9th. All filters were replaced and all condenser coils were cleaned by July 8th (see Appendix B). All equipment was considered in nominal condition as of July 9th. Baseline data collection was then continuous subsequent to that point.(3)
The energy consumption of the facility reflects its retail activities. The work week is a typical Monday - Friday schedule, although some weekend activities occur at the bagel shop and the Daycare facility. There are approximately 250 work days per year, when accounting for holidays.
6. Monitoring Protocol and Instrumentation
Instrumentation was installed on site from June 21 - 27th, 1996, with continuous data collection beginning on the later date. Over 50 channels of temperature, meteorology and AC consumption data were recorded. Figure 3 shows the power transducers being installed on to measure one of the shop air conditioners.
Meteorological conditions monitored at the site included ambient temperature, relative humidity, insolation and wind speed (Figure 4). Temperature readings were obtained at three points on the roof consisting of the metal roof surface, underside surface of the insulation, the plenum air temperature, and the conditioned interior air temperatures.
Temperature measurements were obtained using calibrated, type-T, copper-constantan thermocouple wire installed at various points in the building. The ambient air sensor was shielded from direct radiation by placing it inside of a vented enclosure. Capacitive-type humidity transmitters provided temperature compensated RH readings. Insolation was measured using a horizontally mounted silicon-cell pyranometer located on the rooftop. Electrical power consumption was assessed by a 50-amp pulse-initiating power meters (Ohio Semitronics WL4RX1026).
The instruments were calibrated. Thermocouples were calibrated against NIST traceable thermometers and the humidity transmitter against a General Eastern Hygro-M1 chilled-mirror hygrometer. Insolation values obtained using Li-cor pyranometer were compared to those of a Eppley Precision Spectral Pyranometer (PSP). The power meters were factory calibrated and checked against spot measurements using clamp-on ammeters.
The amount of power consumed by the air conditioners were monitored for each store front to determine the electrical demand. Heating energy consumption was not measured. Table 2 lists the measurements taken and associated units for each parameter.
Table
2
Demonstration Site Data Collection Parameters
| Parameter | Units |
| Meteorological Conditions | |
| Ambient air temperature | oF |
| Relative humidity | % |
| Insolation | W/m2 |
| Wind Speed | mph |
| Building Conditions | |
| Roof surface temperature (North/Mid/South) | oF |
| Roof insulation underside temperature | oF |
| Plenum space air temperature | oF |
| West wall surface temperature | oF |
| Interior air temperature (Eight storefronts) | oF |
| Cooling System Power Consumption | |
| AC electrical energy use | W-hrs |
A Campbell Scientific model CR10 datalogger was used to convert the analog and pulse instrument outputs to digital format (Figure 5). Instrument data were read at 5 second intervals and integrated or totalized values were recorded by the datalogger every 15 minutes. Data were transferred from the datalogger via a telephone modem to the mainframe computer each evening. The data are then automatically plotted to summarize the daily performance parameters measured. Plots were examined by the project engineer the following morning to insure reliable data collection.
An example of daily plots are shown later in the report as Figures 16 - 19 during the period before the roof coating was installed. Two plots summarize all the daily performance parameters. Daily weather conditions are shown in the upper left-hand graph; this includes a summary of the air temperature, the relative humidity and the solar insolation. The panel on the lower left shows the measured roof surface temperatures for the north, mid and south roof sections at the project; examination of these plots clearly illustrate how the roof surface temperature tracks the solar irradiance in the plot above it. The daily cooling related performance of each shop is then represented in two plots to the right. The upper graph describes the plenum and interior air temperature conditions. The plot below shows the AC electrical demand over the 24-hour period. Thus, eight pairs of plots on the two pages describe the daily interior comfort and AC performance at each shop within the project.
7. Reflectivity Measurements
Site roof reflectivity measurements used methods developed by previous investigators (Reagan and Aklam, 1979 and Taha et al., 1992). The measurements were made with an Eppley Precision Spectral Pyranometer (PSP) that is sensitive to radiant energy in the 0.28-2.8 nanometer range. The pyranometer has an out output of 8.65 x 10⁻⁶ volts per W/m2. The double-dome design of the PSP mitigates the effects of internal convection resulting from tilting the pyranometer at different angles. The PSP is alternately faced up and down to gauge the amount of radiation being reflected from the roof surface (Figure 6). The output of the PSP was recorded on a Fluke 77 Multimeter over a period of approximately 30 seconds. The ratio of the reflected flux measurement to that of the incident solar reading was taken as the reflectivity of the surface.
To perform
the tests, the PSP was extended on a six foot boom and held above
the measured roof section. Theoretically, the resulting shadows from
the apparatus will somewhat bias the measured albedo. However, based
on research at Lawrence Berkeley National Laboratory (Taha et al.,
1992), we expected these effects to be minimal. In accordance with
the LBNL work, we chose a 1.5 foot height for the flux measurements
so that the PSP's view factor of the roof was maximized, while minimizing
the impact of shadowing. The test points were taken within one hour
of noon under clear sky conditions in which the pyranometer was alternately
faced upward toward the sun, and downwards towards the roof surface.
Six measurement locations were tested on the roof of each of the sites
with three repetitions made at each measurement point. The resulting
data were then averaged into a single calculated albedo for the roof
surface.
Measured roof reflectivity at the strip mall was changed from 28.8
(+0.4)% to 75.3 (+3.2)% as measured before and after the
first coating. These values represent the averages of 12 repetitions
of these measurements across the surface of the roof. The results were
uniform with a fairly homogenous roof albedo across the entire surface;
the albedo measurements before the roof was coated only varied from
28.3 to 29.2% over the range of the repeated measurements; the range
after coating was 72.6% to 77.4%.
Examination of the exposed exterior roof surface with an infrared camera at mid day on June 9th, 1996 (Figure 7) revealed temperatures of over 150oF (Figure 8). Examination of the thermal conditions on the building interior (Figure 9 and 10) showed elevations of 5oF above room conditions on the insulation surface and as much as 15oF on the metal studs.
 |
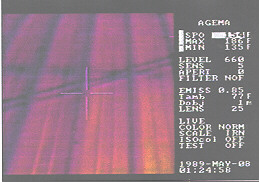 |
Figure 8. Visible and infrared image of uncoated metal roof. Roof surface is 154o - 160o F.
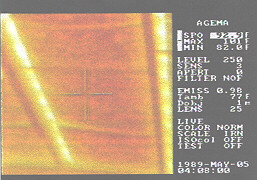
Figure 9. Infrared image of ceiling showing suspended batt
insulation between metal trusses.
Interior insulation surface temperature is 93o F. See Figure 2 for
visible image.
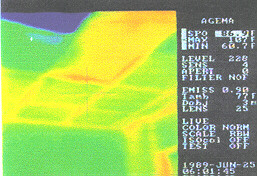
Figure 10. Infrared image of ceiling tiles between conditioned
space and plenum looking from the
conditioned interior. The ceiling surface temperature is 87o F
8. Roof Whitening: Phase I
The first roof coating was applied to a section of the mall roof after a month of treatment data had been collected. The coated section covered the two northern most shops within the mall. This consisted of the bagel shop and the insurance office immediately adjacent.
The galvanized roof of the two northern most store front were slated to be whitened on August 4th, 1996. However, problems with the weather delayed the initial application until August 11th. The unsurfaced metal roof was first cleaned using an acid wash on August 10th. The first coat was complete by 1 PM on the following day. However, weather appropriate to a second application was even more difficult due to rainy conditions in the month of August, and was only accomplished on 25th of the month. The first coat was applied on August 11th with second coat on August 25th, 1996. Figures 11 and 12 show the material in application.
A commercially available product (Conklin Benchmark Acrylic Roof
Coating) was used for the re-surfacing.(4) The
coating was applied to the corrugated metal roof surface by using an
aerated sprayer. The prime coat was applied to a thickness of 13 -
14 mills, the reflective top coat was applied to a similar thickness.
The application coverage used 2.2 gallons of base coat per hundred
square feet of roof surface and a similar amount of material for
the top coat. This amounted to approximately 120 gallons of material
to coat each store's roof (2500 ft2).
9. Roof Whitening: Phase II
The remaining five shops in the mall project began to receive their white coating on July 30th, 1997. All of the remaining roof sections were made white, save for the single unoccupied shop on the extreme south end which was maintained as a control. Final coating application was complete on August 11th. At the same time the reflectance of the newly installed coating was applied, we also examined the change in reflectance at the year-old section. We found little evidence of degradation of the white surface installed a year previous. Using the inverted pyanometer technique, we measured an in situ solar reflectance of 72.6 (+ 10.3)% on August 6th, 1997 against the freshly coated value a year ago of 75.3 (+3.2)%.
The uncoated metal roof had a measured reflectance of 29.6%. The newly surfaced section of the roof had a solar reflectance of 77.4 (+6.0)%. Figure 13 shows the coating to the mall being applied to the remaining segment of the roof. Figure 14 shows the one year old white painted section of the roof against that being freshly coated. Finally, Figure 15 photograph shows a close-up of the one year old section of the coated roof. Little degradation of the white surface is seen. Although the difference in the means was 2.7% lower after a year of exposure, the value is within the statistical uncertainty of the measurements. While close physical examination of the aged surface reveals a very slight accumulation of small dirt particulate, the roof appears essentially as it did a year ago. This may indicate that the rate of degradation of white metal roofs might be significantly lower than for other less smooth types.
10. Experimental Results: Phase I
Initial examination of the 15-minute data from the change to the two northernmost shops showed substantially lower roof, plenum and interior temperatures. Even though weather conditions were similar, the roof-plenum temperatures evidence significantly improved thermal performance after application. Figures 16, 17, 18, 19 show daily data retrieved in the project on two comparative hot summer days before and after the roof whitening.
| Before Coating | After Coating | |
| Weather data | 16a | 18a |
| Bagel World | 16b | 18b |
| real estate office | 16c | 18c |
| insurance office | 16d | 18d |
| cellular phones | 17a | 19a |
| book store | 17b | 19b |
| bedding store | 17c | 19c |
| daycare | 17d | 19d |
| vacant office | 17e | 19e |
The matched days were chosen for their similar temperature and insolation weather patterns. The pre-application day is August 9th (Julian day 96-222); the post application day is August 31st (96-244). Roof temperatures of over 170oF were recorded on the unmodified center and south sections of the roof, while the white north roof section maintains peak surface temperatures 70oF less. Peak plenum temperatures are also visibly lower. Recorded daily air conditioning power was reduced by 26% in the bagel shop and 27% in the realty office in spite of the post period day being 1oF warmer than its pre-application match. Interior comfort conditions also show evidence of improvement.
Using the entire month of baseline data we searched for a period post treatment with very similar average ambient air temperature and solar insolation. Table 3 shows the comparison of the key performance parameters for the pre and post periods for the two shops when using this approach. Figures 20 - 23 graphically show how the temperatures and AC use varied in the two initially re-surfaced store fronts. Average AC energy reduction in the two shops in Phase I was 6.8 kWh/day or 16%. The average demand reduction during the utility peak hour was 0.45 kW or 21%.
Table
3
Comparative Average Performance Before and After Roof Whitening
Before: June 27 - July 26, 1996; After: Aug. 19 - Sept. 10, 1996
Weather Conditions
| Ambient Temperature (oF) | Relative Humidity (%) | Wind Speed (m/s) | Solar Irradiance (W/m2) | Roof Temperature (oF) |
| 81.3 81.2 0.1 |
78.8 79.6 -0.8 |
2.77 2.90 -0.13 |
240 235 5.0 |
92.8 79.1 13.7 |
| Store Front | Plenum Temp. | Interior Temp. | AC/kWh
|
Peak Plenum Temp. (F) | Peak Interior Temp. (F) | AC Pk kW |
| Bagel
Shop
Before After Difference Percent |
84.6
79.9 4.7 |
74.8
74.9 -0.1 |
48.18
41.79 6.39 13.3% |
92.5
83.8 8.3 |
75.6
74.3 1.3 |
2.245
1.834 0.411 18.3% |
| Realty
office
Before After Difference Percent |
84.8
80.1 4.7 |
72.7
73.4 -0.70 |
37.32
30.11 7.21 19.3% |
95.4
85.0 10.4 |
73.1
74.1 -1.0 |
2.051
1.565 0.486 23.7% |
We also used an infrared scanner to graphically illustrate how the roof surface thermal conditions were altered. Figure 24, with both a visible and infrared image of the paint line between the second and third shops, clearly shows the overall impact. In the infrared image, color is proportional to temperature. The image, which was taken at mid morning shows that the unsurfaced section of the roof has risen to over 125oF, while the white section is thirty degrees cooler.
Figure 24. Comparison of visible and infrared image of coated
and
uncoated sections of the mall roof on July 16th, 1997.
Figure 25 shows the match of weather conditions in the pre and post period in 1996. Figure 26 shows how the roof surface and plenum thermal conditions were reduced. Finally, Figures 27 and 28 show how air conditioning electric demand and interior comfort conditions were altered from the roof resurfacing in the bagel shop and realty office, respectively. AC use was dropped by 13% and 19% in the two shops with peak hour reductions of 18% and 24%. Interior comfort conditions were also improved substantially in the bagel shop which is dominated by large internal loads from refrigeration units.
11. Phase II Performance
Table 4 describes the statistics for the comparison of the year of pre and post data for the shops whitened during the second year of monitoring. The AC data showed an average 9.4 kWh per day or 33% average reduction in air conditioner energy requirements in the five shops altered in Phase II. Average reductions in electrical demand of 0.9 kW were observed during the utility system peak hour of 5 - 6 PM ( 4 - 5 PM EST).
The match of weather conditions in Phase II is shown in Figure 29. Figures 30, 31, 32, 33, 34, 35 show how air conditioning electric demand and interior comfort conditions were altered from the roof resurfacing in each of the altered shops of the mall.

12. Occupant Comfort
Occupants in each retail store were interviewed before and after the roof treatment was whitened. In most cases, the occupants were aware in a change in the thermal comfort conditions after the roof was made white. During the Phase I portion of the project, Meridith Huelsman, the owner of the bagel shop reported that the temperatures during the afternoons seemed lower than before the roof covering -- a fact reflected in the collected data. "It helps people to decide to stay and sit down to eat." Occupants at the realty office reported having to adjust their thermostat upwards "since it was too cool in the mornings" after the change.
Table 4
Comparative Average Performance Before and After Roof Whitening
Before: June 12 - July 30, 1997; After: Aug 12 - Sept. 30,
1997
Weather Conditions in Pre and Post Period
| Ambient Temperature (oF) | Relative Humidity (%) | Wind Speed (m/s) | Solar Irradiance (W/m2) | Roof Temperature (oF) |
| 80.9 81.0 -0.1 |
84.8 83.9 1.1% |
1.72 2.02 -0.30 |
235 212 13 |
96.8 79.4 17.4 |
| Store Front | Plenum Temp. | Interior Temp. | AC/kWh
|
Peak Plenum Temp. (oF) | Peak Interior Temp. (oF) | AC Pk1 kW |
| Insurance
Before After Difference Percent |
88.7
80.5 8.2 |
84.5
80.6 3.9 |
20.15
12.27 7.88 39.1% |
96.4
84.3 12.1 |
87.1
82.1 5.0 |
0.581
0.106 0.475 81.7% |
| Cell
Phone
Before After Difference Percent |
83.3
79.1 4.2 |
77.2
77.6 -0.6 |
33.16
26.73 6.43 19.4% |
90.9
83.4 7.5 |
77.2
77.6 -0.4 |
1.810
1.323 0.487 26.9% |
| Book
store
Before After Difference Percent |
87.2
80.6 6.6 |
82.5
79.8 2.7 |
27.72
14.36 13.36 48.1% |
94.3
84.0 10.3 |
82.9
80.4 2.5 |
1.298
0.555 0.743 57.2% |
| Bedding
store
Before After Difference Percent |
88.7
80.6 8.1 |
86.6
80.0 6.6 |
19.10
12.81 6.29 32.9% |
97.9
85.7 12.2 |
94.42
84.5 9.9 |
0.313
0.090 0.210 71.2% |
| Day
care
Before After Difference Percent |
88.5
79.5 9.0 |
82.5
81.9 0.6 |
53.21
40.24 12.97 24.4% |
96.5
87.5 9.0 |
84.71
81.6 3.1 |
1.699
0.437 1.262 74.3% |
1 Peak period is 4-5 PM EST; 5-6 PM EDST; these values are the averages during the peak period over it length.
Similar comments subsequent to the Phase II portion of the roof resurfacing. Although the insurance store receptionist noticed no difference, the book store owner noticed that it was much cooler inside when opening for business in the morning. Ms. Traci Wood, the Nurse Manager at the Embers Alzheimer's Day Care Center reported the largest perceived impact. "It has made a major difference here. It is much cooler in the mornings when we open up. We turn off the air conditioning at night, but now it feels like it has been running when we come to work. We thought someone had fixed the air conditioner."
The measured average interior air temperatures in the shops were reduced. The air temperature by the thermostat dropped by an average of 1.8oF and the unconditioned plenum by over 6.5oF -- resulting in a cooler ceilings and lower mean radiant temperatures. Thus, the increased comfort mentioned by the shop owners, was verified by the field measurement.
13. Estimated Savings
To estimate annual energy savings of the roof re-surfacing, we summed the measured air conditioning energy in each shop from July 1, 1996 to July 1, 1997 and then used this as a basis for the estimates. The savings percentages developed from the monitoring described in Tables 3 and 4 were applied to the result to obtain estimates of annual space cooling energy reduction:
Table
5
Measured Annual Air Conditioning Energy Savings
| Shop | Measured Ann. kWh | Percent Savings | Estimated Savings | Monthly Demand Savings (kW) |
| Bagel
shop Realty office Insurance office Cell phone office Book store Bedding store Daycare center |
13,296
* 8,420
* 4,293 6,082 3,572 7,083 4,347 |
13.3% 19.3% 39.1% 19.4% 48.1% 32.9% 24.4% | 1,768 1,625 1,679 1,180 1,718 2,330 1,061 |
0.41 0.49 0.48 0.49 0.74 0.21 1.26 |
| Average | 6,728 | 24.1% | 1,623 | 0.58 |
- Annual space cooling in these two shops was obtained after the roofs had been treated; the values have been increased by the percentage savings to produce an estimate of the pre-treatment space cooling use.
Demand savings have been based on the reductions seen during the peak summer period between 5 and 6 PM. The actual impact is uncertain; since total loads were not measured, we cannot be certain when the peak was set. Also, this obviously varies by month. However, as will be seen in Figure 34, the demand reduction during the identified peak period is likely conservative since maximum AC load for the shops was closer to mid-day with much larger reductions in demand from the roof resurfacing.
14. Economics
Based on the average numbers above, we can estimate the annual savings to the shop owners. With a small commercial electricity rate of $0.05/kWh and a demand charge of $9.5/kW, the typical shop owner would see an annual reduction in utility costs of approximately $150.
The cost of the white roof application in the project totaled $0.53/ft2 ($0.33/ft2 for materials and $0.20 for labor). Given the 2,500 square foot roof area for each store front, the total cost for each shop would average $1,325. With the estimated savings shown above, the simple payback would be approximately nine years.(5)
However, two other factors are important to gauge the potential economics of white roof resurfacing. Firstly, a potential utility program would want to target facilities for a light colored roof that were involved in re-roofing. Whereas discretionary change to a white roof costs approximately $0.50/ft2, the incremental cost for choosing a new white roof system when re-roofing is often negligible. For instance white single ply membranes cost little more than dark ones and white standing seam metal roofs are no more expensive than other colors. Similarly, with modified bitumen roofs, a white roof coating can be substituted for a conventional aluminized coating at very low incremental cost (<$0.10/ft2).
A second factor entering into the attractiveness of white roofing for commercial buildings is the increased comfort brought about by the system. As observed in the project, shop owners were very pleased to find that the interior air temperature was lower inside prior to turning on the AC system. As seen in Figure 21, this also resulted in less interior temperature variation during the day after the roof was treated. Finally, should power be interrupted due to storms or other difficulties, the shops would warm up less rapidly and maintain interior comfort for a longer time.
15. Results and Discussion
A series of tests of the impact of surfacing commercial roofs white were conducted in seven retail shops in a strip mall in Central Florida. The roof of the strip mall was un-surfaced galvanized corrugated metal with R-11 insulation suspended by purlins underneath. Below the insulation was the roof plenum which contained both the air handler and duct air distribution system. Cooling was accomplished in each of the shops by a dedicated direct expansion air conditioning system. Each shop had its air conditioning metered for half of the summer in a baseline condition. Building temperatures as well as meteorological conditions were also obtained. Fifteen minute AC electrical demand was collected. The roof was then re-surfaced white at mid summer using a commercially available roof coating product. The measured roof surface reflectivity was altered from approximately 29% to 75%. The tests were phased over a two summer period so that the impact of surface degradation could be measured in the second year of exposure.
The results for both phases of the project, showed a 25.3% average reduction (8.6 kWh) in summer space cooling energy (34.1 kWh/day to 25.5 kWh/day) in the seven shops with a range of savings of 13 - 48%. The percentage savings varied with the temperature maintained in the shops; those maintaining the lowest interior temperatures saved the least on a percentage basis, although the absolute space cooling energy reductions were more similar ranging from 6.4 to 13.4 kWh/day. Impacts on space heating were not measured.
The space cooling energy demand reduction was concentrated during the summer afternoon and early evening hours between 11 AM and 7 PM as seen in Figure 36. During the utility coincident peak demand period (defined as 4 - 5 PM EST or 5 - 6 PM EDST) the overall electric demand reduction averaged 592 W (from 1469 to 877 W) or 40.3%.
We also used coincidental peak load factor (CPLF) analysis to examine the impact of the reduction on load shape: Generally, a CPLF indicates a disadvantageous load if <1; loads with CPLF >1 tend to help the utility in reducing the magnitude of the difficulty in serving the peak load (help to smooth out peaks). Using the defined peak period, the coincidental peak load factor of space cooling in the aggregate sample of buildings was altered from 0.97 in the baseline configuration to 1.21 after the roof was made white. This analysis indicates that the change to a white roof had a favorable impact on the building cooling load shape -- the reduction during the utility peak demand hour was greater than the average reduction over the 24-hour cycle.
16. Implications for the Design of Utility Programs
Although a site was eventually located for the project, our difficulty recruiting participants points out two primary factors that would potentially impact utility programs:
1) Any potential programs must target particular roofing system types that can be easily made white. These will generally exclude those facilities committed to the use of ballasted or gravel roofs (although lighter colors of gravel can be chosen, the longevity and performance is unknown).
2) Programs would do best to concentrate on influencing buildings to consider a white roof in new building prior to construction, or otherwise to influence existing buildings where owners are contemplating re-roofing.
Finally, our monitored data showed that savings were greatest in the shops which maintained higher interior temperatures - particularly in facilities which were being air conditioned to the minimum necessary while vacant (the bedding store). This is likely due to the fact that the roof is a much larger part of the cooling load in these facilities. Given this fact, it seems likely that utility programs targeting air conditioned storage facilities in Florida would see very large impacts on time-of-day AC demand.
17. Follow-up
The full extent of the data on the five shops recently altered will not be available until the summer of 1998. We intend to continue data collection of the facility until a full year of pre and post data is available for the facility. This should allow more precise estimates of the impact of the white roofing on long-term performance, as well as study of the degradation of the first coated roof section after two years of exposure. Within the project monitoring, we identified three other potential opportunities to reduce AC demand that were not part of the identified project objectives (See Appendix B).
18. Acknowledgments
This project was jointly supported by the Florida Energy Office; the Florida Coordinating Group (a consortium of Florida utilities) through the Florida Power and Light Company and the Lawrence Berkeley Laboratory under a sub-contract from the U. S. Department of Energy and the U.S. Environmental Protection Agency. The combined support of these agencies is gratefully acknowledged.
Jim Giebel and the Conklin Company graciously provided the roof coating material used for the project as well as technical support in its application. Jeff Mahlstedt of Professional Roofing in Cocoa, Florida applied the material and patiently dealt with the difficulties of scheduling the work amid Central Florida's frequent summer rainstorms. Finally, thanks to Jim Hooper, the mall management and the individual store owners for their cooperation within the project.
19. References
Akbari, H., Davis, S., Dorsano, S., Huang, J. and Winnett, S. Cooling Our Communities: A Guidebook on Tree Planting and Light-Colored Surfacing, 22P-2001, U.S. Environmental Protection Agency, Washington D.C., January, 1992.
Akbari, H., Huang, J., Sailor, D., Taha, H. and Bos, W., 1991. Monitoring Peak Power and Cooling Energy Savings of Shade Trees and White Surfaces in the Sacramento Municipal Utility District Service Area, Interim Report to the California Institute for Energy Efficiency, Lawrence Berkeley Laboratory, Berkeley, CA.
Akbari, H., Taha, H. and Sailor, D. "Measured Savings in Air Conditioning from Shade Trees and White Surfaces," Proceedings of the 1992 ACEEE Summer Study on Energy Efficiency in Buildings, American Council for an Energy Efficient Economy, Washington D.C., Vol. 9, p. 1, August, 1992.
Akbari, H., Bretz, S., Kurn, D.M. and Hanford, J., "Peak Power and Cooling Energy Savings of High Albedo Roofs," Energy and Buildings 25, p. 117-126, Elsevier Sequoia, Netherlands.
Anderson, R.W., 1989. "Radiation Control Coatings: An Under-utilized Energy Conservation Technology for Buildings," ASHRAE Transactions Vol. 95, Pt. 2, 1989.
Anderson, R.W., Yarbrough, D.W., Graves, R.S. and Wendt, R.L. "Preliminary Assessment of Radiation Control Coatings for Buildings," Insulation Materials: Testing and Applications, 2nd Volume, ASTM STP 1116, R.S. Graves and D.C. Wysocki, Eds., American Society for Testing and Materials, Philadelphia, 1991.
Bansal, N.K., Garg, S.N. and Kothari, S., 1992. "Effect of Exterior Surface Color on the Thermal Performance of Buildings," Building and Environment, Permagon Press, Vol. 27, No. 1, p. 31-37, Great Britain.
Givoni, B. 1976, Man, Climate and Architecture, Applied Science Publishers Ltd., London.
Givoni, B. and Hoffman, M.E., 1968, "Effect of Building Materials on Internal Temperatures," Research Report, Building Research Station, Technion Haifa, April, 1968.
Griggs, E.I, and Shipp, P.H., 1988. "The Impact of Surface Reflectance on the Thermal Performance of Roofs: An Experimental Study," ASHRAE Transactions, Vol. 94, Pt. 2, Atlanta, 1988.
Parker, D.S., Cummings, J.B., Sherwin, J.S., Stedman, T.C. and McIlvaine, J.E.R., 1993. Measured Electricity Savings from Reflective Roof Coatings Applied to Florida Residences, FSEC-CR-596-93, Florida Solar Energy Center, Cape Canaveral, FL.
Parker, D.S., Barkaszi, S.F., Sonne, J.K., 1994. Measured Cooling Energy Savings from Reflective Roof Coatings in Florida: Phase II Report, FSEC-CR-699-94, Florida Solar Energy Center, Cape Canaveral, FL.
Parker, D.S., Barkaszi, S.F., Chandra, S. and Beal, D.J., 1995. "Measured Cooling Energy Savings from Reflective Roof Coatings in Florida: Field and Laboratory Research Results," Thermal Performance of the Exterior Envelopes of Buildings VI, Clearwater, FL, December, 1995.
Parker, D.S., Sherwin, J.R., Sonne, J.K., and Barkaszi, S.F., Jr., 1996. Demonstration of Cooling Savings of Light Colored Roof Surfacing in Florida Commercial Buildings: Our Savior's School, FSEC-CR-904-96, Florida Solar Energy Center, Cocoa, FL.
Parker, D.S., Sherwin, J.R., Sonne, J.K. and Barkaszi, S.F., Jr., 1996b. "Demonstrated Savings from Light Coloured Roof Surfacing in a School," CADDET Newsletter No. 4, Centre for the Analysis and Dissemination of Demonstrated Energy Technologies, December, 1996.
Parker, D.S. and Barkaszi, S.F., 1997, "Roof Solar Reflectance and Cooling Energy Use: Field Research Results from Florida, Energy and Buildings, 25, p. 105-115, Elsevier Sequoia, Netherlands.
Reagan, J.A. and Acklam, D.M., 1979. "Solar Reflectivity of Common Building Materials and its Influences on the Roof Heat Gain of Typical Southwestern U.S. Residences," Energy and Buildings No. 2, Elsevier Sequoia, Netherlands.
Taha, H.,
Akbari, H., Rosenfeld, A.H. and Huang, J., 1988. "Residential
Cooling Loads and the Urban Heat Island--the Effects of Albedo," Building
and Environment, Vol 23, No. 4, Permagon Press, Great Britain.
1. The two shops which were resurfaced in 1996 showed only a 2.7% drop in reflectance due to degradation in the second year. They also evidenced sustained lower cooling energy consumption than that observed in the initial baseline period.
2. During the project, we learned that for successful application of refletive products to built up roofs, the gravel has to be vacuumed off and the surface then pressure washed and dried prior to applying a reflective coating. All this is a fairly expensive process which increases the cost of application to more than $2 per square foot of roof surface. This proved prohibitive with Merritt Square Mall, who were otherwise quite interested in participating in the project. See Ed Clark Roofing (eclark@iu.net).
3. During the instrumentation of the site a fairly large AC supply duct leak was located in the plenum of the Cellular phone office. However, this problem was not repaired since it is believed that this is endemic to many commercial installations and represents "real world" circumstances.
4. Product characteristics: acrylic white membrane; 10.9 lbs./gallon, 65.5% solids by weight; drying time of 2-8 hours depending on surface temperature, air temperature, relative humidity and application thickness. Spectral reflectance measurements showed an integrated solar reflectance of 85.3% (DSET Laboratories, Inc.). Benchmark product from: Conklin Co, Inc., 551 Valley Park Dr. Shakopee, MN 55379.
5.
As a conservatism, this assessment does not take into account that
operation and maintenance for AC equipment would almost certainly
be reduced since the system on-time would be lower.
For
Hashem
Akbari
Lawrence Berkeley National Laboratory
One Cyclotron Rd.
Berkeley, CA 94720
and
Florida Coordinating Group
through Florida Power & Light, Co.
PO Box 029100
Miami, FL 33102-9100
© 2007-2014 University of Central Florida. The Florida Solar Energy Center (FSEC)
is a research institute of the
University of Central Florida.
For more information about FSEC, please contact us or learn more about us.
Find us on Facebook!