

Reference Publication: Withers, C.R., J.B. Cummings, N. Moyer, P. Fairey, and B. McKendry, "Energy Savings from Repair of Uncontrolled Air Flow in Eighteen Small Commercial Buildings", ASHRAE Transactions, 1996, Vol. 102, Part 2, pp. 549-561. Disclaimer: The views and opinions expressed in this article are solely those of the authors and are not intended to represent the views and opinions of the Florida Solar Energy Center. |
Energy
Savings from Repair of Uncontrolled
Airflow in Eighteen Small Commercial Buildings
Charles
R. Withers, James B. Cummings, Neil A. Moyer,
Philip W. Fairey, and Bruce
B. McKendry
Florida
Solar Energy Center (FSEC)
FSEC-CR-1669-96
ABSTRACT
Uncontrolled airflow, including duct leakage, pressure imbalances caused by closed
interior doors, and exhaust/intake airflow imbalance, was characterized in 70
commercial buildings. In 18 of these buildings, uncontrolled airflows were repaired
and energy savings from these repairs were monitored. In most buildings the retrofit
was duct repair. In other cases, outdoor airflow was reduced and return air transfers
were provided. Cooling energy use was reduced by an average 15.1% in these 18
buildings. With an average repair cost of $455 and average cooling energy savings
of $195 per year, uncontrolled airflow retrofits proved to be very cost-effective.
Various factors indicate that greater energy savings could be achieved in the
future.
INTRODUCTION
Duct leakage has been identified as a significant source of uncontrolled airflow
in residences in various parts of the United States (Cummings et al., 1990a,
Davis, 1991, Modera, 1990, Palmiter and Bond, 1990, Parker, 1989, and Proctor
et al., 1990). Closed interior doors in houses with central returns (return grills
not provided to all rooms) have also been identified as sources of pressure imbalance
and uncontrolled airflow throughout much of the southern portions of the United
States (Cummings et al., 1989, Palmiter and Bond, 1990). Operation of exhaust
equipment (e.g., exhaust fans, clothes dryers, whole house fans, attic exhaust
fans, etc.) is also a source of depressurization and elevated infiltration in
many homes (Cummings et al., 1990b). These sources of uncontrolled airflow (UAF)
and pressure differentials found in homes have important implications for energy
use, peak electrical demand, house ventilation rates, sizing of heating and air
conditioning systems, indoor comfort, indoor relative humidity, and indoor air
quality. Duct repair programs have begun at a number utilities in Florida and
across the country. Duct repair training courses have also been developed to
train persons involved in diagnosis and repair of residential duct systems. Having
this knowledge of residential buildings, the authors suspected that uncontrolled
airflow in small commercial buildings would also be a significant problem. In
fact, because of larger building size, greater internal heat generation, greater
ventilation requirements, and larger air moving equipment, it was suspected that
commercial buildings would present greater complexity of UAFs and pressure imbalances.
To understand the nature, extent, and impacts of UAF in small commercial buildings,
field investigations in 68 buildings and energy savings monitoring in 20 buildings
(funding from the state energy office) has been completed.
PROJECT DESCRIPTION
The objectives of this project are as follows.
1. Characterize the nature, causes, and consequences of UAF.
2. Develop diagnostic procedures, test methods, and tools to accurately identify UAF in buildings.
3. Identify repair methodologies and monitor energy savings from repair of UAF.
To achieve these goals, the following tasks were done.
-Building parameters related to UAF in 70 commercial buildings were tested.
-Various means for characterizing airflows, pressure differentials, and building component airtightness were evaluated.
-Improved methods and tools for measuring airflows, pressure differentials, and building component airtightness were developed.
-Diagnostic protocols and forms throughout the project were developed and refined.
-UAF (primarily duct leakage) was repaired in 20 of the 70 buildings.
-Cooling system energy use was monitored over a single cooling season, with the retrofit done at the mid-point of the cooling season. Analysis was done to determine the energy savings which resulted from the retrofit.
DIAGNOSTIC AND TESTING PROTOCOLS
To characterize airflow dynamics in buildings, test methods and diagnostic
protocols were developed to characterize airtightness, pressure differentials,
and airflow rates in field testing. A typical protocol includes building
and duct airtightness testing, pressure differential measurement, infiltration / ventilation
tests, and airflow measurement. The objective of the testing is to characterize
airflows and pressure differentials within the building, characterize
the airflow balance across the building envelope, identify the cause of
airflow and pressure imbalances, and understand the interacting relationships
between building airtightness, airflows, pressure differentials, the operation
of building equipment, indoor air quality, ventilation, and energy consumption.
Building Airtightness Testing
The first step in the diagnostic process is building airtightness testing.
The building is prepared by turning off all air moving equipment. Outdoor
air, exhaust fans, and make-up air openings are sealed off. A multi-point
airtightness test is performed (ASTM E 779- 87, “Standard Test Method
for Determining Air Leakage Rate by Fan Pressurization”), using
calibrated fans to obtain airflow at six to eight building pressures in
the range from -0.040 inWC (-10 Pa) to -0.241 inWC (-60 Pa) depressurization.
(Note that all pressures expressed in this paper are with respect to outdoors
unless otherwise indicated). Knowing the building airtightness assists
in interpretation of other field testing.
Identification of Building Air Barriers
With the building depressurized to -0.201 inWC (-50 Pa) by the calibrated
fan, pressures in various zones of the building are measured in order
to know which portions of the building are within the building air barrier
and which are not. Consider an example; if the ceiling space is at -0.020
inWC (-5 Pa) when the occupied space is at -0.201 inWC (- 50 Pa), this
indicates that the ceiling space is reasonably well ventilated to outdoors,
and that the ceiling is the primary air barrier. (The ceiling may be the
air barrier even though the ceiling itself is quite leaky. Being the primary
air barrier simply means that it is more airtight than the ceiling space
is to outdoors.) It also indicates that the ducts, located in the ceiling
space, are in a zone that is outdoors. Therefore, it will be more important
to measure duct leakage.
Duct System Airtightness Test
Airtightness of the duct system is measured using calibrated fans (duct
test rigs or duct testers). All registers except one supply and one return
are masked off. Outdoor air is masked off. Calibrated fans are attached
to the open registers. A barrier is placed in the air handler (at the
filter, coil, or blower) to divide the system into supply and return.
Air is drawn from the duct system by the calibrated fans and a multi-
point airtightness test is done, with each side of the system at the same
pressure (duct pressure is measured near the air handler and referenced
to the zone in which the ducts are located). CFM25 (air flow through leaks
in the duct system when the ducts are at -0.100 inWC (-25 Pa)) is determined
for both the supply and the return side of the system. The combined CFM25
(add supply and return sides together) represents leakage to outdoors,
unconditioned building space, and conditioned building space, and can
be expressed as CFM 25TOTAL.
Pressure Differentials
Pressure differentials are measured in the building with the building
and HVAC systems in various modes of operation using digital micromanometers.
The basic approach is to characterize pressures in the building and various
zones of the building with air handlers and exhaust fans turned on (normal
operation) and turned off, and with various doors open and closed. The
primary objective is to characterize the effect of the air moving equipment
on building and zone pressures, since negative pressure can draw pollutants
from the soil, backdraft combustion equipment, and draw humid outdoor
air into building cavities.
Infiltration/Ventilation Rates
Using tracer gas decay methodology (ASTM E 741, “Standard Test Method
for Determining Air Leakage Rate by Tracer Dilution”), the building
infiltration/ventilation rate is measured, once with the HVAC equipment
operating and then again with the HVAC equipment turned off (if possible
or practical).
Airflow Rates
HVAC system airflow rates, including supply, return, air handler, outdoor
air, make-up, and exhaust air, are measured using a number of different
techniques, including airflow hood, hot wire anemometers, pitot tube traverse,
capture tents used with calibrated fans, and tracer gas techniques. These
latter two methods are described in greater detail in a paper submitted
for publication in ASHRAE Transactions (Cummings et. al., 1996a).
BUILDING SELECTION AND DESCRIPTION
Of a sample of sixty-eight small commercial buildings tested, 18 were
chosen to be monitored for energy savings from retrofits and have been
included in this paper. The original sixty-eight were chosen so that they
would be reasonably representative of small commercial buildings which
exist in east central Florida. The following criteria and targets for
selection of buildings were used.
-Size. We had a target size of 5000 ft2 (464.50 m2) of occupied floor space. The average size of the 68 tested buildings was 4963 ft2 (461.06 m2).
-Use. In order to achieve representation from a range of building types, general numerical targets were set for various use types. Following is a breakdown for 68 buildings: office (21), retail (10), education (9), restaurants/bars (8), assembly/recreation (8), medical offices (4)commercial lodging (2), and light
industrial/warehouse (6).
-Age. No criteria or targets were set by building age. The average building tested in this study was 22 years old.
-Location. Sixty of the 68 buildings were located in Brevard County
on the east coast of Florida. Seven were located in Orange County
(Orlando). One was located in Polk County.
Building Selection Procedure.
Buildings were found using two basic procedures -- 1) we approached
them or 2) they approached us because there was some indicated problem.
Fifty-seven of the 68 buildings were recruited by our research staff without
knowledge of any problems. Most candidates permitted testing because (we
believe) they perceived potential benefit from our testing. Toward the
end of the project, we were more selective to fill the quotas we had set
for various building types. Virtually all candidates that would permit
us to test in their building for two or three days were included in the
study. Owners of 11 of the 68 buildings that were tested had reported
energy, air quality, or other problems that we were made aware of before
we tested. The candidates for monitoring were selected out of this larger
sample of tested buildings after certain considerations, such as:
1. Does there appear to be any opportunity for energy savings?
2. Would retrofit affect the health of occupants or the building in a positive or negative way?
3. Is retrofit feasible? How much would it cost? Repair methods for some types of UAF have not yet been developed. In a number of cases, the cost of repairs would exceed what the project budget would allow.
4. Would the owner or manager be willing to be involved in a monitoring experiment?
Seven out of 68 buildings could be considered to have a much greater
potential for savings than those chosen for monitoring. These were buildings
with large exhaust fans and inadequate make-up air and the cost of repair
was more than the project budget could allow. Many of the larger group
could be considered to have less potential for savings than the monitored
group, but it is not certain how much less.
Building Descriptions
Table 1 presents information about the buildings which were repaired
and monitored. All monitored buildings were single story structures with
an average floor area of 3071 ft2 (285.3 m2). Following is explanation
for nomenclature in the table. Mas is masonry walls, Fra is
for framed walls, Man for manufactured, and Met for
metal frame and siding. Typical Occup (typical occupancy) is
different from average occupancy since these buildings experience intermittent
occupancy. It is the number of persons in the building during periods
of fairly full utilization. In a church, for example, average occupancy
for a typical week might be five persons, but during Sunday morning there
are 200 persons, and this is considered to be the typical occupancy. The
occupied volume is the conditioned volume of the building in which persons
may walk around in a normal fashion (for example, ceiling return plenums
are conditioned but are not considered part of the occupied space). Location
of the air handler and ductwork are noted as being in attic space, ceiling space, rooftop,
closet, Oc_Sp(occupied space), Ground (exterior ground mount), Ext
Wall (exterior wall mount), crawlspace, and W_House (in
an unconditioned warehouse). Duct type is noted as DB for duct
board, Flex for flexible duct, and Met for metal duct.
The type of building cavity used as a duct is also noted as either Closet,
S_Plat meaning support platform for an air handler, Mech Room meaning
mechanical room, and W_Cavity meaning wall cavity. Attic space
is considered to be the space above the ceiling that has a truss structure
which can support a person’s weight, wood roof decking, intentional
ventilation, and insulation at the attic floor level. A ceiling space
is the space above a ceiling that has no structural members that could
support a person’s weight, and may have insulation at the ceiling
or roof deck level.
One important finding of this study is that while ducts may be in an
unconditioned space, the potential energy penalties could vary due to
location of the primary air and thermal boundaries. Duct environment has
been labeled by numbers 2 through 5 to indicate what the environment is
like where the ductwork is located. Number 2 inside air and thermal barriers;
3 inside air, but outside the thermal barrier; 4 inside thermal, but outside
air barrier; and 5 outside the air and thermal barriers. The one building
with ducts inside both the air and thermal barriers, noted as a 2 was
a metal building with insulation located at the roof deck and on the suspended
ceiling panels.
Number 1 refers to the ceiling space used as part of the return plenum
and did not apply to any of the 18 monitored buildings but did apply to
the larger test group of 68.
Occupants were asked to maintain stable thermostat settings throughout
monitoring. Most sites (55.5%) raised their thermostats to about 80vF
(26.7vC) after hours and lowered them during business hours. The university
offices 1 and 3, bar and grill, educational retail, court office, safety
classes, and plastics office maintained a constant thermostat setting,
and dentist 1 turned off the air conditioners after hours.
MONITORING
Of the 18 buildings, one was monitored (and repaired) during the summer
of 1993, six during the summer of 1994, and eleven during the summer of
1995.
Variables Monitored
The following variables were monitored by datalogger: air conditioner(s)
energy use; room, ceiling space (or attic) and outdoor temperatures; air
conditioner temperatures (return and supply were recorded only when the
cooling system was operating); and indoor relative humidity. At many of
the sites carbon dioxide levels and indoor pressure differentials were
monitored, especially in tight buildings and those in which repair of
UAF would significantly reduce ventilation. Outdoor environment conditions
of dewpoint temperature and solar radiation were collected at several
central locations, generally within 15 miles of the monitored buildings.
Calibration
The monitoring equipment and sensors were calibrated in the lab before
field installation. Carbon dioxide sensors were calibrated against certified
gas mixtures. Relative humidity sensors were calibrated in environmental
chambers using chilled mirror hygrometers as the standard. T-type thermocouples
were spot checked, but in general have been found to provide accuracy
within ±O.3’F. Power meters were calibrated against a bench-top
power calibration meter.
TABLE 1 Building and HVAC Characteristics
(See “Building Descriptions” for Nomenclature)
Building |
Blg Age |
Bldg Constr |
Typical Occup |
Floor Area (ft ²) |
Occup Volume (ft ² ) |
Floor Area (m ²) |
Occup Volume (m ³) |
#AC Units |
Total AC Tons |
AH Location |
Duct Location |
Duct Encr |
Type Duct |
Bldg Cav as Duct |
| Dentist 1 | 4 |
Mas |
13 |
2754 |
24786 |
255.9 |
701.4 |
2 |
10 |
Attic |
Attic |
5 |
DB |
None |
| Health Clinic | 9 |
Fra |
10 |
2560 |
21760 |
237.8 |
615.7 |
3 |
10 |
Closet |
Attic |
5 |
Flex/DB |
Closet |
| Rec Center | 9 |
Mas |
5 |
2708 |
24776 |
251.6 |
701.1 |
2 |
9 |
Closet |
Attic |
5 |
DB/Flex |
S_Plat |
| City Hall | 27 |
Mas |
14 |
2952 |
26568 |
274.2 |
751.8 |
2 |
10 |
Roof |
Roof |
3 |
DB |
None |
| Dentist 2 | 37 |
Mas |
9 |
1512 |
12852 |
140.5 |
363.7 |
1 |
10 |
Roof |
Roof |
5 |
DB |
None |
| Univ Office 1 | 13 |
Mas |
15 |
5040 |
40320 |
468.2 |
1140.9 |
4 |
16 |
Roof |
Ceiling |
4 |
DB/Flex |
None |
| Bar & Grill | 10 |
Man |
25 |
2400 |
22800 |
223.0 |
645.2 |
2 |
8 |
Attic |
Attic |
5 |
DB |
None |
| Plastics Office | 13 |
Met |
2 |
360 |
2880 |
33.4 |
81.5 |
1 |
2 |
W_house |
W_house |
5 |
DB/Flex |
S_Plat |
| Realty Office 1 | 24 |
Mas |
8 |
1845 |
14465 |
171.4 |
409.3 |
1 |
4 |
Closet |
Attic |
3 |
DB |
S_Plat |
| Realty Office 2 | 50 |
Mas |
12 |
2142 |
20149 |
199.0 |
570.1 |
2 |
7 |
Closet |
Attic |
5 |
DB/Flex |
S_P/Closet |
| Univ Office 2 | 11 |
Man |
6 |
840 |
6300 |
78.0 |
178.3 |
1 |
3 |
Ground |
Crawl Sp |
5 |
Met/Flex |
None |
| Realty 3 | 20 |
Mas |
8 |
2635 |
21080 |
244.8 |
596.5 |
2 |
7 |
Closet |
Attic |
5 |
DB/Flex |
Closet |
| Carpet Retail | 23 |
Mas |
3 |
1584 |
17424 |
147.2 |
493.0 |
1 |
3 |
Oc_Sp |
Ceiling |
5 |
DB |
None |
| Univ Office 3 | 13 |
Man |
6 |
1320 |
10560 |
122.6 |
298.8 |
2 |
5 |
Ext Wall |
Ceiling |
5 |
DB |
W_Cavity |
| Educ Retail | 30 |
Fra/Mas |
4 |
2550 |
25500 |
236.9 |
721.6 |
1 |
7.5 |
Roof |
Ceiling |
5 |
Met |
None |
| Court Office | 30 |
Fra/Mas |
19 |
3735 |
37350 |
347.0 |
1056.9 |
2 |
11.5 |
Ceiling |
Ceiling |
3 |
Met/DB |
None |
| Safety Classes | 30 |
Fra/Mas |
35 |
2460 |
24600 |
228.5 |
696.1 |
2 |
9 |
Ceil/Roof |
Ceiling |
5 |
Met/DB |
Mech Room |
| Constr Office | 10 |
Met |
17 |
3872 |
30202 |
359.7 |
854.6 |
3 |
9 |
Closet |
Ceiling |
2 |
Met/Flex |
Closet |
| Average | 24.2 |
11.9 |
3071 |
32687 |
285.3 |
924.9 |
2.0 |
9.2 |
Data Transfer
All data were stored as 15 minute averages or sums. Data transfer occurred
through a modem with baud rate of 1200 and phone line that was installed
solely for data transfer. A central computer system called each datalogger
daily at about 6 am., and downloaded site data to disk storage. Every
data transfer was scanned for errors by comparing to prescribed boundaries.
If bad data were detected, a second attempt to download data from the
datalogger occurred. Suspect data were marked.
Computer programs were created to call each site’s datalogger, download
data, and plot up to eight graphs containing up to 20 variables every
twenty-four hours. These plots were automatically produced overnight and
then reviewed daily to see that equipment was working well and to make
note of any unusual circumstances. Such circumstances could be unusual
thermostat settings for a particular time of day, air conditioning turned
off, faulty sensor, or in a real case, Hurricane Erin’s effects
on weather station poles. When there was an indication of trouble, a site
visit would be made to repair or replace the faulty equipment.
UNCONTROLLED AIRFLOW RETROFITS
TABLE 2 Airtightness and Infiltration Rates Before and After Repair
PreRepair |
PostRepair |
|||||||||
| Building | ACH5O |
Duct CFM2S |
Duct L/s25 |
ACH0n |
ACHoff |
ACH5O |
Duct |
Duct |
ACHon |
ACHoff |
| Dentist l a | 21.4 |
846 |
399.3 |
0.75 |
0.33 |
N/A |
N/A |
N/A |
0.66 |
0.30 |
| Health Clinic a | 24.8 |
2576 |
1215.9 |
0.84 |
0.17 |
25.4 |
227 |
107.1 |
0.68 |
0.28 |
| Rec Center a | 31.5 |
788 |
371.9 |
0.71 |
0.50 |
28.8 |
154 |
72.7 |
0.70 |
0.54 |
| City Hall a | 7.4 |
1632 |
770.3 |
0.60 |
0.32 |
5.2 |
795 |
375.2 |
0.78 |
0.35 |
| Dentist 2 b | 15.2 |
396 |
186.9 |
2.75 |
0.26 |
15.2 |
396 |
186.9 |
0.30 |
0.26 |
| Univ Office l a | 24.9 |
1418 |
669.3 |
1.10 |
0.65 |
6.4 |
1418 |
669.3 |
0.69 |
0.41 |
| Bar & Grill a | 17.5 |
655 |
309.2 |
2.34 |
0.64 |
16.6 |
272 |
128.4 |
2.47 |
N/A |
| Plastics Office a | 50.0 |
186 |
87.8 |
N/A |
N/A |
46.0 |
55 |
26.0 |
1.60 |
0.76 |
| Realty Office 1 d | 93 |
571 |
269.5 |
0.20 |
0.19 |
8.4 |
112 |
52.9 |
0.33 |
0.15 |
| Realty Office 2 a | 17.5 |
1276 |
602.3 |
0.59 |
0.34 |
14.5 |
700 |
330.4 |
0.67 |
N/A |
| Univ Office 2 a | 12.2 |
251 |
118.5 |
1.28 |
0.35 |
10.7 |
138 |
65.1 |
1.11 |
N/A |
| Realty 3 a | 21.8 |
885 |
417.7 |
1.15 |
0.67 |
21.6 |
289 |
136.4 |
0.96 |
N/A |
| Carpet Retail a | 18.4 |
158 |
74.6 |
0.63 |
0.61 |
17.1 |
86 |
40.6 |
0.71 |
1.31 |
| Univ Office 3 a | 20.4 |
793 |
374.3 |
1.01 |
0.45 |
15.9 |
554 |
261.5 |
0.70 |
0.24 |
| Educ Retail a | 21.5 |
418 |
197.3 |
0.57 |
0.24 |
21.2 |
190 |
89.7 |
1.12 |
0.86 |
| Court Office a | 52.8 |
830 |
391.8 |
0.46 |
0.42 |
52.8 |
292 |
137.8 |
1.49 |
1.23 |
| Safety Classes | 26.0 |
1268 |
598.5 |
0.61 |
0.33 |
21.3 |
621 |
293.1 |
0.92 |
0.24 |
| Constr Office a | 7.0 |
1453 |
685.8 |
0.28 |
0.18 |
6.8 |
833 |
393.2 |
0.25 |
0.18 |
| Average | 22.2 |
911 |
430.0 |
0.93 |
0.39 |
19.7 |
419 |
198.2 |
0.90 |
0.51 |
| NOTE: ACH on with all air handlers on and exhaust as normally operated; ACH off is all mechanical systems off. | ||||||||||
a. Repaired by sealing duct leaks only |
||||||||||
Repair of UAF was planned for the middle of summer so that approximately
comparable weather would occur during the pre-repair and post-repair periods.
Schedule conflicts, however, and the initial lack in availability of candidates
caused monitoring starts later than anticipated for some sites. Most repairs
occurred in July and August, but three buildings were repaired in September
and two were repaired in October.
A repair plan was developed for each candidate that included what would
be repaired, what materials would be needed, and estimates of repair time.
Repair typically occurred 5 to 7 weeks after monitoring began. A team
of two to three people with considerable experience in repair of residential
duct leakage usually did repairs. In two cases, repairs were done by HVAC
contractors with the guidance of the research team. Duct leakage was located
by operating the air handler and using smoke sticks to observe air leakage
into and out of ducts. Leakage sites were also found by visual inspections
in areas inside or around the duct where access limited smoke testing.
After repairs were complete, the airtightness, pressure differential,
and airflow tests were repeated. Table 2 summarizes pre-repair and post-repair
test results. Fourteen of the retrofits were solely duct repair; one involved
reducing the amount of outdoor air; one involved tightening the building
shell and reducing outside air; one involved duct repair, replacing inefficient
cooling equipment (done independently by the building owner), and shutting
off an attic ventilation fan; and one involved duct repair and installation
of return transfers. Following is a discussion of the retrofits implemented
on these 18 buildings and some of the impacts of these retrofits. Discussion
of energy savings is deferred to the section on ‘Percent Savings
and Payback Calculation”. Table 3 contains energy savings, repair
costs, and simple payback periods.
Dentist 1
Substantial leakage existed in the ductwork. Repairs, however, were effective in sealing only about 40% of the total leakage. Return leaks were reduced from an average of 5.2% to 2.7%. Many supply leaks remain. It is clear, in retrospect, that additional effort should have been put into duct repair. Ideally, duct repair would be done with a duct test rig installed on the duct system (registers and grills masked off) so that airtightness could be periodically retested in order to gauge progress. However, in nearly all these buildings, retrofits were done during occupied hours, so the air conditioning system could not be turned off during the repairs. To optimize the repair process, it would be best to schedule these operations when the business was closed. Repairs were accomplished in eight person-hours using $50 in materials.
Health Clinic
Three air conditioning systems cooled this 2560 ft2 (237.82 m2) strip
mall space and used mechanical closets as return plenums. These closets
were depressurized to -0.048 inWC (-12 Pa), -0.133 inWC (-33 Pa), and
-0.068 inWC (-17 Pa). Because the closet ceilings were suspended t-bar
construction, they were very leaky. Return leaks of 48%, 13%, and 48%
existed in the three units. Since air being pulled into the closets was
as hot as 120’ F (48.9vC), these cooling systems were not working
well and the occupied space was often
uncomfortable. Repairs were made by installing continuous ducting from
the air handlers to the return ductwork in the attic, so that the closets
ceased to be plenums. Significant supply leaks were also repaired at register
connections. Twenty person-hours and $300 in materials were used in this
repair.
Recreation Center
The air handlers are situated on enclosed support platforms located
in closets. These plenums drew air down the closet walls because two closet
walls are also used as plenum walls, and they were not airtight. Therefore,
return air was being pulled down the walls from the space above the ceiling
and below the suspended insulation batts. Voids between insulation baits
allowed this space to become as hot as 91vF (32.8vC) when the attic space
was 118vF (47.8vC). Return leak flow was a total of 555 cfm (262.0 L/s)
from combined nine tons of air conditioning. The return support plenums
were sealed on the inside using reinforced mesh tape and mastic, and the
south zone’s transfer though the wall was sealed. Supply leaks were
sealed at some grill-to- duct connections. Eight person-hours and $50
in materials were the cost for repair.
City Hall
Most of the ductwork was located in a ceiling space that is hot and
dry because the roof deck is the primary air barrier and the insulation
is on top of the ceiling tiles. About 20% of the ductwork is located on
the roof. Substantial duct leakage existed both below and above the roof.
All of the ductwork, both return and supply, on the roof was replaced
by an HVAC contractor. Return and supply ducts within the building were
sealed by research staff. In addition to duct repair, which sealed 51%
of the total duct leakage, the duct access hole (through the roof) was
tightened, increasing building airtightness from 7.4 ACH5O to 5.2 ACH5O.
Total repair time was 16 person-hours and
$100 in materials.
Dentist 2
Unlike most of retrofits in this project, no duct repair was done.
Rather, the oversized outdoor air was downsized. When originally tested,
this roof-top package unit had no outside air damper and total outdoor
airflow was 30% of the total 3623 cfm (1710 us) air handler airflow. This
equates to about 1089 cfm (514 L/s), about 115 cfm (54.3 L/s)
per person, or 3.9 air changes per hour. With this high infiltration rate,
there was difficulty controlling humidity in the occupied space. Because
the building was thermally very inefficient, the ductwork was located
on the roof in the hot sun, and room temperature was typically 72vF (22.2v
C), the air conditioning system operated nearly 100% of business hours.
Upon being informed of our findings, the building owner/occupant requested
that the outdoor airflow be reduced. Therefore, the pre-retrofit monitoring
occurred with the outdoor air closed down to 53% of original flow, or
590 cfm (278.5 L/s). The post-retrofit monitoring occurred with this outside
air completely sealed. Before retrofit, building ventilation was 840 cfm
(396.5 L/s) or 93 cfm (43.9 L/s) per person (this is 590 cfm outdoor air
plus 250 cfm (118.0 L/s) of return leakage primarily from air handler
panel leaks). After sealing off the outdoor air, ventilation decreased
to 250 cfm (return leaks) or 28 cfm (13.2 L/s) per person and carbon dioxide
levels during business hours increased from 390 parts per million (ppm)
to 570 ppm which is within acceptable levels. A concentration of 1000
ppm is generally accepted as the level below which human comfort is maintained,
and does not indicate a health risk (ASH RAE 62-1989). According to ASHRAE
Standard 62-1989 which states 20 cfm/person is acceptable for office building
ventilation, this office building has enough ventilation. Relative humidity
decreased from an average 59% to 54% because of the retrofit. One person-
hour is figured for this retrofit and no materials.
University Office 1
The ceiling space was warm and humid because it was well ventilated
to outdoors. Vented soffit is located at the eaves on three sides of this
buildings. Only insulation batts separated this ventilated soffit space
from the ceiling space inside the building, and these batts allowed substantial
airflow. After identifying that the ceiling space was well ventilated,
it was decided that tightening the ceiling space would be more effective
than sealing the rather leaky ductwork. Though the ducts are located inside
the building thermal barrier, they are effectively outside the building
air barrier. The ceiling space was made airtight by sealing the exterior
walls above the ceiling level with fibrous ductboard, mastic, and foam.
All four package air handlers had outdoor air, with the total being 1296
cfm (611.7 L/s). It was decided that this ventilation could be reduced,
since average occupancy was only 15 persons. Outdoor air was reduced 588
cfm (277.5 L/s). In addition, panel leaks on the package air conditioners
were sealed with metal tape. Indoor relative humidity fell from an average
of 52.5% to 47.9% after repairs and the ceiling space fell from 50.0%
to 41.4%. The total time for repairs was twenty-four person-hours and
$80 in materials.
Bar and Grill
Major return leaks on both systems and moderate supply leakage at supply
register connections made this business a candidate for significant energy
savings. Monitored energy savings was a disappointing 10.6%. Savings of
30%+ could have been expected. Two factors account for this. First, duct
airtightness testing showed that only 58% of the duct leaks were sealed.
Second, and more importantly we believe, the operation of the kitchen
exhaust fan for eight to ten hours per day was drawing hot attic air into
the space. The kitchen fan exhausts 987 cfm (465.9 L/s). The building
operated at - 0.0032 inWC (-0.8 Pa)with all equipment on before repair.
After duct repair, the building pressure became -0.0080 inWC (-2.0 Pa).
(Inspections indicated that the majority of the building shell leakage
was between the occupied space and the attic, so most of the air drawn
into the building was coming from the attic. Note also that before repair,
the return leaks of 505 cfm (238.4 us) were increasing building
pressure so that the kitchen exhaust fan was not depressurizing the building
as much.) We believe that substantially greater energy savings could have
been realized if make-up air were installed in the kitchen. Alternatively,
the large leak paths between the attic and occupied space could have been
sealed. This would have reduced the amount of air drawn from the hot attic
and increased the amount drawn from the relatively cooler outdoors. This
case represents an interesting example of how energy savings can be sabotaged
when only one aspect of UAF is dealt with. Eighteen person- hours and
$75 in materials were used in repair. It is estimated that twelve person-hours
and $200 in materials could have sealed the attic plane. Installation
of a make-up air system would have cost $500 to $1000. The owner was unwilling
to pay for a make-up air system.
Plastics Office
This was the most simple yet most perplexing retrofit. While large
duct leaks were repaired, energy savings was a meager 4%. A single two-ton
air conditioner serves the small 360 square foot (33.44 square meters)
office space of this plastics manufacturing warehouse facility. The office
itself, the air handler, and the ductwork are all located inside an unconditioned
warehouse space. Significant leakage existed at the return support plenum
and filter access causing 26% of the return air to originate in this hot
warehouse. Supply leaks also exist at the supply register connections.
Total duct leakage was reduced by 70% from 186 CFM25 to 55 CFM25. The
small energy savings was a surprise. Several factors were examined to
determine why the savings were so small. The temperature drop from the
return to supply increased from 10.OvF (5.6vC) to 12.2vF (6.8vC) when
repaired. Based on this, the authors would expect at least an 18% reduction
in cooling energy use. Variations in room temperature were examined; the
thermostat setting remained constant throughout the monitoring period.
A later experiment was done to examine the impact from creating a new
return duct leak (19% return leak fraction); this increased energy used
by 2.8%. One variable which may have bearing is the extreme leakiness
of the space--ACH5O equals 50.0. This office was the second leakiest of
all sites monitored, nearly three times as leaky as the average found
in the UAF study (Cummings et al., 1996b). It may be that shell leaks
allow considerable air transported heat even when the ducts are not leaking.
An additional factor may be that since most of the shell leakage is to
the unconditioned warehouse, perhaps some of the energy lost from duct
leaks is recovered by cooling and drying the warehouse space. These were
repaired using four person-hours and $25 in materials.
Realty Office 1
This was one of the most interesting retrofit cases. An old, inefficient
(SEER of 6.0) four-ton air conditioner served this 1845 ft2 (17 1.40 m2)
building. Very leaky ducts are located in the attic space, which has only
two small eave vents. An exhaust fan draws air from the attic throughout
the day, depressurizing the attic space to -0.0643 inWC (-16.0 Pa) and
the occupied space to -0.0627 inWC (-15.6 Pa). Retrofits to this building
were completed in three phases. The first retrofit was repairing duct
leaks. Severe supply duct leaks were caused by failure of metal tape adhesive.
No significant leakage existed on the return side. CFM25 in the ducts
decreased by 80% from 571 to 112. Energy consumption dropped by 31% with
this repair. The second retrofit was replacement of the air conditioner
by a 12 SEER unit. (This replacement was done entirely at the initiative
and expense [$2800] of the owner.) Energy consumption dropped by an additional
50.4%. The third retrofit was turning off the attic exhaust fan. Energy
consumption decreased by an additional 36%. In total, the three retrofits
cut cooling energy consumption by 74%.
The following changes occurred when the attic exhaust fan was turned
off. Building pressure decreased from -0.0643 inWC (-16.0 Pa) to -0.0016
inWC (-0.4 Pa). The building ventilation rate decreased from 0.79 ach
to 0.24 ach. The peak carbon dioxide concentration increased from an average
620 ppm to 1150 ppm during weekday hours of 2 to 4 p.m.. This indicates
that this office may need additional ventilation, however the occupants
commented that they were comfortable after the attic fan was turned off.
Duct repairs required six person-hours and $30 in materials.
Realty Office 2
Considerable return leaks drew air from the attic into the air handler.
(Note: because of considerable rodent infestation in the attic, the insulation
was soiled and compressed, and contributed to indoor air quality complaints.)
One of the plenums had two transfers through the wall and one located
inside the closet. In turn, the closet door had a transfer to allow air
into the closet. Since it was undersized, this caused the mechanical closet
to be substantially depressurized. The second plenum had one transfer
through a wall and some leakage through a hole in the wood floor over
a small crawlspace. Unsealed return transfers in the closet walls allowed
hot attic air to be drawn from the attic. Supply leakage was minor and
due to time constraints was not repaired (these repairs were completed
at 1 a.m.). Leakage in the closet was also not repaired. Post repair testing
showed that only 45% of the duct leakage had been sealed. Return leak
fractions decreased from 10.5% to 52% on the west system and from 21.6%
to 5.6% on the east system. Overall return leakage decreased by 66%. Repairs
were done in four person-hours and with $25 in materials.
University Office 2
Duct repairs were made to the main return duct at the air handler and
the floor register, and to supply register connections in the floor. This
was a relatively simple repair involving five hours of repair and $10
in materials. As a result of these repairs, duct CFM25 decreased by
45% from 251 to 138. Infiltration with the air handler operating decreased
from 1.28 ach to 1.11 ach. Some package air conditioner panel leaks could
not be sealed.
Realty Office 3
The air handlers are located in closets which act as return plenums.
The east closet was depressurized to -0.076 inWC (-19 Pa) and the west
closet to -0.064 inWC (-16 Pa), but only when the closet doors were closed.
The east closet door was closed at all times thereby causing substantial
return leaks. The west closet door was open all the time, so there was
no return leakage into that mechanical closet. Repairs were achieved primarily
by tightening the ceiling and walls of the east mechanical closet. Some
supply leaks were repaired. Duct leakage declined from 885 CFM25 to 289
CFM25. Total repair time was 12 person-hours and $75 in materials.
Carpet Retail
The air handler and return were completely within the conditioned space.
Moderate supply leaks existed. This site was chosen even though the potential
for savings was not expected to be great. Only supply grill connections
and one elbow seam were repaired. Cooling energy savings were 12%. Repairs
were completed in one person- hour using only $8 in materials.
University Office 3
Part of the exterior wall cavity is used for return air for both air
conditioning systems. Supply ducts were located in the small space between
the ceiling and roof deck. Return leakage was repaired in the wall cavity
and at the duct board connections at the air handler. Since access to
supply leakage was available only at the supply registers, only leaks
accessible through the registers were repaired. Only 30% of the total
duct leakage (as seen by the duct test rig) was repaired. As a consequence,
energy savings was only 4%. Greater savings would be expected if the ductwork
was more accessible. The repair was completed in two person-hours and
with $25 in materials.
Educational Retail
This store and the next two businesses to be discussed are part of
a strip mall. Supply leaks through the panel connections and panel knockouts
were sealed on the air handler. Large return leaks were sealed by squeezing
one person into the air handler on the return side and coating the interior
ductboard with mastic. Some difficulties were experienced in gaining access
to the remaining duct leakage. Supply side ductwork was metal wrapped
with insulation, and access to the ceiling space requires standing on
a ladder and moving the ladder from one ceiling tile location to another.
The ceiling tiles have insulation batts and dust on them. The process
of inspecting and repairing the remaining supply ducts would have been
difficult, time consuming, and disruptive to business. Repairs to this
system decreased CFM25 by 5S% from 418 to 190. The repairs that were done
to this site were completed in 2.5 person-hours and with $30 in materials.
Court Office
Sixty-five percent of total leakage in this leaky duct system was sealed.
Repairs were made to the return ducts at the grill connections and the
east system return was sealed by coating the interior of the ductboard
with mastic. The suspended ceiling had not been hung very securely, and
over time the panels began to sag. As a result the supply grills pulled
away from the ducts in some locations. The supply grill to duct connections
were repaired, but there was leakage left unsealed. Similar to the educational
retail, the supply ducts were metal with wrapped insulation, and the same
problems existed to locate and repair the remaining duct leakage. Even
though 65% of the duct leakage was repaired, monitored energy savings
was -6.6 % indicating that air conditioning energy increased after repair!
In retrospect we have tried to determine why energy use would increase.
The one factor that holds some promise is leakiness of the building shell.
This office is the leakiest of the seventy buildings tested and has an
ACH5O of 52.8. It may be that because the very leaky ceiling and vented
roof deck allows wind to move air across it, air exchange may not change
significantly as a result of duct repair. Note that the plastics office,
which showed an unexpectedly small savings of 4% also had a very leaky
building shell (ACH5O= 50.0). It may be that leaky buildings will not
yield significant duct repair energy savings. More research is required
to answer that question. Repairs were completed in four person-hours using
$25 in materials.
Safety Classroom
This space had some of the worst uncontrolled airflows of the entire
sample, yet repairs produced only modest savings. Following is a brief
list of the failures.
-For outdoor air, a grill had been installed in the return duct located in the unconditioned ceiling space. It was drawing 750 cfm (354.0 us) of hot air into the return.
-There were other substantial duct leaks, including a 1 inch by 30 inch (25.4 mm by 762 mm) leak at the air handler to main supply trunk duct connection which was drawing air into that leak!
-Closed doors caused major pressure and flow imbalances since the returns were located in the spaces where none of the supplies were located. The return for one system was located in a closet located between the two main classrooms. It was depressurized to -0052 inWC (-13 Pa) and drew considerable air from the unconditioned ceiling space through the t-bar ceiling.
-Each of the air conditioners served both classrooms, causing virtually identical cooling energy use whether one or both classrooms was in use. One thermostat was located in one of the two classrooms while the other thermostat was located in the hallway, a space that has no supply registers.
Repairs included sealing 51% of the massive duct leaks, installing return
transfer grills, moving one of the return grills so that it drew more
of its air from a classroom, installing additional return transfer grill
area in the closet, airtightening the t-bar ceiling in the depressurized
closet, and moving the thermostat from the hall to a classroom. Surprisingly,
energy savings were only 17% when we could easily have expected 50% reduction.
After repair, and specifically after moving the thermostats, cooling system
run time was dramatically shifted from the west unit (thermostat in the
hall) to the less efficient east unit, which may explain the shortfall
in savings. Repairs were completed using eight person-hours and $60 in
materials.
Construction Office
Ceiling insulation is located both on top of the ceiling tiles and
on the bottom of the sloped metal deck above. Some moderate sized supply
leaks existed. The large duct leaks, however, occurred because the mechanical
room for one of the systems was used as a return plenum, and the ceiling
of that room is suspended V-bar. Of the total 1453 CFM25 leakage in the
two duct systems, 49% was through the ceiling of that mechanical room.
Repairs consisted of repairing one major supply leak, sealing return
ducts, airtightening the t-bar ceiling in the mechanical room, and reducing
the mechanical room pressure from -0.0767 inWC (-19.1 Pa) to -0.0169 inWC
(-4.2 Pa) by installing a louvered door in place of the solid door. Return
leak fraction for the mechanical room decreased from 28% to 4% as a result.
Considering this large reduction in return leak flow, energy savings of
25% or more might be expected. The resulting energy savings, however,
are only 11%. The reason, the authors believe, is that the ceiling space
is relatively cool and dry because it is inside both the air barrier and
one of the two thermal barriers. That is, this building was saved from
the full effects of UAF by locating a second thermal barrier at the roof
deck. Repairs were made using five person-hours and $90 in materials.
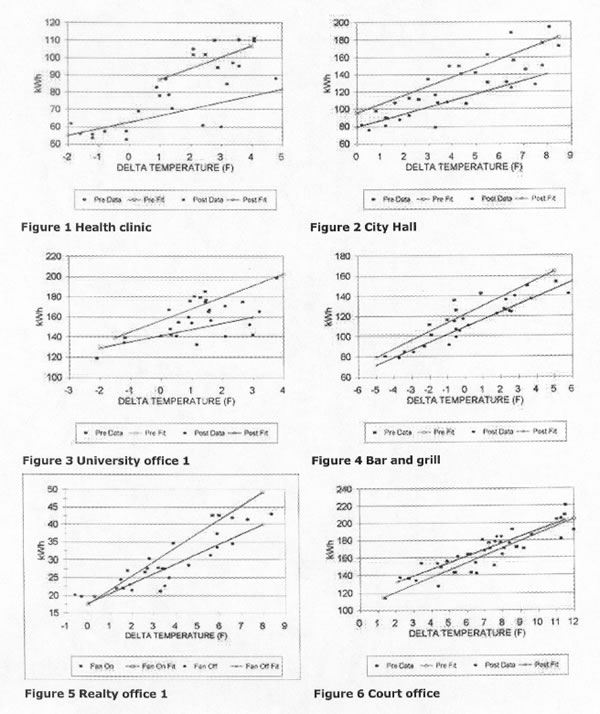
ENERGY SAVINGS ANALYSIS
Energy savings that accrue from the repair of UAF are determined by
comparing air conditioning energy consumption for periods before and after
repair. In order to filter out variations caused by changes in weather
and by changes in indoor temperature, the kilowatt-hours of cooling energy
consumption are plotted against the temperature difference between indoors
and outdoors. The best-fit lines on the plots are produced by least-squares
linear regression. The graphs for 6 buildings are shown in figures 1 through
6. Figure 5 shows only the air conditioning energy used before and after
turning the attic fan off at realty office 1.
When comparing the energy used before and after repair, all data was
examined to make sure the most comparable days were used for each graph.
Comparable data included solar radiation, indoor and outdoor temperatures,
and windspeed. The graphs of all but four of the buildings represent only
the weekdays. Weekends were excluded in most graphs because of increased
varia bility in business hours. The analysis for the university office
1, bar and grill, educational retail, plastics plant, and classroom graphs
uses all days. Days with unusual operation of cooling system or weather
conditions that were not common to both periods were not used in the data
analysis. An example of unusual operation would be if the thermostat was
not raised to its typical after-hours setting or if the air conditioner
was turned off for a period during the day.
With no control over weather conditions and, in some cases, relatively
limited time for monitoring, some sites have less data than desired. While
ambient temperature usually means outdoors, in some cases the space is
located inside an unconditioned warehouse. In the plastics office, for
example, energy use shows better correlation to the warehouse minus office
space temperature difference. Attic space temperature can have important
impacts on building cooling load, especially when poor insulation or air
transfer heat to the building. The realty office 2, for example, showed
better correlation to attic temperature and outside temperature. This
attic had very little insulation. In these cases, warehouse or attic temperature
was used to plot the data and calculate the energy savings.
Percent Savings and Payback Calculation
Seasonal energy savings is calculated in the following manner. The
least-squares, best fit lines (energy use vs temperature differential)
are used in conjunction with 10 year meteorological data from FSEC weather
station to calculate the expected cooling energy use. The 10- year average
daily outside temperature and the average indoor business temperature
was used to calculate cooling energy use for each day during a typical
cooling season. Since monitoring took place primarily during the six warmest
months of the cooling season, percent savings is based on a six month
period starting May 1 and ending October 31. Daily energy use was summed
over the entire six month period and divided by 184, the number of days
in this period. Percent savings is calculated by dividing the difference
between pre-repair and post-repair energy use divided by the pre-repair
energy use.
TABLE 3 energy Savings and Effectiveness of UAF Repair
| Building | Pre kwh/Day |
Post kwh/Day |
% Energy Savings |
Total kWh @ $0075 |
Repair Cost($) |
Simple Payback “years” |
|
| 8 Month kWh Saved | 8 Month $ Saved |
||||||
| Dentist 1a | 54.0 |
39.9 |
26.1 |
2251 |
169 |
450 |
2.7 |
| Health Clinica | 96.7 |
72.0 |
25.6 |
4448 |
334 |
1300 |
3.9 |
| Rec Centera | 77.3 |
63.9 |
17.4 |
2779 |
208 |
450 |
2.2 |
| City Halla | 137.4 |
109.9 |
20.0 |
4689 |
352 |
900 |
2.6 |
| Dentist 2b | 88.4 |
74.1 |
16.2 |
3557 |
267 |
50 |
0.2 |
| Univ Office 1c | 211.2 |
170.5 |
19.3 |
7620 |
571 |
1280 |
2.2 |
| Bar & Grilla | 142.4 |
127.3 |
10.6 |
3129 |
235 |
975 |
4.2 |
| Plastics Officea | 22.8 |
21.8 |
4.4 |
260 |
19 |
225 |
11.5 |
| Realty iDuctd | 99.6 |
69.1 |
30.7 |
5938 |
445 |
330 |
0.7 |
| Realty iFand | 39.8 |
25.4 |
36.0 |
3208 |
241 |
50 |
0.2 |
| Realty Office 2a | 117.7 |
108.9 |
7.5 |
1551 |
116 |
235 |
2.0 |
| Univ Office 2a | 31.4 |
26.9 |
14.3 |
732 |
55 |
260 |
4.7 |
| Realty 3a | 61.9 |
53.4 |
13.7 |
1854 |
139 |
675 |
4.9 |
| Carpet Retaila | 21.7 |
19.1 |
11.9 |
511 |
38 |
58 |
1.5 |
| Univ Office 3a | 70.7 |
67.6 |
4.3 |
521 |
39 |
225 |
5.8 |
| Educ Retaila | 69.7 |
64.8 |
6.9 |
855 |
64 |
155 |
2.4 |
| Court Officea | 137.8 |
147.0 |
-6.7 |
-2762 |
-207 |
225 |
|
| Safety Classese | 50.8 |
42.1 |
17.0 |
2496 |
187 |
460 |
2.5 |
| Constr Officea | 87.2 |
77.8 |
10.8 |
2041 |
153 |
340 |
2.2 |
| Average | 85.2 |
72.7 |
15.1 |
2404 |
180 |
455 |
3.1 |
a. Repaired by sealing duct leaKs only |
|||||||
Uncontrolled airflow repair cost-effectiveness analysis
is based on an eight month period from mid March to mid November because
it is reasonable to expect additional savings from retrofits even after
the six month cooling season in central Florida. Using the same calculation
for energy used each day, the total cooling energy saved was calculated
for the eight month period. Since a majority of the buildings (14) operate
only five or six days a week, the energy used during nonbusiness days
for these buildings is less. The observed cooling energy use on non-business
days was lower than typical business days, primarily because of higher
thermostat settings, by an average 41.7 percent. Therefore, the calculated
cooling energy use for non-business days was reduced by 41.7 percent (since
the linear equations are based on business days only).
Some businesses pay only for kWh of electricity consumed. Others pay
demand charges. In order to simplify the analysis, we have assumed a cost
of $O.075 per kWh. Simple payback was calculated by dividing the estimated
repair cost by the eight month energy cost savings. The results are shown
in Table 3. Energy savings for realty office 1 are broken down into the
two UAF- related retrofits. “Realty 1 duct” is savings from
duct repair only (3.1 kWh/day) and “Realty 1 fan” is savings
from turning off the attic exhaust fan motor. The 14.3 kWh/day saved breaks
down to 11.2 kWh/day consumed by fan motor and 31 kWh/day saved from reduction
in air conditioning.
Discussion of Savings
Energy savings were found in 17 of 18 buildings in which repair of
UAF occurred. Savings ranged from -6.7% to 36%. On the average, air conditioning
energy use was reduced by 15.1%. Daily kWh savings averaged 12.5 kWh.
At 75 cents/kWh this equates to $0.94/day savings over a six- month period.
While 15.1% savings is substantial, it is the authors opinion that
greater energy savings are available. In retrospect we see that only 54%
of the duct system leaks were sealed. While these were often the ones
experiencing the greatest pressure differentials and may have been in
the most harsh environments, they therefore may represent more than 54%
of the total duct leak airflow and energy impacts. Given another opportunity
and greater resources, greater savings would no doubt be achievable. There
are several reasons why we believe that considerably more savings can
be achieved.
1. Some repairs were limited by time and money available in the project budget.
2. Retesting the same day as repairs were done put additional demands on time available for repairs. Priority was given to the largest leaks that could be accessed.
3. Business owners are sensitive to interference with the normal operation of their employees or their customers. Therefore, there were significant restrictions on how much time we could turn off systems to install duct test rigs (used to check to see how much repair has been accomplished).
4. In buildings that have suspended ceilings, repairs are generally done by lifting ceiling tiles. The process of finding the leaks and then making the repairs is made more complicated by the need to move ladders incrementally around the room while avoiding furniture and people. Scheduling repairs outside of business hours is the best way to avoid these problems.
5. Additional savings may also be available with repair technologies which have not yet been developed. A prime example is very leaky ceiling planes in many commercial buildings. When methods are developed to either airtighten suspended ceilings or move the air barrier to another building plane (preferably where the thermal barrier is located), then considerably more savings will result.
6. Project staff were early on the learning curve about diagnosis and repair of UAF. In several cases, the repair done was incomplete because there was incomplete understanding of the interacting relationships between duct repair and exhaust fans and duct repair and very leaky building shells. The authors now understand some of these complex interacting impacts and can prescribe (and train for) improved retrofits.
While 15.1% cooling energy savings is less than the 17.2%
cooling energy savings which was found in residential duct repair (also
in central Florida), that 15.1% is of a somewhat greater cooling energy
use intensity than exists in homes. In 48 residences, pre-repair cooling
energy consumption was 40.6 kWh/day, or 24.6 kWh/day per 1000 ft2 (Cummings
et al. 1990a). By comparison, in these 18 commercial buildings, pre-repair
cooling energy consumption was 85.2 kWh/day, or 27.7 kWh/day per 1000
ft2. From a utility system demand point of view, the commercial buildings
cooling energy consumption is focused more intensely on daytime periods
of weekdays, which is also the time when most utilities experience peak
demand. Therefore, programs that repair UAF in commercial buildings should
provide significant benefit to demand management.
If more of the duct leakage had been repaired and more complete addressing
of the exhaust fan and building leakage had occurred, then savings would
have been considerably greater. If it is assumed that 75% of duct leaks
can be repaired, and that repair technologies for providing make-up air
and airtightening buildings are developed, then we project that about
25% annual cooling energy savings could be realized.
CONCLUSIONS
Commercial buildings are, on average, very leaky. Some are very airtight.
Others are very loose. The largest single factor is “How tight or
loose is the space above the ceiling?”. Ducts in commercial buildings
are leaky. On average they are considerably more leaky than those in residences.
However, the energy penalties associated with these duct leaks are somewhat
smaller than might be expected because the ducts are more often located
inside either the building air barrier or the thermal barrier, or both.
Therefore, a greater portion of the energy lost by duct leaks is recovered
in commercial buildings compared to Florida residences (where most of
the ducts are located in attics).
Nevertheless, considerable opportunities for energy savings exists.
In 18 buildings, repair of uncontrolled airflow resulted in cooling energy
savings of 15.1%. The average cost of repair was $455, including labor
and materials. Energy savings pay for the average repair in 3.1 years.
Therefore, from the customer’s point of view, repair of UAF is attractive,
and can be considered a very attractive investment.
From a utility perspective, repair of UAF should be even more attractive,
since the energy savings occur primarily during daylight hours on weekdays.
Consequently, it is anticipated, though the analysis has not been done,
that peak demand reduction should be greater than 15.1%.
Repair of UAF in commercial buildings is more complicated than in residential
buildings. Knowing what to repair requires specialized equipment and diagnostic
methods and tools as well as an understanding of how the building and
its occupants will be effected after repairs. The dentist 2 and university
1 offices benefited from eliminating excess outside air, but this reduction
in building ventilation was carried out only after the effects on occupants
and the building were considered.
The presence of large exhaust fans in some commercial buildings creates
the potential for large and complex impacts on building pressure, ventilation,
moisture problems, and energy consumption. Successful repair requires
successful diagnosis. Successful diagnosis requires understanding of building
airflow physics, diagnostic methods, diagnostic tools, and experience,
just as a doctor requires understanding of human biology, diagnostic methods,
diagnostic tools, and experience. Restaurants are an example of commercial
buildings with multiple sources of UAF. As was seen with the restaurant/bar,
all sources of UAF must be considered or the realized savings may be severely
diminished. The realty office 1 illustrates the potential for savings
in buildings where all sources of UAF are considered and a large percentage
of duct leaks are repaired.
REFERENCES
ASHRAE. 1989. ASHRAE Standard 62-1 989, Ventilation forAcceptable
Indoor Air Quality. Atlanta: American Society of Heating, Refrigerating
and Air-Conditioning Engineers, Inc.
ASTM. 1983. ASTM Standard E741-83, Standard test method for determining
air leakage rate by tracer dilution. American Society for Testing
and Materials
ASTM. 1987. ASTM Standard E779-87, Standard test method for determining
air leakage rate by fan pressurization. American Society for Testing
and Materials
Cummings, J.B., and J.J.Tooley, J.J. June, 1989. Infiltration rates
and pressure differences in Florida homes caused by closed interior doors
when the central air handler is on. Proceedings of American Solar
Energy Society 14th National Passive Solar Conference. Denver,
CO.
Cummings, J.B., J.J. Tooley, N.A. Moyer, and R. Dunsmore. 1990a. Impacts
of duct leakage on infiltration rates, space conditioning energy use,
and peak electrical demand in Florida homes. Proceedings of the ACEEE
1990 Summer Study. Pacific Grove, CA.
Cummings, J.B, J.J.Tooley, and N. Moyer. 1990b. Radon Pressure differential
Project, Phase 1. FSEC-CR-344-90. Cape Canaveral, FL. Florida
Solar Energy Center,
Cummings, J.B., C. Withers, N. Moyer, P. Fairey, and B. McKendry. 1996a.
Field Measurement of Uncontrolled Airflow and Depressurization in Restaurants. ASHRAE
Transactions 102(2). Submitted for publication in ASHRAE Transactions.
Florida Solar Energy Center, Cape Canaveral, FL.
Cummings, J.B., C. Withers, N. Moyer, P. Fairey, and B. McKendry. 1996b.
Final Report, Study of Uncontrolled Air Flow in Non-Residential Buildings.
Cocoa, FL: Florida Solar Energy Center.
Davis, Bruce E. 1991. The impact of air distribution system leakage
on heating energy consumption in Arkansas homes. Report submitted to the
Arkansas Energy Office.
Modera, M.P. 1990. Residential duct system leakage; magnitude, impacts,
and potential for reduction. ASHRAE Transactions. 95(2). Palmiter,
L., and T. Bond, 1990. Modeled and measured infiltration; A detailed case
study of four electrically heated homes. Prepared for Electric Power Research
Institute Under Contract RP 2034-40. Parker, D.S. 1989. Evidence of increased
levels of space heat consumption and air leakage associated with forced
air heating systems in houses in the Pacific Northwest. ASHRAE Transactions. 95(2).
Proctor, J., B. Davids, F. Jablonski, and G. Peterson. 1990.Pacific
Gas and Electric Heat Pump Efficiency and Super Weatherization Pilot Project.
Building Resources Management Co.
© 2007-2014 University of Central Florida. The Florida Solar Energy Center (FSEC)
is a research institute of the
University of Central Florida.
For more information about FSEC, please contact us or learn more about us.
Find us on Facebook!