

Reference Publication: Cummings, J., Withers, C., Gu, L., McIlvaine J., Fairey, P., and Lombardi, M. "Field Testing and Computer Modeling to Characterize the Energy Impacts of Air Handler Leakage," FSEC-CR-1357-02 Disclaimer: The views and opinions expressed in this article are solely those of the authors and are not intended to represent the views and opinions of the Florida Solar Energy Center. |
Field
Testing and Computer Modeling to Characterize
the Energy Impacts of Air
Handler Leakage
James
B. Cummings, Charles Withers, Dr.
Lixing Gu,
Janet McIlvaine, Jeff
Sonne, Philip Fairey,
and Matt Lombardi
Florida
Solar Energy Center (FSEC)
FSEC-CR-1357-02
1.0
Project Background
In order to determine the impact of air handler location upon heating
and cooling energy use, the amount of air leakage which occurs in the
air handler cabinet needs to be known. Also, the leakage which occurs
at the connections between the air handler cabinet and the return and
supply plenums needs to be known as well because these connection leaks
would also be located in the attic or any other location.
In order to assess this leakage, testing was performed on a total of 69 air conditioning systems. Thirty systems were tested in the year 2001 under funding from the Florida Department of Community Affairs. Twenty-nine additional systems were tested in 2002 also under funding from the Florida Department of Community Affairs. Ten additional systems were tested in 2002 under funding from the Brookhaven National Laboratory.
In each case, air leakage (Q25) at the air handler and two adjacent connections was measured. Q25 is the amount of air leakage which occurs when the ductwork or air handler (or any enclosed space) is placed under 25 pascals of pressure with respect to its surrounding environment. Q25 can also be considered a measurement of hole size. In order to obtain actual air leakage as the system is actually operated, it is necessary to also measure the operating pressure differential between inside and outside the air handler and adjacent connections. In other words, it is necessary to know the hole size and the pressure differential operating across that hole. By knowing both Q25 and operational pressure differentials, actual air leakage into or out of the system can be calculated. Throughout this report, the airtightness testing which has been performed is "total" (that is, leakage to both indoors and to outdoors). The only exception is during testing of the entire duct system in 20 of the 69 homes, both Q25,out and Q25,total were measured (see section 6.0).
A total of 69 air handlers have been tested, with a sample of 23 units in the attic, 23 units in the garage, and 23 units indoors.
2.0 Select a Sample of Homes
The 69 systems were tested in 63 houses (in six cases, two air handlers were tested in a single house), all located in Florida. Four were in Leon County in or near Tallahassee, 17 were in Polk County, 3 were in Lake County, 13 were in Orange County, 1 was in Osceola County, 2 were in Sumter County, and 29 were in Brevard County. All except those in Leon County are located in central Florida. In general, we avoided selecting more than four houses from one builder or air conditioning contractor. All houses were constructed (completed) after January 1, 2001, and most were tested within four months of occupancy. Houses were obtained in the following manner.
Most homes were obtained as follows. Florida Energy Code 600A forms were obtained for a large sample of houses completed since January 1, 2001. This typically involved traveling to the building department for a county or municipality, and copying forms for houses. In general, houses were selected randomly, in most cases selecting every fifth house contained in the building department files until a sufficient sample had been collected. Table 1 summarizes the results of the selection process for the 30 houses of Phase 1. The process for Phase 2 was similar.
Jurisdiction |
size of larger sample | sample breakdown (garage/house/attic) | houses tested (garage/house/attic) |
Orange
County |
105 |
77
/ 35 / 3 |
6
/ 4 / 0 |
Brevard
County |
55 |
35
/ 35 / 5 |
5
/ 5 / 1 |
Polk
County |
NA1 |
NA1 |
0
/ 0 / 9 |
Lake
County |
26 |
15
/ 11 / 0 |
0
/ 0 / 0 |
Polk County building department staff were unable to assist us at this time because of staff availability.
Several problems arose in the search for test houses. While houses with air handlers in the garage were easy to find, air handlers in the house were more difficult to find, and air handlers in the attic were much more difficult to find. In Phase 1, for example, of 186 houses in Orange, Brevard, and Lake Counties combined, only eight were located in the attic. Of those eight, we were able to gain access to only one for testing. In order to find a sufficient sample of attic air handlers, we targeted Polk County and Marion counties where air handlers are more commonly installed in that location. In addition, we directly contacted builders and air conditioning contractors in Polk County. Of 23 attic units, 17 were tested in Polk County and 4 in Leon County.
Another problem arose with the data obtained from the visit to the Orange County building inspections department, namely that the homeowner name was not available on the 600A forms. We did not feel that sending letters to homeowners addressed to "homeowner" would yield a successful response rate. After investigating several options, it was discovered that homeowner names could be obtained for most properties through tax appraiser records by means of the internet.
It was also intended that a total of 12 gas furnaces would be tested, 4 for each air handler location. However, furnaces were readily found in garages but seldom in attics or indoors. In the end, we tested a total of 9 furnaces; 6 in the garage, 2 indoors, and 1 in the attic. Since we found that furnaces were, on average, considerably more leaky than electric air handlers (heat pumps and straight cool), we decided to test no more than 6 units in the garage so that the sample of garage air handlers would not be too heavily weighted toward gas furnace leakage.
3.0 Training Field Testers
Staff training was carried out during this project. Chuck Withers headed up the field testing effort, and also the training of other project staff members, including Jeff Sonne (Senior Research Engineer), Janet McIlvaine (Research Analyst), and Matt Lombardi (student assistant). This training consisted of "on the job" training by means of demonstration and tutoring of various test methods.
4.0 Develop a Low Air Flow Measurement Device
A low air flow measurement device was designed and constructed to allow measurement of air handler airtightness below 30 Q25, since 30 cfm is the low-end threshold measurement accuracy of the Energy Conservatory Duct Blaster. The low-flow device consists of two Dwyer Series RM flow meters (model number RMC-123 with valve) operating in parallel. Each of these rotometers (column with floating metal ball) has a range from 0 to 30 cfm. Therefore, the low-flow device can measure air flow rates from 0 to 60 cfm. These meters are connected to a vacuum cleaner. The vacuum cleaner currently being used provides sufficient flow to measure up to 31 cfm. Valves on the flow meters allow regulation of flow. An adjustable slide opening on the vacuum hose also allows adjustment of the vacuum cleaner air flow rate.
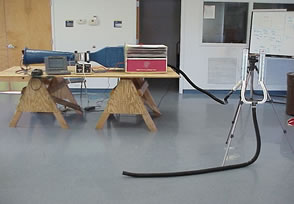
The low flow measurement device was calibrated (Figure 1). The air flow rate through the low flow device agreed to within 2% compared to a TSI Wind Tunnel.
 |
 |
Figure
1. Calibration of Dwyer flow meters using TSI Wind Tunnel model 8390. |
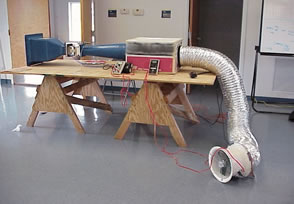
Figure
2. Calibration of Duct Blaster at flow < 30 cfm using TSI Wind Tunnel. |
The Duct Blaster was also calibrated for air flows below 30 cfm. The accuracy of the Energy Conservatory Duct Blaster was assessed for air flows between 10 and 38 cfm by operating the Duct Blaster in series with the TSI Wind Tunnel (Figure 2). Throughout this range of air flows, the Duct Blaster reads very nearly 2 cfm lower than TSI Wind Tunnel for all air flows. Therefore, we have been able to use the Duct Blaster, with a 2 cfm offset, for measurements down to 10 cfm. Calibration results for the low air flow measurement device and the Duct Blaster are shown in Figures 3 and 4.
 |
 |
Figure
3. The average offset is 1.9 cfm for the Duct Blaster |
Figure
4. Y= 1.007 * X + 0.085; R^2= 0.9998 |
Because the Duct Blaster could be used down to 10 cfm, nearly all testing could be performed without the need for the low air flow measurement device.
5.0 Field Testing for Air Handler Leakage
Testing was performed on 69 air conditioning systems to determine the extent of air leakage from air handlers and adjacent connections. Testing and inspection was performed in the selected houses to obtain the following information:
-
Q25 in the air handler, Q25 at the connection to the return plenum, and Q25 at the connection to the supply plenum (Q25 is the air flow rate through leak sites when exposed to a 25 pascal pressure differential).
-
Operating pressure at four locations - at the return plenum connection, in the air handler before the coil, in the air handler after the coil, and at the supply plenum connection. An estimate was made of what portion of the AH is above and below the coil, based on visual inspection within the air handler cabinet.
-
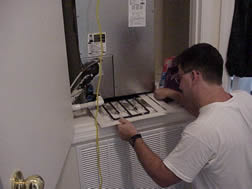
Return and supply air flows were measured by means of a flow hood. Air handler flow rates were measured by means of an air handler flow plate device (per ASHRAE Standard 152P methodology). The calibrated flow plate device (manufactured by the Energy Conservatory) is inserted into the filter access tray of the air handler (Figures 5 and 6). A manometer measures the pressure differential produced by the air velocity moving across the orifices of the flow device. This pressure differential is converted to an air flow rate for the specific flow plate used. Since the flow plate creates resistance to air flow and therefore modifies the normal air flow rate, a correction factor is used. This correction factor involves measuring the supply plenum pressure once with the plate in place and once with the air handler in its normal operating mode.
-
Overall duct system and house airtightness was measured in 20 of the 69 homes.
-
Cooling and heating system capacity was determined (ARI directory look-up) based on AH and outdoor unit model numbers.
-
The location and type of filter was recorded. (15 filters were located in the air handler, one was located in the return duct, and 53 were at the return grill(s). Filters for 22 attic units were located at the grill; one was in the air handler.)
-
The dimensions and the surface area of the air handler cabinet were measured and recorded. (Average air handler surface area was 30.7 square feet.) The average cooling system capacity was 38,000 Btu/hr. On average, there were 1.74 tons of cooling per 1000 square feet of floor area.
-
The fraction of the air handler under negative pressure and under positive pressure was determined by visual observation within the air handler cabinet. (On average, 13.8% of the air handler cabinet was under positive pressure and 86.2% was under negative pressure. Nearly all of the positive pressure portions of air handlers were found in gas furnaces.)
-
The types of sealants used at AH connections were recorded.
-
An estimate was made of the fraction of the initial air handler leak area that are sealed "as found". (37 of the 69 air handlers had some measure of sealing in evidence. On average, 15.8% of the leakage in the 69 air handlers had been sealed, based on our visual observation. Eight air handlers had 50% or more sealed. In one case, 90% had been sealed.)
Figure
5. Air flow plate being inserted. |
Figure
6. Air flow plate can be seen in place with the air handler panel removed. |
 |
 |
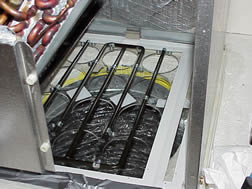
Figure
7. Supply plenum is cut to allow an air barrier to be inserted. |
Figure
8. Rigid plastic barrier is inserted into supply duct. |
 |
 |
Figure
9. Supply barrier in place and sealed with tape. |
Figure
10. Flexduct supply plenum that cannot be cut. |
5.1 Method for Determining Leakage (Q25)
The following test method was used for determining Q25 in the AH and at adjacent connections:
-
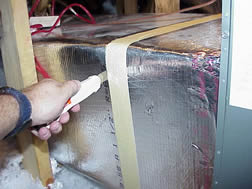
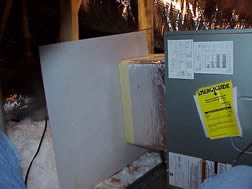
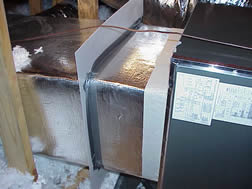
A portion of the air distribution system (ADS) containing the air handler was isolated. Typically this involved cutting through the main supply plenum (Figure 7), placing an air barrier through the supply plenum (Figure 8), and then sealing this air barrier to the exterior surface of the supply plenum (Figure 9). In a number of homes, it was not possible to cut through the supply plenum either because there was insufficient length of plenum before branch ducts or because the supply plenum was a flex duct (Figure 10). In these homes, all of the supply registers were sealed, in effect testing the entire duct system.
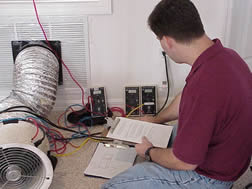 Figure 11. A calibrated blower and a manometer were attached to the isolated portion of the ADS.
- A calibrated blower and a manometer were attached to the isolated portion of the ADS (Figure 11).
- An airtightness test was performed on this portion of the ADS, obtaining Q25.
- Leaks at the AH-to-supply plenum connection were then repaired.
- The Q25 test was repeated.
- Leaks at the AH-to-return plenum connection were then repaired.
- The Q25 test was repeated.
- Leaks in the AH cabinet were repaired.
- The Q25 test was repeated.
- The leakage at each of the three indicated locations was calculated by subtraction from the preceding Q25 value.
5.2 Air Handler Leakage Test Results
A total of 69 air handlers were tested in 64 houses. Nine were gas furnaces. One was electric strip heat. Two were hydronic heat. Fifty-seven were heat pumps.
5.2.1 Air Leakage in the Air Handler and Adjacent Connections
The airtightness results from all 69 air handlers are as follows: 20.4 Q25 in the air handlers, 3.9 Q25 at the return connection, and 1.6 Q25 at the supply connection. These measured leakage amounts were "as found", that is, we measured the leakage of the system without making any changes to the system with one exception. If the filter access door was off or ajar, then it was placed in its proper position. The filter access door was found to be removed or ajar in two homes, both interior air handlers. In one case, a missing filter access door represented 189 Q25. In the other case, an ajar filter access door represented 37 Q25.
Pressure differentials were measured at four locations;
- at the return to air handler connection
- in the lower portion of the air handler (typically between the cooling coil and the filter access location)
- in the upper portion of the air handler (typically between the cooling coil and the blower)
- at the supply to air handler connection
The lower portion of the air handler was always under negative pressure. The upper portion of the handler was under negative pressure in 59 cases (all electric plus one hydronic) and under positive pressure in 10 cases (all furnaces plus one hydronic). In those 10 cases, on average, 56% of the air handler unit was under positive pressure.
Average measured pressure differentials for gas furnaces (with one hydronic unit) and electric air handlers (with one hydronic unit) are shown in Table 2.
and electric units (including 2 hydronic units), with furnaces set for cooling air flow rate.
| Gas Furnaces | Electric | |
| pressure return connection (pa) | -92.1 | -85.5 |
| pressure AH (-) region (pa) | -95.1 | -153.4 |
| pressure AH (+) region (pa) | 114.2 | 78.5 |
| pressure supply connection (pa) | 96.8 | 50.8 |
Based on the measured operational pressures and the Q25 for each location, estimated air leakage has been calculated for both the negative pressure and the positive pressure zones of the air handler plus connections for the 69 systems. The negative pressure zone had an average (as operated) leakage of 58.8 cfm. This 58.8 cfm of estimated return leakage in the air handler cabinet and adjacent connection represents 4.9% of the average 1207 cfm of air handler air flow. The positive pressure zone had an average leakage of 9.3 cfm, or 0.8% of air handler flow.
5.2.2 Air Leakage Variations by Air Handler Type and Location
It was intended that 12 furnaces would be tested, 4 from each air handler location. However, only nine furnaces were tested, because relatively few furnace units were found in interior or attic locations. In addition to the 9 furnaces, 2 hydronic gas heating system were tested (this air handler was also located in the garage). The hydronic system uses a hydronic heating coil with hot water supplied by a gas water heater. The 9 gas furnaces were found to be considerably more leaky than the non-furnace units. Since there is a difference among types of furnaces, averages for non-gas furnaces are shown in Table 3 and Table 4 shows gas furnace averages.
The total cabinet leakage of positive and negative pressure regions are 28.3 Q25 versus 19.2 Q25 (found in Tables 3 and 4 by adding Q25 AH (-) region to Q25 AH (+) region). The hydronic units had air handler leakage of 35.1 Q25, even more than the gas furnace air handlers. When converted to actual leakage, the 9 furnace units experienced 25.9 cfm of return leakage and 41.5 cfm of supply leakage in the cabinet. By comparison, the 60 non-furnace air handlers experienced 56.4 cfm of return leakage and 0.4 cfm supply leakage in the cabinet.
When gas furnaces are excluded, there were only minor variations in cabinet airtightness by air handler location. Q25 for the non-gas furnace units is essentially the same for each air handler location; 19.7 Q25 for attic, 18.7 Q25 for garage, and 19.0 for indoors (found in Table 3 by adding Q25 AH (-) region to Q25 AH (+) region). However, there is a noticeable difference in operational leakage because return side pressure is substantially lower for attic installations. While air handler pressure for garage and interior units are -181 pascals and -160 pascals, respectively, it is -126 pascals for attic units. As a result, return side cabinet leakage for attic units is 17.1 % less compared to garage units and 13.1 % less compared to interior units. However, since a larger fraction of the return ductwork of attic units is "outdoors" (see discussion in Section 6.0), the actual air flow from "outdoors" is likely to be greater for attic units than for other air handler locations.
| 22 Attic | 17 Garage | 21 Indoors | 60 Total | |
| pressure return connection (pa) | -69.1 | -114.4 | -79.4 | -85.5 |
| pressure AH (-) region (pa) | -125.5 | -181.2 | -160.1 | -153.4 |
| pressure AH (+) region (pa) | 121.0 | 36.0 | na | 78.5 |
| pressure supply connection (pa) | 52.8 | 51.2 | 48.3 | 50.8 |
| Q25 return connection | 2.1 | 2.4 | 3.8 | 2.8 |
| Q25 AH (-) region | 19.1 | 18.5 | 19.0 | 19.0 |
| Q25 AH (+) region | 0.6 | 0.2 | 0.0 | 0.2 |
| Q25 supply connection | 1.7 | 1.3 | 0.7 | 1.2 |
| Q25 sum | 21.7 | 21.1 | 22.8 | 21.9 |
| Q return connection (cfm) | 3.9 | 6.0 | 7.6 | 5.9 |
| Q AH (-) region (cfm) | 50.3 | 60.7 | 57.9 | 56.4 |
| Q AH (+) region (cfm) | 1.5 | 0.3 | 0.0 | 0.4 |
| Q supply connection (cfm) | 2.7 | 2.0 | 1.0 | 1.8 |
| Q AH+connections (cfm) | 58.4 | 68.7 | 66.5 | 62.6 |
| 1 Attic | 6 Garage | 2 Indoors | 9 Total | |
| pressure return connection (pa) | -50.0 | -98.3 | -94.5 | -92.1 |
| pressure AH (-) region (pa) | -66.5 | -100.6 | -93.0 | -95.1 |
| pressure AH (+) region (pa) | 75.0 | 120.9 | 113.8 | 114.2 |
| pressure supply connection (pa) | 74.0 | 100.7 | 96.5 | 96.8 |
| Q25 return connection | 1.2 | 15.8 | 3.8 | 11.4 |
| Q25 AH (-) region | 0.0 | 17.2 | 3.7 | 11.6 |
| Q25 AH (+) region | 0.0 | 21.8 | 6.8 | 16.7 |
| Q25 supply connection | 0.0 | 4.7 | 4.7 | 4.3 |
| Q25 sum | 1.2 | 59.5 | 18.9 | 44.0 |
| Q return connection (cfm) | 1.8 | 35.9 | 8.4 | 24.9 |
| Q AH (-) region (cfm) | 0.0 | 39.7 | 8.1 | 25.9 |
| Q AH (+) region (cfm) | 0.0 | 56.1 | 16.9 | 41.5 |
| Q supply connection (cfm) | 0.0 | 10.8 | 10.6 | 9.7 |
| Q AH+connections (cfm) | 1.8 | 142.5 | 44.0 | 102.0 |
5.3 Air Flow Rates
Air flow rates were measured for each system. Using a flow hood, air flow was measured at each supply and each return. Using a Flow Plate from the Energy Conservatory, the air handler flow rate was measured in 56 of 69 air handlers. In 46 of the 56 cases, the flow plate was installed in the filter tray, the intended location for the flow plate. In 10 of the 56 cases, the flow plate was installed at the single return grill because it would not fit into the air handler (most often because plate was too large or too small). In the 13 cases where the flow plate measurement was not performed, either there was no access to the filter tray or the flow plate would not fit the air handler dimensions.
Our best estimate of total air handler air flow is based on the flow hood at the return(s) and addition of estimated return leakage (based on Q25 and operating pressure, including the air handler and connections). Our best estimate of total air handler air flow was 1207 cfm per system. With nominal cooling capacity of 38,000 Btu/hr per system, this converts to 381 cfm per ton, or nearly on target with the nominal 400 cfm per ton normally indicated by most manufacturers as design flow.
Table 5. Operating pressures, Q25, and Q (calculated operational leakage) for 69 tested systems.
23 Attic |
23 Garage |
23 Indoors |
69 Total |
|
| pressure return connection (pa) | -68.3 |
-110.2 |
-80.7 |
-86.4 |
| pressure AH (-) region (pa) | -122.9 |
-160.2 |
-154.3 |
-145.5 |
| pressure AH (+) region (pa) | 98.0 |
108.8 |
113.8 |
107.7 |
| pressure supply connection (pa) | 53.7 |
64.1 |
52.5 |
56.8 |
| Q25 return connection | 2.0 |
5.9 |
3.8 |
3.9 |
| Q25 AH (-) region | 17.4 |
18.3 |
16.6 |
17.6 |
| Q25 AH (+) region | 1.4 |
5.7 |
1.7 |
2.8 |
| Q25 supply connection | 1.7 |
2.2 |
1.0 |
1.6 |
| Q25 sum | 22.5 |
32.1 |
23.1 |
25.9 |
| Q return connection (cfm) | 3.7 |
14.4 |
7.7 |
8.2 |
| Q AH (-) region (cfm) | 45.2 |
55.8 |
49.5 |
50.6 |
| Q AH (+) region (cfm) | 3.2 |
13.8 |
4.2 |
6.7 |
| Q supply connection (cfm) | 2.7 |
3.9 |
1.6 |
2.6 |
| Q AH+connections (cfm) | 54.8 |
87.9 |
63.0 |
68.1 |
6.0 Extended Testing
 |
| Figure 12 |
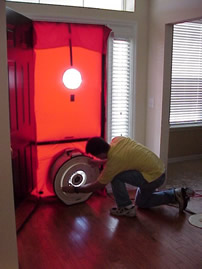
For 20 of the 69 systems additional (extended) testing was performed. This extended testing included measuring the overall duct system airtightness and house airtightness. The duct system airtightness testing followed the duct airtightness test method of ASHRAE Standard 152P (ASHRAE, 2001), obtaining both total leakage and leakage to out. First, the air handler was turned off and masking material was placed over supplies and returns. Second, the ductwork was split (sealed or blocked) at the air handler, either by placing masking over the blower intakes (preferred method) or inserting a barrier into the filter rack in the bottom of the air handler.
Two Duct Blasters were installed, one at a return register and one at a supply register (Figure 12.). With all other registers masked off, both sides of the system were taken to -25 pascals at the same time. ASHRAE 152P allows both sides of the system to be tested separately. When testing Q25,total, there is benefit to running the test with both sides depressurized simultaneously. With both sides at essentially the same pressure, any leakage which might exist across the seal would be very small, and therefore would have essentially no impact on the test results. Furthermore, any leakage past the seal in the air handler would only "steal" from the leakage on one side of the system and "give" it to the other side of the system. By contrast, if each side is tested separately, then leakage past the seal is added to each side of the system. This test yielded Q25s,total and Q25r,total where "s" refers to supply and "r" refers to return.
On the other hand, when measuring Q25,out and only one side of the system is tested at a time, then there will be relatively little pressure differential across the seal in the air handler, and leakage past the seal will have less impact. This test yielded Q25s,out and Q25r,out. In this test, the house is depressurized to the same -25 pascal pressure as the duct system. Duct system leaks to and from the conditioned space "disappear" during this test because the pressure differential between inside the ducts and the room go to zero. This yields duct leakage to outdoors. For the 20 houses in which extended testing was done, duct leakage test results are shown in Table 6.
| house no. | Q25r,total | Q25s,total | Q25total | Q25r,out | Q25s,out | Q25out | ACH50 |
| 1 | 30 | 98 | 128 | 30 | 48 | 78 | 5.2 |
| 3 | 143 | 308 | 451 | 64 | 154 | 218 | 8.7 |
| 4 | 45 | 116 | 161 | 34 | 81 | 115 | 5.8 |
| 5 | 41 | 115 | 156 | 33 | 57 | 89 | 4.4 |
| 10 | 61 | 189 | 250 | 41 | 129 | 170 | 3.6 |
| 11 | 80 | 141 | 221 | 73 | 73 | 147 | 4.4 |
| 12 | 79 | 161 | 240 | 47 | 67 | 114 | 4.7 |
| 17 | 36 | 146 | 182 | 15 | 1 | 16 | 4.6 |
| 18 | 64 | 93 | 157 | 19 | 42 | 61 | 9.7 |
| 19 | 42 | 41 | 83 | 4 | 29 | 34 | 6.0 |
| 27 | 20 | 45 | 65 | 17 | 21 | 38 | 4.2 |
| 33 | 8 | 130 | 138 | 5 | 57 | 61 | 5.3 |
| 34 | 98 | 180 | 278 | 65 | 94 | 158 | 5.9 |
| 35 | 77 | 247 | 324 | 68 | 127 | 195 | 5.9 |
| 37 | 91 | 98 | 189 | 4 | 84 | 88 | 13.3 |
| 38 | 20 | 102 | 133 | 4 | 27 | 20 | 4.5 |
| 39 | 28 | 196 | 223 | 13 | 101 | 114 | 5.3 |
| 41 | 39 | 33 | 71 | 30 | 26 | 56 | 8.4 |
| 45 | 14 | 81 | 95 | 13 | 43 | 55 | na |
| 46 | 20 | 166 | 186 | 18 | 77 | 95 | 6.3 |
| AVE. | 53 | 134 | 187 | 30 | 67 | 97 | 6.1 |
6.1 "Total" Duct Leakage
Some important observations can be made from the extended test data in 20 houses. Total leakage on the return side of the system (including the air handler, return connection) was 53 Q25r,total. With weighted operating pressure on the return side of about -100 pascals (including the air handler), operating return leakage is calculated to be 122 cfm, or 9.7% of rated system air flow.
Total leakage on the supply side of the system (Q25s,total) was a very large 134. ASHRAE 152P method suggests using half of the supply plenum pressure as an estimate of overall supply ductwork operating pressure, if actual duct pressures are not known. For the 20 systems in which extended testing was performed, supply plenum pressure was 73.3 pascals. Based on a pressure of 37 pascals, actual leakage would be 167 cfm, or about 13.3% of rated air flow. In order to test the divide by two method, supply duct operating pressure measurements were taken for 14 systems at locations which were felt to be representative of the overall supply ductwork. These average 35.9 pascals, compared to 65.7 pascals for the supply plenums for those same 14 systems. For these systems, duct pressure was 55% of supply plenum pressure. Therefore, it seems that divide by two method is reasonable for central Florida homes on the supply side of the system.
The divide by two method is not reasonable for central Florida homes for the return side of the system. For these 20 systems, 38% of the Q25r,total is in the air handler and 62% of the Q25r,total is in the return ductwork. Given air handler pressure of -133 pascals, a return plenum pressure of -81.5 pascals, and return duct pressure of approximately -70 pascals, the weighted return side pressure is approximately -95 pascals. By contrast, the divide by two method would predict approximately -41 pascals. Clearly, in systems such as those commonly found in Florida that have only a single, short return duct (plenum), the actual operating pressure should be greater than the return plenum, perhaps 1.2 times the plenum pressure.
In addition to the extended testing results from these 20 units, return side leakage (Q25r,total; including the return duct, return connection, and air handler) is available for 38 other systems. This additional return airtightness data results from the test method used to characterize air handler airtightness. The supply side of the system was isolated and excluded by cutting through and blocking the supply plenum. What remained was the air handler and the return ductwork. After leaks in the air handler cabinet and at the return and supply plenum connections were repaired, the remaining leakage was for the return ductwork.
Therefore, return side leakage is available for 58 of the 69 systems. Return leak air flow (Qr,total) combined for the air handler, return connection, and the return ductwork was found to be 152.4 cfm, or 11.8% of total rated system air flow for this group of 58, based on Q25r,total and operational pressures. For this larger sample, Qr,total is considerably greater than for the 20 houses of extended testing. The results are rather alarming, that in newly constructed homes on the order of 12% of return air and 13% of supply air are leaking. But how much of this leakage is to "out" or unconditioned space?
6.2 Duct Leakage to "Out"
In 20 homes, duct leakage to "out" was measured (Table 6). On average, 56% of the leakage of the return ductwork (including air handler) and supply ductwork was to "out" ("out" defined as outside the conditioned space, including buffer spaces such as attic or garage). The fraction of the leakage that was to "out" varies by air handler location (Table 7). For return ductwork (including air handler), the proportion of total leakage that is to "out" is 81.4% for attic, 67.6% for garage, and 28.0% for indoors. For supply ductwork, the proportion of total leakage that is to "out" is in the range of 52% to 56% for all three locations.
| Air handler location | Return | Supply | Entire duct system |
| Attic | 81.4% | 56.5% | 63.2% |
| Garage | 67.6% | 51.7% | 56.0% |
| Indoors | 28.0% | 52.6% | 37.1% |
The biggest variable which seems to predict leakage fraction to "out" is the fraction of the return ductwork that is in the attic, since nearly all of the supply ductwork is in the attic. All of the return ductwork of attic units was in the attic, whereas much of the return ductwork for other units was in the house. As a consequence, the energy penalty associated with locating the air handler in the attic is greater than indicated in the computer modeling results in Section 7.0 (compared to other air handler locations) because the modeling only considers the leakage of the air handler cabinet and the adjacent connections, and not the return ductwork itself. If the modeling were to take into account the fraction of the return duct leakage that comes from "out" (specifically the attic), then the energy penalties associated with the attic air handler location would be greater than indicated by the modeling.
Estimates can be made for actual operating duct leakage to "out", based on the fraction of the leakage to "out" from Table 7. These are presented in Table 8. For the supply duct leakage, the Q25s,total and Q25s,out are measured data from 20 houses. For the return duct leakage, Q25r,total is measured data from 58 systems. Q25r,out is calculated from the 58 system sample by using the "out"/"total" fraction obtained from the 20 system sample.
Table 8. Duct leakage "total" and "to out" for three locations, for both 25 pascals test pressure and actual system operating pressure (units are cfm). Sample size in [brackets].
| ATTIC | GARAGE | INDOORS | COMBINED | |||||
| total | out | total | out | total | out | total | out | |
| Q25,r [58] | 61.9 | 50.4 | 93.3 | 63.1 | 67.8 | 19.0 | 75.7 | 44.9 |
| Q25,s [20] | 109.1 | 61.6 | 170.6 | 88.2 | 119.5 | 62.9 | 134.3 | 71.4 |
| Qr [58] | 118.1 | 96.1 | 194.4 | 131.4 | 134.6 | 37.7 | 152.4 | 90.4 |
| Qs [20] | 135.6 | 76.6 | 212.0 | 109.6 | 148.5 | 78.1 | 166.9 | 88.7 |
From Table 8 actual operating supply leakage to "out" is large for all three air handler locations, averaging 89 cfm. Actual operating return leakage to "out" is slightly larger, on average, at 90 cfm. However, there is a large difference depending upon air handler location; 96 cfm for attic systems, 131 cfm for garage systems, but only 38 cfm for indoor systems. From an energy point of view, the attic systems may experience the greatest "real" energy penalties, because all of the return ductwork and air handler are located in the attic. By contrast, a majority of the return leakage for the garage system likely comes from the garage (which is considerably cooler than the attic). For indoor systems, the return leakage to "out" probably originates primarily from the attic. However, since the return leakage is so much smaller, the energy impact is likely to be considerably less than that of both the attic and garage systems.
6.3 Correlation of Supply Duct Leaks with Number of Registers
When analyzing the supply leakage in the extended test data, a surprising correlation was observed. This correlation indicates that there is a systematic and consistent duct fabrication problem that exists across a wide range of air conditioning contractors.
Figure 13 illustrates this correlation. This plot shows that each supply duct has a remarkably predictable amount of total duct leakage associated with it. The coefficient of determination is 0.86, indicating that 86% of the variability in total supply duct leakage is explainable by the number of supply registers. Figure 14 shows a similar relationship between supply leakage to "out" and the number of supply registers. In this case the coefficient of determination is 0.69, indicating that 69% of the variability in total supply duct leakage is explainable by the number of supply registers. Note that one of the two houses with 13 registers shows considerably less leakage than expected. In this case, supply ducts were located in the interstitial space between floors. When the house was taken to -25 pascals, it is probable (though not measured) that the interstitial spaces were substantially depressurized as well, so leaks in those supply ducts would show less air flow (i.e., less pressure differential = less leakage air flow) and therefore be under-represented.
 |
 |
| Figure
13. |
Figure
14. Supply CFM25out leakage vs. the number of supply registers |
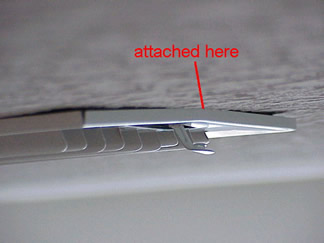 |
Figure
15. Register to ceiling leakage. |
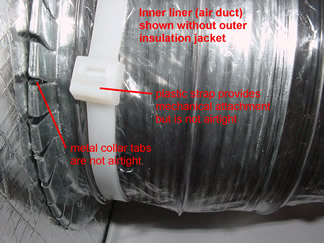 |
Figure
16. Connection of flexible duct to metal collar. |
These two figures suggest that a duct leakage problem is recurring in nearly all new homes. We have identified what we believe are three issues that are creating this leakage. The first is the connection of the supply register or return grill to the sheet rock as seen in Figure 15. This leak shows up as supply leakage in the "total" test but not much in the leakage to "out" test. This leakage occurs when the register or grill does not "snug" tightly to the ceiling or wall board. In many cases, the register frame bends when the screws are tightened, often because it is fabricated from light gauge metal. This bending of the frame causes gaps between the register and the dry wall. While this leakage has relatively little impact on infiltration, energy use, or space humidity, since the leakage is to and from the conditioned space, it will still show up in the "total". This can be the cause of not meeting the 10% of system flow requirement of the Florida Energy Code.
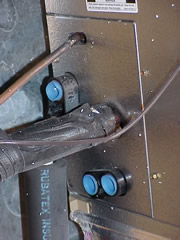
The second and third issues are the 1) boot (supply box) to sheet rock connection and 2) flex duct to collar connection. These typically show up as leakage to both "out" and "total". Figure 16 shows how the flexible duct connections are typically made. In some cases metal tape is used, but wrinkles when applied to the complex angles and over bumps associated with this type of connection. Although small in size, the many wrinkles in the tape at each connection allow air to pass through. Best practice would use mastic from one air barrier to the next. For instance, mastic applied from the foil of the duct board over the metal tabs of collar and then onto the collar where the air duct is fastened down with the plastic strap.
The high correlation between the number of registers (typically representing two flex-to-collar connections, one connection at the main trunk or a supply junction box and the other connection at the supply boot) and the amount of supply leakage is high indicates that this installation practice failure is nearly universal. For "total" leakage, there are about 12 Q25 per register. For leakage to "out", there are about 6 Q25 per register (or 3 Q25 per flex duct connection).
6.4 House Airtightness
 |
Figure
17 |
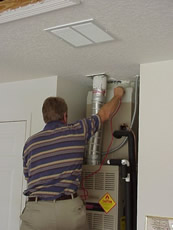
House airtightness was also measured using a blower door (Figure 17.). House airtightness test results are shown in Table 6. On average, house airtightness was found to be 6.1 ACH50, which is in line with test results on other samples of homes built in the past decade in Florida.
7.0 Computer Modeling for Florida Energy Code Air Handler Multipliers
A project task was to perform simulations and develop Air Handler Multipliers for the Florida Energy Code using simulation results. The model used is FSEC 3.0 (FSEC, 1992), a general building simulation program developed by FSEC. The model provides detailed simulation of a whole building system, including energy, moisture, multi-zone air flows, and air distribution systems simultaneously.
In the year 2001, modeling had been performed to develop these Air Handler Multipliers. These multipliers, however, were based on estimated Q25 and duct operating pressures. (The model also takes into account conductive losses associated with the thermal environment and thermal capacitance of the ADS components. One input is the surface area of the air handler cabinet.) At the time of the 2001 modeling, there was essentially no data on air handler and connection leakage. For this project, modeling was performed again, but this time using the results of field testing in 69 homes.
The modeling inputs used in 2001 and in 2002 (the current project) are shown in Table 9. Note that we used the same Q25 and operating dP values for all air handler locations, primarily because there was essentially no difference between the Q25 values for attic, garage, and indoor air handler locations when gas furnace units were removed from the analysis.
| 2001 Q25 | 2002 Q25 | 2001 dP | 2002 dP | |
| Return connection | 8.7 | 3.9 | -40 | -86.1 |
| AH - depressurized portion | 48.5 | 17.6 | -42 | -139.1 |
| AH - pressurized portion | 9.6 | 2.8 | 43 | 106.5 |
| Supply connection | 7.8 | 1.6 | 32 | 58.2 |
| Total | 74.6 | 25.9 |
While the Q25 leakage for the air handler and connections was about 65% less than earlier estimates, operating pressures were much higher than estimates. The AH Multipliers based on the current computer modeling results are presented in Tables 10, 11, and 12. Note that modeling of air handler energy use was also performed for air handlers located outdoors in spite of the fact that no field data was collected for outdoor units. The modeling input parameters were the same as for the other air handler locations as shown in Table 9. Note also that the AH Multipliers for attic, indoors, and outdoors are normalized to garage; garage is the base line.
Table 10. Florida Energy Code AH Multipliers for South Florida
| AH Location | Winter | Summer | ||||
| old | 2001 | new | old | 2001 | new | |
| attic | 1.04 | 1.15 | 1.12 | 1.04 | 1.09 | 1.06 |
| garage | 1.00 | 1.00 | 1.00 | 1.00 | 1.00 | 1.00 |
| indoors | 0.93 | 0.91 | 0.94 | 0.93 | 0.91 | 0.92 |
| outdoors | 1.03 | 1.08 | 1.06 | 1.03 | 1.03 | 1.01 |
Table 11. Florida
Energy Code AH Multipliers for Central Florida
| AH Location | Winter | Summer | ||||
| old | 2001 | new | old | 2001 | new | |
| attic | 1.04 | 1.11 | 1.08 | 1.04 | 1.10 | 1.08 |
| garage | 1.00 | 1.00 | 1.00 | 1.00 | 1.00 | 1.00 |
| indoors | 0.93 | 0.92 | 0.94 | 0.93 | 0.90 | 0.92 |
| outdoors | 1.03 | 1.09 | 1.05 | 1.03 | 1.02 | 1.01 |
Table 12. Florida
Energy Code AH Multipliers for North Florida
| AH Location | Winter | Summer | ||||
| old | 2001 | new | old | 2001 | new | |
| attic | 1.04 | 1.10 | 1.03 | 1.04 | 1.11 | 1.08 |
| garage | 1.00 | 1.00 | 1.00 | 1.00 | 1.00 | 1.00 |
| indoors | 0.93 | 0.93 | 0.94 | 0.93 | 0.91 | 0.92 |
| outdoors | 1.03 | 1.07 | 1.02 | 1.03 | 1.02 | 1.01 |
Two project advisory review meetings were held to provide a project progress report and receive comments from the committee. The project advisory committee was developed to reflect the interested parties which brought about the air handler leakage research; representatives of the Florida Home Builders, the Florida Air Conditioning Contractors (FACCA), DCA staff, and FSEC staff. The first was held October 1, 2001 from 3 to 5 PM at the Rosen Centre Hotel in Orlando. A work plan had been prepared by FSEC staff and was distributed to the advisory committee with a request for review and comments. No comments were received. Janet McIlvaine presented the methodology and progress of finding homes for testing. Chuck Withers presented the steps taken to build a low-flow measurement device and the calibration procedures and results. Following this, Chuck Withers presented results from testing in five homes.
The second meeting was held August 13, 2002 also at the Rosen Centre Hotel. A summary of the completed 69-system field testing was presented. The computer modeling results of AH Multipliers was also presented. Photos showing the types of air leakage that occurred in air handlers and adjacent connections were shown.
9.0 Create a Data Base of Field Test DataThe field test data was compiled into a database. This database was updated on a regular basis throughout the project in order to keep track of project progress and identify any data omissions which might occur. This database (in both Quattro Pro and MS Excel format) is included on a disc attached to the back cover of this report, and is also available upon request.
10.0 Summary and Conclusions
Leakage was performed in 69 air handler cabinets and adjacent connections. Duct leakage testing was performed in a subset of those 69 systems.
10.1 Air Handler Leakage
Leakage in the air handler cabinet averaged 20.4 Q25 in 69 air conditioning systems. Leakage at the return and supply plenum connections averaged 3.9 and 1.6 Q25, respectively. Using the operating pressures in the air handler and at the plenum connections, these Q25 results convert to actual air leakage of 58.8 cfm on the return side (negative pressure side) and 9.3 cfm on the supply side (positive pressure side). The combined return and supply air leakage in the air handler and adjacent connections represents 5.3% of the system air flow (4.6% on the return side and 0.7% on the supply side). This is a concern, when one considers that a 4.6% return leak from a hot attic (peak conditions; 120oF and 30% RH) can produce a 16% reduction in cooling output and 20% increase in cooling energy use (Cummings and Tooley, 1989), and this only from the air handler and adjacent connections.
10.2 Duct System LeakageDuct leakage to "out" was tested in 20 houses. On the supply side of the system, about 54% of the "total" air distribution system leakage was to "out", with little variation by air handler location. On the return side of the system, the fraction of the air distribution system leakage that was to "out" varies considerably by air handler location; 81.4% for attic, 67.6% for garage, and 28.0% for indoors. Because a much higher proportion of return duct leakage is in the attic, air handlers located in the attic will have a much higher "real world" energy penalty compared to garage systems and especially indoor systems. Computer modeling performed for this project shows that locating an air handler in the attic (of Central Florida homes) causes a 17.4% increase in cooling energy use compared to locating the same air handler indoors. However, because the protocol for assessing the energy penalty takes into account only leakage in the air handler and adjacent connections, the modeling understates the actual real world energy penalties of placing the air handler in the attic.Estimates were made for actual operating duct leakage to "out", based on the fraction of the leakage to "out" from the preceding paragraph (and Table 7). Return side leakage to "out" is about three times greater for attic and garage systems compared to indoor air handler systems (Table 8).Additional conclusions about duct leakage can also be drawn from the testing of leakage in the remainder of the air distribution system. In 58 homes, total return side leakage (Qr,total) of 152.4 cfm was calculated based on Q25r,total and measured operating pressures. In 20 homes, total supply side leakage (Qs,total) of 166.9 cfm was calculated based on Q25s,total and measured operating pressures. These results are rather disappointing, that in newly constructed Florida homes on the order of 12% of return air and 13% of supply air are leaking.
10.2.1 Supply Duct Leakage Correlation to Number of Registers
One of the interesting and disturbing findings of this project was the high correlation between number of supply grills and amount of supply side duct leakage. See Figures 13 and 14. This strongly suggests that there are one or more duct installation practices which are being systematically implemented and which are creating duct leakage. The good news is that these practices have been identified as ones that can be corrected by proper training.
10.3 Florida Energy Code Airtight Duct Credit
Another area of concern is related to the high operating pressures which exist in the tested air handlers, and also throughout the return side of the system. This concern relates to the current standard for duct system airtightness contained in the Florida Energy Code. Airtight duct credit is received when Q25,total is less than or equal to 5.0% of rated air handler fan flow. (For the 20 systems tested for duct leakage, Q25,total was 187 (combined return and supply leakage) and the rated fan flow rate for these systems was 1257 cfm [assuming 400 cfm per ton]. Therefore, Q25,total is 14.9% for these 20 systems, or three times the limit. These duct systems therefore do not come close to meeting this airtight duct credit.) The problem with the current definition of "airtight duct" is that this 5% leakage is at 25 pascals and that some portions of the system operate at pressures substantially greater than 25 pascals. Consider two cases. First, consider that the weighted operating pressure of the depressurized portion of the air handler was approximately -145 pascals. Second, consider that the weighted operating pressure of the return side of the tested systems was -95 pascals. For a system with 1257 cfm of air handler flow, a 5% leakage equals 63 Q25,total. When converted to actual flow, this 63 Q25,total equals 181 cfm if located only in the air handler or 140 cfm if distributed throughout the return side of the system. One would hardly consider these levels of leakage to be airtight ductwork, since they represent 14.9% and 11.1% of system air flow, respectively. In the worst case, where the return leakage is entirely from the attic, this would cause a 48% or 37% reduction, respectively, in cooling system efficiency and capacity during hot summer afternoon conditions (attic = 120oF and 30% RH; Cummings and Tooley, 1989).These large losses in capacity suggest that consideration should be given to assigning a tighter standard to "airtight duct". Q25,total less than or equal to 2% of system air flow would seem to make sense from an energy and AC performance point of view, and should be readily achievable with currently available knowledge and technology.
11.0 References
American Society of Heating, Refrigerating, and Air Conditioning Engineers, ASHRAE Standard 152P-2001, "Method of Test for Determining the Design and Seasonal Efficiencies of Residential Thermal Distribution Systems", January 2001.
Cummings, J. B. and Tooley, J. J., "Infiltration and Pressure Differences Induced by Forced Air Systems in Florida Residences," ASHRAE Transactions, 1989, Vol.95, Part 2.
Cummings, J. B., Moyer, N., and Tooley, J. J., "Radon Pressure Differential Project, Phase II: Infiltration," FSEC-CR-370-90, Florida Solar Energy Center, Cocoa, FL, November 1990.
Florida Solar Energy Center, 1992, "FSEC 3.0: Florida Software for Environmental Computation," Version 3.0, FSEC-GP-47-92, Florida Solar Energy Center, Cocoa, FL
12.0 Acknowledgments
Funding for testing of 59 air handler systems has come from the Florida Department of Community Affairs, and funding for testing 10 air handler systems has come from Brookhaven National Laboratory and the United States Department of Energy. This project was done in partnership with the U.S. DOE funded Building America Industrialized Housing Partnership (BAIHP) which provided additional resources to perform the research.
Appendix A: Typical Leak Sites and Repairs
Masking tape was used to seal seams temporarily while testing occurred and was not left in place following testing.
 |
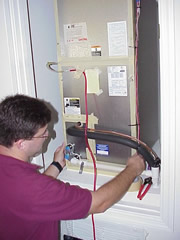 |
Figure 1. Typical penetration and and panel seam leaks. |
Figure 2. Seams temporarily sealed with masking tape and penetrations sealed with putty. |
 |
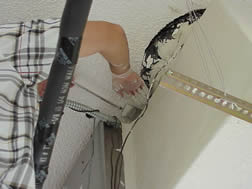 |
Figure 3. Supply connection leak with mastic. |
Figure 4. Supply connection leak being sealed with mastic, mirror used to inspect. |
 |
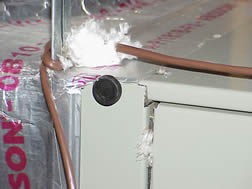 |
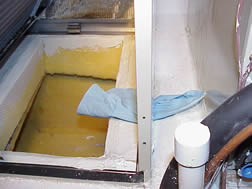
Figure 5. Return connection leaks at cabinet and plenum connection at lower left. This was repaired with mastic. |
Figure 6. Filter panel seam of system in attic with insulation sucked into seam. |
 |
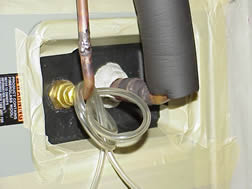 |
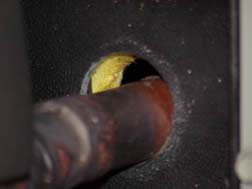
Figure 7. Refrigerant line penetration leak. |
Figure 8. Seals made around refrigerant lines. |
 |
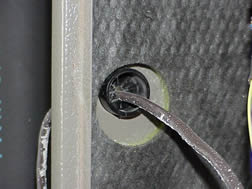 |
Figure 9. Refrigerant line penetration gasket seals that were not used. |
Figure 10. Thermostat wire penetration leak also notice vertical dust line where panel seam is located which is due to air leakage. |
 |
|
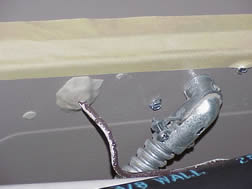
Figure 11. Wire penetration sealed with putty and panel seam sealed with tape. |
© 2007-2014 University of Central Florida. The Florida Solar Energy Center (FSEC)
is a research institute of the
University of Central Florida.
For more information about FSEC, please contact us or learn more about us.
Find us on Facebook!