

Reference Publication: Parker, D., Sonne, J., Sherwin, J., "Comparative Evaluation of the Impact of Roofing Systems on Residential Cooling Energy Demand in Florida," Proceedings of ACEEE 2002 Summer Study, American Council for an Energy Efficient Economy, Washington, DC, August 2002. Disclaimer: The views and opinions expressed in this article are solely those of the authors and are not intended to represent the views and opinions of the Florida Solar Energy Center. |
Comparative
Evaluation of the Impact of Roofing Systems
on Residential Cooling Energy
Demand in Florida
Danny
S. Parker, Jeffrey K. Sonne, John
R. Sherwin
Florida
Solar Energy Center (FSEC)
FSEC-CR-1220-00
ABSTRACT
Roof and attic thermal performance exert a powerful influence on cooling energy use in Florida homes. The Florida Power and Light Company and the Florida Solar Energy Center instrumented six side-by-side Habitat homes in Ft. Myers, Florida with identical floor plans and orientation, R-19 ceiling insulation, but with different roofing systems designed to reduce attic heat gain. A seventh house had an unvented attic with insulation on the underside of the roof deck rather than the ceiling:
· (RGS)
Standard dark shingles (control home)
· (RWB)
White “Barrel” S-tile roof
· (RWS)
Light colored shingles
· (RWF)
White flat tile roof
· (RTB)
Terra cotta S-tile roof
· (RWM)
White metal roof
· (RSL)
Standard dark shingles with sealed attic and R-19 roof deck insulation
Building thermal conditions and air conditioning power usage were obtained. The attic temperature during the peak summer hour is 40 oF greater than ambient air temperature in the control home while no greater than ambient with highly reflective roofing systems. Light colored shingles and terra cotta roofs show temperatures in between those extremes.
Measurements showed that the three white reflective roofs would reduce cooling energy consumption by 18-26% and peak demand by 28-35%. The terra cotta tile roofs and white shingles would produce cooling savings of 3-9% and 3-5%, respectively, while the sealed attic construction with an insulated roof deck would produce reductions of 6-11%.
Introduction
Traditional architecture in hot climates has long recognized that light building colors can reduce cooling loads (Langewiesche, 1950; Givoni, 1976). A series of simulation and experimental studies have demonstrated that building reflectance can significantly impact cooling needs (Givoni and Hoffmann, 1968; Taha et al., 1988; Griggs and Shipp, 1988, and Bansal et al., 1992). Full building field tests in Florida and California using before-after experiments have examined the impact of reflective roofing on air conditioning (AC) energy use. In Florida tests measured AC electrical savings averaged 19% (7.7 kWh/Day) (Parker et al., 1998). Even greater fractional savings have been reported for similar experiments in California (Akbari, et al., 1992). Beyond roof reflectance, additional research has shown that other approaches such as tile roofs and unvented attics with insulation under the roof itself, can produce cooler attics resulting in energy improvements, but of unknown comparative magnitude (Beal and Chandra, 1995; Rudd, 1998; Rudd et al., 2000).
Duct systems
are often located in the attic space in Sun Belt homes with slab on
grade foundations. In an early assessment of the impact of reflective
roofing, infrared thermo-graphy revealed that heat gain to attic-mounted
duct systems and air handlers are adversely affected by hot attics
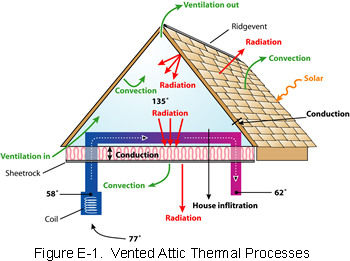
(Parker et al, 1993B). As shown in Figure 1, previous analysis has
shown that attic heat gain to the thermal distribution system can
increase residential cooling loads by up to 30% during peak summer
periods (Parker et al., 1993; Jump et al, 1996). Further benefits
arise from the reduction of attic air temperature and its impact on
ceiling insulation conductivity (Levinson et al., 1996).
Figure
1. Vented Attic Thermal Processes and Interaction with Duct Heat
Gain
Research Description
While previous research efforts have investigated the thermal performance of various roofing systems, this particular study represents the first time an attempt has been made to quantify roofing influence on cooling performance on identical, unoccupied, side-by-side residences. The project consisted of seven, single-family residential homes located in Ft Meyers, Florida. The focus of the study was to investigate how various roofing systems impact air conditioning electrical demand. All seven residences had a three bedroom, one bath floor plan and were of identical construction and exposure. The houses underwent a series of tests in order to ensure that the construction and mechanical systems performed similarly. The sites were given a three-letter code to describe each roofing system:
· Dark
gray fiberglass shingles (RGS)
· White
barrel-shaped tile (RWB)
· White
fiberglass shingle (RWS)
· Flat
white tile (RWF)
· Terra
cotta barrel-shaped tile (RTB)
· White
5-vee metal (RWM)
· Sealed
attic with insulation on the roof plane (RSL)
Monitoring collected 15-minute data on comparative performance of the seven homes in the summer of 2000 under unoccupied and carefully controlled conditions for a month. Relevant construction details are summarized in Table 1.
Table
1
Construction Characteristics for Research Homes
Floor
Area: |
1144 ft 2 (conditioned) |
Net
Wall Area: |
770 ft 2 |
Window
Area: |
101
ft 2; six single glazed units with light gray tint - 45 ft 2 facing east (3 units) - 40 ft 2 facing south (2 units) -15 ft 2 facing west (1 unit) |
Ceiling: |
1144 ft 2 |
Doors: |
40 ft 2; 2 doors (one to unconditioned garage). |
Overhang: |
2 ft around entire perimeter |
Ceiling
Insulation: |
R-19 (blown cellulose) |
Wall
Insulation: |
R-14 (fiberglass batts R-11 with R-3 sheathing) |
Wall
Construction: |
Wood frame (16 inches on center) |
Roof
Construction: |
Hip roof, 18.4 degree pitch (0.15 framing fraction) |
Foundation: |
Uninsulated, concrete slab on grade |
Roofing
Solar Reflectance
Laboratory reflectance measurements were taken on each of the evaluated roofing materials (Table 2). Reflectivity is the fraction of total incident solar radiation reflected by a surface.
Table
2
Laboratory Measured Solar Reflectances of Utilized Roofing Materials
| Specimen | % Solar Reflectance |
| Dark gray shingle (RGS, RSL) | 8.2 |
| White shingle (RWS) | 24.0 |
| Terra Cotta barrel tile (RTB) | 34.6 |
| White barrel tile (RWB) | 74.2 |
| Flat white tile (RWF) | 77.3 |
| White metal (painted)* (RWM) | 66.2 |
Sealed Attic Construction RSL
The seventh house (RSL) tested a new approach to residential insulation: an attic completely sealed and with a spray foam insulation applied to the underside of the roof decking in place of conventional blown or batt insulation. The scheme insulates at the roof decking rather than at the surface of the living space ceiling. Two primary advantages are significantly less duct heat load within the attic space as well as reduced humidity and infiltration. Research has shown this as a promising construction technique (Rudd and Lstiburek, 1998; et al., 2000) in a series of production homes in Las Vegas, Nevada and Tucson, Arizona.
One potential disadvantage is that the roof insulation can result in significantly higher decking and roof surface temperatures. Also, the insulation at the roof deck has a more difficult task since it is working against 170 o (temperature of roofing) rather than 130 o (temperature on top of insulation in a conventional attic at summer peak). The ducts are exposed to less heat gain, but building heat transfer surface areas are increased relative to the conventional case.
The roofing system on the RSL home was identical to that in the control home, dark gray composition shingles over roofing felt and decking. The external appearance was like the conventional homes, however foam insulation was used in the roof deck rather than cellulose insulation in the ceiling assembly. The attic floor consisted solely of rafter and ½ inch gypsum board. The roof deck of the RSL was covered with 5 inches of insulating foam. Application thickness was targeted to achieve an R-19 application – similar in thermal resistance to the cellulose insulation in the other homes. The installed product is a semi-rigid polyurethane foam insulation with a nominal density of 0.45 - 0.5 lbs/ft 3 and an R-value of 3.81 ft 2-hr- oF/Btu/inch. The product also claims to help improve air sealing of the home by controlling leakage from building joints.
Calibrating Thermostats and Influence of Set Temperature
Since variation in interior thermostat temperature was known to be a large variable controlling differences in space cooling, special effort was made to carefully adjust the thermostats in each home so that each was closely maintaining the same interior temperature. This was done using thermocouples which measured the temperature in a central hallway by the thermostat, but not overly close to it due to the heat emitted from the electronics within the digital thermostat.
To evaluate the impact of thermostat set temperature the thermostats were adjusted up one ºF for four days at the end of the project before the homes were occupied. The typical increase was from 77 ºF to 78 ºF . These data were used to examine how the thermostat set-up influenced cooling in order to properly adjust project results. This was accomplished by searching for days in the set-up period having similar weather conditions. As expected the impact was greatest on the cooler days where the outdoor temperature approached the thermostat set temperature and solar radiation impacts were minimized. Over the comparison, space cooling decreased by an average of 12.1% per ºF that the temperature was increased. When confined only to the peak day, the impact was 8.3% per ºF .
Results over the Monitoring Period
The relative performance of the homes over the entire unoccupied monitoring period was evaluated. The five figures below (Figures 2-6) show the fundamental impacts of the roofing system on cooling energy consumption over the entire unoccupied monitoring period from July 8 th - July 31 st, 2000.
Figure 2 depicts the ambient average air temperature and solar conditions over the entire unoccupied period. Figures 3, 4 and 5 show the thermal influences of the roofing system. The first plot graphs the average roof surface temperature over the daily cycle. The second plot shows the corresponding temperature at the underside of the roof decking surface. Note that the roof surface temperature and decking temperature are highest with the sealed attic construction since the insulation under the decking forces much of the collected solar heat to migrate back out through the shingles. On average the shingles reach a peak temperature that is seven degrees hotter than standard construction. However, decking temperatures run almost 20 oF hotter. The white roofing systems (RWM, RWF and RWB) experience peak surface temperatures approximately 20 oF lower than darker shingles. The terra cotta barrel tile case runs about 10 o cooler.
The measured mid attic air temperatures (Figure 5) above the ceiling insulation revealed the impact of white reflective roofs with average peak temperatures approximately 20 o cooler than at the control home. Whereas the attic in the control home reaches 110 oF on the typical day, the attics with the highly reflective white roofing materials only rise to about 90 ºF . Figure 6 shows the clear relationship between peak daily air temperature and attic temperature for the differing roofing systems.
Figure
2. Average Ambient Air Temperature
and Solar Irradiance over the Unoccupied Period
Figure 3. Average Roof Surface Temperature Profiles over the Unoccupied Period
Profiles over the Unoccupied Period
Figure 5. Average Attic Air Temperature Profiles over the Unoccupied Period
Figure 6. Relationship of Daily Peak Air to Peak Attic Temperature
As expected, the home with the sealed attic had the lowest attic
temperatures reaching a maximum of 83 oF compared with the
77 oF being maintained inside. However, the sealed attic case
has no insulation on the ceiling floor with only studs and
sheet rock. Thus, from a cooling loads perspective, the low
attic temperature with this construction is deceptive. Since ½ inch
sheet rock only has a thermal resistance of 0.45 hr-ft 2- oF/Btu,
a significant level of heat transfer takes place across the
uninsulated ceiling. While this construction method reduced
attic air temperatures, it did not reduce ceiling heat transfer
as well as other options. Ceiling heat fluxes are actually
higher. In this case, the ceiling and duct system is unintentionally
cooling the attic space which can lead to the false impression
that roof/attic loads are lower.
Figure 7 summarizes the measured cooling load profiles for the seven homes over the unoccupied monitoring period. Not surprisingly, the control home has the highest consumption (17.0 kWh/day). The home with the terra cotta barrel tile has a slightly lower use (16.2 kWh/day) for a 5% cooling energy reduction. Next is the home with the white shingles (15.6 kWh/day) – an 8% reduction. The sealed attic comes in with a 12% cooling energy reduction (14.9 kWh/day).
Figure
7. Average Space Cooling Energy
Demand Profiles over the Unoccupied Period
The true white roofing types (> 60% reflectance) clearly show
their advantage. Both the white barrel and white flat tile roofs
averaged a consumption of 13.3 kWh/day or a 22% cooling energy reduction,
while the white metal roof shows the largest impact with a 12.2 kWh/day
August consumption for a 28% reduction. The numbers in Table 3 are
adjusted to account for differences in interior temperature and AC
performance:
Table
3
Cooling Performance During Unoccupied Period
July 8th - 31 st, 2000
| Site | Total kWh | Savings kWh | Save % | Thermo-stat | Avg. Attic o F |
Max. Attic o F |
Temp. Adjust. % | Adjust Sav. % | Field EER | Final Sav. % |
| RGS | 17.03 | 0.00 | 0.0 | 77.15 o | 90.8 | 135.6 | 0.0 | 0.0 | 8.30 | 0.0 |
| RWS | 15.29 | 1.74 | 10.2 | 77.03 o | 88.0 | 123.5 | -1.2 | 11.4 | 9.06 | 10.6 |
| RSL | 14.73 | 2.30 | 13.5 | 77.69 o | 79.0 | 87.5 | 5.4 | 8.1 | 8.52 | 7.8 |
| RTB | 16.02 | 1.01 | 5.9 | 76.99 o | 87.2 | 110.5 | -1.6 | 7.5 | 8.12 | 7.7 |
| RWB | 13.32 | 3.71 | 21.8 | 77.43 o | 82.7 | 95.6 | 2.8 | 19.0 | 8.49 | 18.5 |
| RWF | 13.20 | 3.83 | 22.5 | 77.36 o | 82.2 | 93.3 | 2.1 | 20.4 | 7.92 | 21.5 |
| RWM | 12.03 | 5.00 | 29.4 | 77.64 o | 82.9 | 100.7 | 4.9 | 24.5 | 8.42 | 24.0 |
It is noteworthy that the average July temperature during the monitoring period (81.6 oF) was very similar to the 30-year average for Ft. Myers (82 oF). Thus, the current data are representative of typical South Florida weather conditions. Relative to the standard control home, the data show two distinct groups in terms of performance:
· Terra
Cotta tile, white shingle and sealed attic constructions
produced approximately an 8-11% cooling energy reduction
· Reflective white roofing gave a 19-24% cooling energy reduction.
White flat tile performed slightly better than the white barrel due to its greater reflectance. The better performance of white metal appears to come from the fact that lower nighttime and early morning attic temperatures are achieved than those for tile or shingles, leading to lower nighttime cooling demand.
Peak Day Performance
July
26 th was one of the hottest and brightest days in the data collection
period and was used to evaluate peak influences. Average solar
irradiance was 371 W/m 2 and maximum temperature was 93.0
ºF. These data show that during periods of high solar insolation the performance
of the sealed attic case (RSL) suffers significantly. Decking and attic temperatures
are illustrated in Figures 8 and 9. For instance, both the tile roof and white
shingle did better at controlling demand than the sealed attic on this very
hot day. The white metal roof did best on the hottest day although not appreciably
different from the other white roofing types. Also, the savings for the white
roofs relative to the control were greater than for other days.
Table
4
Summer Peak Day Cooling Performance: July 26 th, 2000
| Site | Cooling Energy | Savings | Peak Period* | |||
| kWh | Percent | Demand (kW) | Savings (kW) |
Percent | ||
| RGS | 18.5 kWh | ---- | 1.631 | 0.000 | ---- | |
| RWS | 16.5 kWh | 2.0 | 11% | 1.439 | 0.192 | 11.8% |
| RSL | 16.5 kWh | 2.0 | 11% | 1.626 | 0.005 | 0.3% |
| RTB | 17.2 kWh | 1.3 | 7% | 1.570 | 0.061 | 3.7% |
| RWB | 13.4 kWh | 5.1 | 28% | 1.073 | 0.558 | 34.2% |
| RWF | 14.2 kWh | 4.3 | 23% | 1.019 | 0.612 | 37.5% |
| RWM | 12.4 kWh | 6.1 | 33% | 0.984 | 0.647 | 39.7% |
* 4-6 PM
Figure 8. Roof Decking Temperature Profiles for July 26, 2000
We calculated the annual cooling energy savings of the differing roofing materials by two methods. First we estimated the normalized daily average reduction in cooling kWh from each construction and then multiplied this quantity by one over the fraction of average cooling which takes place in the month of July. The normalized savings are the values in Table 5 incorporating correction factors for air conditioner performance and interior temperature differences.
The
fraction of space cooling in the month of July was obtained from
averaged empirical monitoring results from a large sample of homes
metered by the utility. These data show that 15.6% of total annual
cooling in the South region occurs in the month of July. Total
average cooling there for the month is 1,141 kWh or about 36.8
kWh/day. Since the homes in the Habitat study are only about 60%
of the average size of a typical new home, we suggest that savings
be indexed by the size of the ceiling against that in the study
(1,144 ft 2).
Table
5
Annual Cooling Energy Savings from Empirical Measurements
| Site | Measured kWh/Day | Temp Correction AC Correction | kWh Day Estimate | Savings (kWh/day) | Annual Savings kWh* |
| RGS | 17.03 | 1.000 / 1.000 | 17.03 | 0.00 | 0 |
| RWS | 15.29 | 0.988 / 1.092 | 16.49 | 0.54 | 110 |
| RSL | 14.73 | 1.054 / 1.027 | 15.94 | 1.09 | 223 |
| RTB | 16.02 | 0.984 / 0.978 | 15.42 | 1.60 | 329 |
| RWB | 13.32 | 1.021 / 0.954 | 14.01 | 3.02 | 618 |
| RWF | 13.20 | 1.049 / 1.014 | 12.86 | 4.17 | 852 |
| RWM | 12.03 | 1.028 / 1.023 | 12.80 | 4.23 | 864 |
* The
estimate is based on a ratio of 6.59 for South (1/0.1517 for 15.17%
of cooling in July). House size assumptions must be accounted for
when estimating average savings or those for a specific case.
An alternative calculation was made using daily regression results. The independent parameters are the daily air temperature and average solar radiation (global horizontal irradiance) that are used to estimate the daily average kWh at that temperature and irradiance value. The regressions for each home are then applied to Typical Meteorological Year (TMY) data for Miami, Florida. The results shown in Table 6 become the estimated space cooling use for each construction. Savings are then normalized by the temperature, air conditioner performance corrections and house size to yield final estimates.
Table
6
Annual Cooling Energy Savings from Regression Analysis Method
| Site | kWh | kWh Savings (*) |
| RGS | 3679 | 0 |
| RWS | 3471 | 208 (191) |
| RSL | 3242 | 437 (404) |
| RTB | 3570 | 109 (113) |
| RWB | 2809 | 870 (893) |
| RWF | 2859 | 820 (771) |
| RWM | 2584 | 1095 (1041) |
(*)
Normalized to correct for off-reference temperature and AC performance.
Peak Demand Reduction
Summer peak demand savings were also estimated in two ways. First we used the measured demand of the seven houses between the hours of 4 and 6 PM on the peak day (July 26, 2000). This estimate should be indexed to the ceiling area for typical houses. Considering that the typical Florida home likely has a ceiling area averaging about 1770 square feet, the ratio of the impact would be approximately 55% greater than that estimated here (1,144 ft 2 ceiling). This also better fits the average cooling energy demand from end-use studies from the utility that show a summer peak AC demand of approximately 2.9 kW in occupied homes. Our monitoring study showed an average peak demand of 1.63 kW in the control home. The average peak demand for the study sites (based on the peak data for July 26 th) are reproduced previously in Table 4.
The second method of estimating demand reductions used hourly regression equations. To estimate peak impacts, the regressions were evaluated at an outdoor temperature of 92 oF – which is close to the peak design temperature at 5 PM.
The regression analysis method estimates in Table 7 show higher peak demand impacts. Demand reduction for the sealed attic construction is very small (<0.2 kW) whereas white shingle and terra cotta tile roof produce a demand reduction of 0.4 - 0.5 kW. The white highly reflective roofing systems produced demand reductions of 0.8 - 1.0 kW.
Table
7
Regression
Estimated Cooling Peak Demand in Research Homes
| Site | Demand kW |
Reduction kW |
Demand Reduction +kW | Demand
Reduction % |
| RGS | 1.788 | 0.000 | 0.00 | 0.0% |
| RWS | 1.480 | 0.308 | 0.48 | 17.2% |
| RSL | 1.701 | 0.087 | 0.13 | 4.9% |
| RTB | 1.558 | 0.230 | 0.36 | 12.9% |
| RWB | 1.197 | 0.591 | 0.92 | 33.0% |
| RWF | 1.153 | 0.635 | 0.98 | 35.5% |
| RWM | 1.278 | 0.510 | 0.79 | 28.5% |
+
Normalized to 1,770 ft 2 typical home.
Simulation Analysis
FSEC has developed a hourly building energy software, EnergyGauge USA, which runs based on the DOE-2.1E simulation engine. A key new component in this software explicitly estimates the performance of attics and the interactions of duct systems if located there. In Florida homes, ducts are almost always in the attic space and previous analysis shows that under peak conditions, the cooling system can lose up to 30% of its cooling capacity through heat transfer with the hot attic (Parker et al., 1993). The software has previously been used to estimate the impact of reflective roofing around the U.S. (Parker et al., 1998). It has been field validated in estimating the space cooling energy use of three homes in Ocala, Florida.
We created detailed input descriptions of each of the 1,114 ft² Habitat homes in the study (including the shading impacts of surrounding buildings) and simulated their performance to see how closely the simulation could match the measured results. Table 8 shows the results.
Table
8
Simulation
Analysis Results
| Building Site | Annual
Cooling (kWh) |
Cooling
Savings (kWh) |
July
Cooling kWh (kWh/D) |
Peak Cooling Demand | |
| (kW) | Reduction | ||||
| RGS | 2,666 | ---- | 503 (16.2) | 1.61 | ---- |
| RWS | 2,549 | 117 | 484 (15.6) | 1.51 | 0.10 |
| RSL | 2,646 | 20 | 493 (15.9) | 1.42 | 0.19 |
| RTB | 2,450 | 216 | 467 (15.1) | 1.30 | 0.31 |
| RWB | 2,211 | 455 | 427 (13.8) | 1.17 | 0.44 |
| RWF | 2,191 | 475 | 424 (13.7) | 1.18 | 0.43 |
| RWM | 2,281 | 385 | 441 (14.2) | 1.39 | 0.22 |
We noted that the simulation predicts very similar absolute values to the measured space cooling at the sites, although predicted savings are somewhat less than those measured. Both the monitoring and simulation shows the white roofing types to provide the greatest savings and peak demand impact, followed by the tile roof, white shingle and sealed attic construction.
Conclusions
Roof and attic thermal performance exerts a powerful influence on cooling energy use in Florida homes. Unshaded residential roofs are heated by solar radiation during the daytime hours causing high attic air temperatures. The large influence on cooling demand is due both to the impact on ceiling heat transfer as well as heat gains to the duct systems which are typically located in the attic space with slab on grade construction.
With the described project we tested six side-by-side Habitat homes in South Florida with identical floor plans and orientations using different roofing systems designed to reduce attic heat gains. A seventh house with an unvented attic and insulated roof deck was also included in the test.
The data showed that solar heating had a large effect on attic thermal performance in the control home. Air conditioning data were also collected allowing characterization of the impact on cooling energy use and peak electrical demand. Each of the examined alternative roofing systems were found to be superior to standard dark shingles, both in providing lower attic temperatures and lower AC energy use. The sealed attic construction provided modest savings to cooling energy, but no real peak reduction due to its sensitivity to periods with high solar irradiance. Our research points to the need for reflective roofing materials or light-colored tile roofing for good energy performance with sealed attics.
Our project revealed essentially two classes of performance for the 1,144 square foot homes. Analysis by two methods showed the white highly reflective roofing systems (RWF, RWB and RWM) provide annual cooling energy reductions of 600-1,100 kWh in South Florida (18-26%). Savings of terra cotta tile roofs are modest at 3-9% (100-300 kWh), while shingles provide savings of 3-5% (110-210 kWh). Sealed attic construction produced savings of 6-11% (220-400 kWh). The highly reflective roofing systems showed peak demand impacts of 28-35% (0.8-1.0 kW). White metal had the best cooling related performance. Its high conductivity coupled with nocturnal radiation resulted in lower nighttime and early morning attic temperatures that lead to a reduced cooling demand during evening hours.
In summary, the selection of roof with high solar reflectance represents one of the most significant energy-saving options available to homeowners and home builders in hot climates. Further, the same materials strongly reduce the house peak cooling demand during utility coincident peak periods – a highly desirable attribute.
Acknowledgments
Special thanks to Florida Power and Light Company who sponsored the study and Habitat for Humanity who worked with FSEC to build the identical test homes.
References
Akbari, H., Taha, H. and Sailor, D., 1992. "Measured Savings in Air Conditioning from Shade Trees and White Surfaces," Proceedings of the 1992 ACEEE Summer Study on Energy Efficiency in Buildings, American Council for an Energy Efficient Economy, Washington D.C., Vol. 9, p. 1.
Bansal, N.K., Garg, S.N. and Kothari, S., 1992. "Effect of Exterior Surface Color on the Thermal Performance of Buildings," Building and Environment, Permagon Press, Vol. 27, No. 1, p. 31-37, Great Britain.
Beal, D. and Chandra, S., 1995. “The Measured Summer Performance of Tile Roof Systems and Attic Ventilation Strategies in Hot Humid Climates,” Thermal Performance of the Exterior Envelopes of Buildings VI, U.S. DOE/ORNL/BETEC, December 4-8, 1995, Clearwater, FL.
Givoni, B. and Hoffman, M.E., 1968. "Effect of Building Materials on Internal Temperatures," Research Report, Building Research Station, Technion Haifa.
Givoni, B., 1976. Man, Climate and Architecture, Applied Science Publishers Ltd., London.
Griggs, E.I, and Shipp, P.H., 1988. "The Impact of Surface Reflectance on the Thermal Performance of Roofs: An Experimental Study," ASHRAE Transactions, Vol. 94, Pt. 2, Atlanta,GA.
Jump, D.A., Walker, I.S. and Modera, M.P., 1996. “Measurements of Efficiency and Duct Retrofit Effectiveness in Residential Forced Air Distribution Systems,” Proceedings of the ACEEE 1996 Summer Study on Energy Efficiency in Buildings, Vol. 1, p. 147, American Council for an Energy Efficient Economy, Washington D.C.
Langewiesche, W., 1950 “Your House in Florida,” House Beautiful, January, 1950, p.74.
Levinson, R., Akbari, H. and Gartland, L.M., 1996. “Impact of the Temperature Dependency of Fiberglass Insulation R-Value on Cooling Energy Use in Buildings,” Proceedings of the ACEEE 1996 Summer Study on Energy Efficiency in Buildings, Vol. 10, p. 85, American Council for an Energy Efficient Economy, Washington D.C.
Parker, D.S., Fairey, P.W. and Gu, L., 1993. “Simulation of the Effects of Duct Leakage and Heat Transfer on Residential Space Cooling Energy Use,” Energy and Buildings, 20, p. 97-113, Elsevier Sequoia, Netherlands.
Parker, D.S., McIlvaine, J.E.R., Barkaszi, S.F. and Beal, D.J., 1993A. Laboratory Testing of the Reflectance Properties of Roofing Materials, FSEC-CR-670-93, Florida Solar Energy Center, Cape Canaveral, FL.
Parker, D.S., Cummings, J.B., Sherwin, J.S., Stedman, T.C. and McIlvaine, J.E.R., 1993B. Measured Air Conditioning Electricity Savings from Reflective Roof Coatings Applied to Florida Residences, FSEC-CR-596-93, Florida Solar Energy Center, Cape Canaveral, FL.
Parker, D.S., P. Fairey and L. Gu, 1993. "Simulation of the Effects of Duct Leakage and Heat Transfer on Residential Space Cooling Energy Use," Energy and Buildings 20, p. 97-113, Elsevier Sequoia, Netherlands.
Parker, D.S., Y.J. Huang, J. Sherwin, S.J. Konopacki and L. Gartland, 1998. “Measured and Simulated Performance of Reflective Roofing Systems in Residential Buildings,” ASHRAE Transactions, Vol. 104, Pt. 1B, January 1998.
Rudd, Armin F., and Lstiburek, Joseph W., 1998. “Vented and Sealed Attics in Hot Climates,” ASHRAE Transactions, Vol. 104, Pt. 2, Atlanta,GA.
Rudd, Armin F., Joseph W. Lstiburek and Kohta Ueno, 2000., “Unvented Cathedralized Attics: Where We’ve Been and Where We’re Going,” Proceedings of the 2000 Summer Study on Energy Efficiency in Buildings, American Council for an Energy Efficient Economy, Vol. 1, p. 247, Washington D.C.
Taha, H., Akbari, H., Rosenfeld, A.H. and Huang, J., 1988. "Residential Cooling Loads and the Urban Heat Island--the Effects of Albedo," Building and Environment, Vol 23, No. 4, Permagon Press, Great Britain.
© 2007-2014 University of Central Florida. The Florida Solar Energy Center (FSEC)
is a research institute of the
University of Central Florida.
For more information about FSEC, please contact us or learn more about us.
Find us on Facebook!