

Reference Publication: Peer reviewed symposium paper published in ASHRAE Transactions 1998, Vol.104, Pt.2. Presented at the annual ASHRAE meeting in Toronto, Canada June 1998. Disclaimer: The views and opinions expressed in this article are solely those of the authors and are not intended to represent the views and opinions of the Florida Solar Energy Center. |
Ventilation,
Humidity, and Energy Impacts of
Uncontrolled Airflow in a Light Commercial Building
Charles
R. Withers Jr. and James
B. Cummings
Florida
Solar Energy Center (FSEC)
FSEC-PF-406-98
1. Abstract
A small commercial building was monitored before and after energy saving retrofits to study the impact of retrofits upon ventilation rates, humidity, building pressure and air conditioning energy use. Duct airtightness testing identified severe duct leakage as a significant source of uncontrolled airflow. Differential pressure and infiltration measurements using tracer gas indicated an attic exhaust fan as another significant source of uncontrolled airflow. Duct repair resulted in a 31% drop (30.5 kWh/day) in cooling energy, and an increase in relative humidity from 72% to 76%. Turning off the attic exhaust resulted in an additional 36% energy savings (14.3 kWh/day), including fan power, and a decrease in relative humidity from 76% to 58%. Turning off the attic exhaust fan also significantly reduced the ventilation rate in the building by about 62 % from pre-retrofit ventilation measurements. The study of this building before and after retrofits illustrates the impacts that air leakage can have on light commercial buildings with non-airtight ceilings, the importance of using good diagnostics to discover all sources of uncontrolled airflow in buildings, and the importance in understanding what the duct zone environment is like in small commercial construction.
2. Introduction
Various studies by (Cummings et al. 1990), (Modera 1990), (Palmiter and Bond 1990), (Parker 1989), and (Proctor 1990) have shown duct leakage to have significant impacts on air distribution efficiency in residential buildings. In 1993, a research project funded by the Florida Energy Office was begun in order to characterize duct leakage and other types of uncontrolled air flow (UAF) in 70 commercial buildings. UAF includes duct leakage, pressure and air flow imbalances resulting from closed interior doors, and unbalanced exhaust air flows out of buildings. Twenty of the 70 buildings were chosen for energy-related monitoring and had repairs made to them to observe the impact on cooling energy use. The building presented in this paper is one of the twenty monitored buildings previously mentioned.
Repair of uncontrolled air flow in these 20 buildings produced average cooling energy savings of 12.4 kWh/day or 14.7 %, and average peak demand reduction of 9.4% or 0.71 kW (Cummings et al. 1996). The most common retrofit was duct repair. In three of the twenty buildings, excessive ventilation through outdoor air was reduced to rates closer to ASHRAE 62-1989. Projected cooling energy savings of $182 per year in these buildings with an average floor area of 3050 square feet (283 square meters) paid for repair costs in 2.5 years. It was concluded that approximately a total of 25% cooling energy savings could be achieved with more complete duct repair and by correcting other sources of UAF. The impact that duct leakage has on heating and cooling energy use also depends upon the environment where the ducts are located.
The key to successful repair is successful diagnosis of all sources of uncontrolled airflow, otherwise the realized savings can be diminished in light commercial buildings (Withers et al. 1996). The building studied in this paper is an example of successful diagnosis and shows the impact of three retrofits; duct repair, replacement of an inefficient heat pump system to one with a higher efficiency, and turning off an attic exhaust fan. The replacement of the heat pump is not considered to be related to UAF, but is included since it occurred between two UAF retrofits.
3. General Building Characteristics
This single-story real estate office building is located in east central Florida. It was built in 1971 and has a floor area of 1845 square feet (171.4 square meters). The walls consist of concrete block with stucco exterior on the east, west and north sides of the building and brick exterior on the south wall. A t-bar panel ceiling is suspended about 8 inches (203 mm) below a wood truss system. Faced R-19 batt ceiling insulation was attached to the bottom side of the wood trusses. The attic space was mechanically ventilated and had two vents each with an area of 0.83 square feet (0.08 square meters) located in the south eave.
One heat pump with a cooling capacity of four tons (14064 kW) and electric resistance heat was used to condition the building air. The seasonal energy efficiency ratio (SEER) was estimated to be 6.0 by an air conditioning contractor who inspected the unit. Air was distributed from the air handler via insulated duct board ducts located in the attic space above the primary thermal barrier (ceiling insulation). The air distribution system had no provision for outside ventilation air. The air handler was located on top of an enclosed support platform in a storage closet within the conditioned space. The support platform was used as part of the return with a single transfer grill through a wall of the platform to the central area of the building. There was no return leakage from outside the conditioned space because the wall cavity at the return grill had been sealed using mastic which is uncommon practice in small commercial buildings of this age in central Florida. While there was no significant return leakage, severe supply duct leakage that resulted from metal tape failure was present in the attic space.
4. Diagnostic and Testing Protocols
This section briefly describes the types of tests used to characterize air flow, airtightness, and pressure dynamics in buildings and test the results found in this real estate office. The tests can usually be completed within one day. A typical protocol includes visual inspections, building and duct airtightness testing, pressure differential measurements, infiltration / ventilation rate tests, and air flow measurement. The objective of the testing was to characterize air flows and pressure differentials within the building, characterize the air flow balance across the building envelope, identify the cause of air flow and pressure imbalances, and understand the interacting relationships between building airtightness, air flows, pressure differentials, HVAC equipment, indoor air quality, ventilation, and energy consumption. Visual inspection of all accessible building areas is also a key part to complete the building site testing. Visual inspection serves to identify air leak pathways in the building and air distribution system, locates the primary thermal barrier, helps identify different zones within the building, and verifies building construction materials and practices. Testing was repeated in this building after duct repair.
4.1 Building Airtightness Testing
The first step in the diagnostic process is the building airtightness test. The building was prepared by turning off all air moving equipment and sealing the exhaust fan opening. A multi-point airtightness test is performed (ASTM E 779-87, "Standard Test Method for Determining Air Leakage Rate by Fan Pressurization"), using calibrated fans to obtain air flow at six to eight building pressures in the approximate range of -0.060 in.WC (-15 Pa) to -0.241 in.WC (-60 Pa) depressurization. (Note that all pressures expressed in this paper are with respect to outdoors unless otherwise indicated). Using a software program, the multi-point building pressure and airflow data are used to calculate CFM50, the airflow rate of air coming through leaks when the building is at 0.201 in.WC (50 Pa). Knowing the building airtightness assists in interpretation of other field testing. CFM50 is a measure of the absolute airtightness. It can be normalized by building size to obtain ACH50 which is a measure of the relative airtightness. ACH50 is obtained by dividing CFM50 by the building air volume and multiplying by 60 to convert to units of hours. ACH50 is useful in comparing the tightness of different buildings.
The office CFM50 was 2241 (1058 l/s @50 Pa) and ACH50 was 9.3, indicating a moderately tight commercial building (Cummings et al. 1996). The average for 69 small commercial buildings was ACH50 = 16.7 (Cummings et al. 1996).
The accuracy of the blower door equipment is +/- 3% with a repeatability of +/- 1%. Two significant factors in measurement accuracy are temperature differential between indoors and outdoors and wind. The temperature difference between indoors and outdoors was 7 degrees F (3.9C) during testing. Testing was done with wind speeds not exceeding 10 miles per hour ( 16.1 km/h) to reduce measurement errors associated with wind. During testing, the wind speed was an average of 2 miles per hour (3.2 km/h) with a maximum gust of 3.8 miles per hour (6.1 km/h). The correlation coefficient (r) of the building pressure versus airflow (multi-point data) was 0.9972. In the authors experience it is common for the correlation coefficient of a building tightness test to be about 0.99 on days with very light winds.
4.2 Identification of Building Air Barriers
With the building depressurized to -0.201 in.WC (-50 Pa) by the calibrated fan, pressures in various zones of the building are measured in order to know which portions of the building are within the building air barrier and which are not. Consider an example; if the ceiling space is -0.020 in.WC (-5 Pa) when the occupied space is -0.201 in.WC (-50 Pa), this indicates that the ceiling space is reasonably well ventilated to outdoors, and that the ceiling is the primary air barrier. (The ceiling may be the primary air barrier even though the ceiling itself is quite leaky. Being the primary air barrier simply means that it is more airtight than the ceiling space is to outdoors.) It also indicates that the ducts, when located in the ceiling space, are in a zone that is outdoors. Therefore, to diagnose UAF, it will be more important to measure duct leakage.
The office primary air barrier was located at the roof deck and walls. When the building was depressurized to 0.201 in.WC (50 pa), the attic space was depressurized to 0.173 in.WC (43 pa). This shows that the suspended t-bar ceiling provides much less resistance to air flow than the ventilated attic. In other words, the ceiling is leaky. This type of ceiling is very common in office buildings (Cummings et al. 1996). Of 70 buildings studied, 57 had suspended t-bar ceilings. It is important to note that these 70 commercial buildings were 33% more leaky than a sample of 99 residences (Cummings et al. 1991). Leaky t-bar ceilings with vented ceiling spaces or attic spaces above are the primary cause for leaky buildings. The ceiling in this real estate office is a problem because the space above it is unconditioned and it allows a significant amount of air to travel to or from the ceiling space when pressure differences exist.
Five mechanisms exist to move air across this leaky ceiling plane;
-
Wind can cause pressure differences as it moves over and around the building.
-
Opening and closing interior and exterior doors can pump air across the ceiling.
-
Operating the air handler when interior doors are closed creates high pressure in the closed rooms and negative pressure in the central zone where the single return is located. Air is pushed into the attic from the closed rooms and pulled into the central zone from the attic.
-
Supply leaks depressurize the occupied space, thus causing attic air to be pulled into the occupied zone.
-
The attic exhaust fan depressurizes the attic and therefore causes air to flow from the conditioned space to the attic (in the absence of very large supply leaks).
4.3 Duct System Airtightness Test
Airtightness of the duct system was measured using a calibrated fan (duct test rigs or duct testers). The air handler was turned off and all registers except one supply and one return were masked off. Outdoor air is normally masked off, but there was no need to do this since the building had no mechanically provided outdoor air. Duct testers were attached to the open registers and a barrier was placed in the air handler at the blower to divide the system into supply and return. Air was drawn from the duct system by the tester and a multi-point airtightness test was done with each side of the system at the same pressure (duct pressure was measured near the air handler and referenced to the zone in which the ducts were located). CFM25 (air flow in cubic feet per minute through leaks in the duct system when the ducts are at -0.100 in.WC (-25 Pa)) was determined for both the supply and the return side of the system. The combined CFM25 (add supply and return sides together) represents leakage to outdoors, unconditioned building space, and conditioned building space, and can be expressed as CFM25TOTAL. The CFM25TOTAL was 571 (270 l/s@25 Pa) which indicates an extremely leaky duct system (Cummings et al. 1991 ) ! Almost all the duct leakage was from supply leaks located in the attic space. Only 49CFM25 (23 l/s@25 Pa) was from return leaks, and all of this was from air handler leaks to the closet.
The accuracy of the duct testing equipment is +/- 3%. Testing was done with wind speeds not exceeding 10 miles per hour (16.1 km/hr) to reduce measurement errors associated with wind. During the duct tightness testing, the average wind speed was 2.5 miles per hour (4.0 km/h) with a maximum wind gust of 5 miles per hour (8.1 km/h) The correlation coefficient (r) of the duct pressure versus airflow (multi-point data) was 0.9989. It is common for the correlation coefficient of a duct tightness test to be at least 0.99 in the experience of the authors.
4.4 Pressure Differentials
Using digital manometers, pressure differentials were measured in the
building with the building and HVAC systems in various modes of operation.
The basic approach is to characterize pressures in the building and
various zones of the building with air handlers and exhaust fans turned
on (normal operation) and turned off, and with various doors open and
closed. The primary objective is to characterize the effect of the air
moving equipment on building and zone pressures, since negative pressure
can draw pollutants from the soil, back draft combustion equipment,
draw humid outdoor air into building cavities, and cause excessive ventilation
rates.
Pressure in rooms with doors closed had a range from 0.010 in. WC
to 0.016 in.WC (0.4 Pa to 2.4 Pa) with respect to the central zone of
the building, while the air handler operated. Central zone pressure
was approximately -0.024 in. WC (-6 Pa) with respect to outdoors with
all interior doors closed. The air handler closet was the only space
depressurized with respect to the main body. It was depressurized to
0.004 in.WC (1.0 Pa) with respect to the central zone as a result of
air handler leakage. The storage closet was the only place in the building
that had a sheet rock ceiling so it was more airtight than the other
rooms which all had suspended t-bar panel ceilings. Based on inspection
of the closet, it is believed that the air pulled from the closet through
air handler leakage was replaced primarily by conditioned air moving
through the door undercut.
Building pressure with respect to outdoors was -0.018 in.WC (-4.4
Pa) with the air handler on, and -0.007 in.WC (-1.7 Pa) with it off
when all interior doors are open. When the air handler and the attic
exhaust fan were both on, building pressure became -0.057 in.WC (-14.3
Pa). Interestingly the attic pressure was positive with respect to the
occupied space at 0.0024 in.WC (0.6 Pa). Turning the air handler off
and leaving the attic fan on caused the attic to be depressurized 0.0020
in.WC (0.5 Pa) with reference to the occupied space.
Pressures were measured with digital differential pressure gauges that were accurate to +/- 1 % of reading or +/- 0.2 Pa (whichever is greater). The pressure gauges had an auto zero feature that eliminated the potential for a reading of long-term measurement to drift over time.
4.5 Infiltration/Ventilation Rates
Using tracer gas decay methodology (ASTM E 741, "Standard
Test Method for Determining Air Leakage Rate by Tracer Dilution"),
the building infiltration/ventilation rate was measured, once with the
HVAC equipment operating and then again with the HVAC equipment turned
off. The instrument used to measure tracer gas passes an infrared beam
of energy through the tracer gas in a controlled volume within the instrument.
Energy from the beam becomes absorbed to varying degrees depending on
how great the concentration of tracer gas is. Temperature changes can
cause readings to drift over time so the instrument was taken outside
to adjust the zero reading immediately before the first and last readings
taken and every ten minutes during the testing period. The drift was
typically less than 0.3 parts per million every ten minutes. The accuracy
of the gas analyzer used is +/- 5 % of reading according to calibration
work completed by the manufacturer. The air changes per hour (ach) of
the building was calculated based on the change in gas concentration
from the beginning to the end of the test period since the tracer gas
decay method was used. Therefore the measurement accuracy, while important,
has less impact on the accuracy of the calculated ach.
Initial tests measured air change rates of 0.19 with all mechanical
air moving devices off, 0.20 ach with air handler on only, and 0.87
ach with the air handler and the attic exhaust fan on. Considering that
there were large supply duct leaks in the attic, the infiltration rate
with only the air handler on is significantly lower than expected. This
can be explained by large duct leaks that dumped air into the attic
space which is inside the primary air barrier of the building. As a
result, the supply leaks depressurized the occupied space by 0.018 in.WC
(4.4 Pa) with respect to the attic, thereby causing attic air to be
drawn into the occupied space. Since this transfer of air between the
occupied space and the attic occurred within the primary building air
boundary, little air from outdoors was introduced as a result of the
duct leakage. Therefore, the duct leaks were creating very large energy
penalties without providing additional ventilation. It is interesting
to note that during the tracer gas test, concentrations of tracer gas
were essentially the same in the occupied space and attic.
4.6 Air Flow Rates
Air distribution and exhaust air flows were measured in the real estate office. Air handler air flow was 1313 cubic feet per minute (cfm) (620 l/s). This is 287 cfm (135 l/s) below the typical rated air flow for a 4 ton system, but is not uncommon for old systems that have dirty coils and fans. The attic exhaust was measured using an air flow hood and had a flow rate of 730 cfm (345 l/s). The two eave vents transferred a total amount of 450 cfm (212 l/s) into the attic from outdoors. This indicates that approximately 280 cfm (132 l/s) was pulled from the conditioned space by the attic fan.
Air flow was measured using an air flow hood with an accuracy of +/- 3% of reading in a measurement range of 25 to 2500 cfm for supply flow and 25 to 1500 cfm for exhaust flow.
5. Monitoring
Building monitoring to assess the impacts of UAF retrofits in this office was conducted during one cooling season. The retrofits were implemented about five to six weeks apart.
5.1 Variables Monitored
An on-site data logger was used to record building and outdoor ambient variables. Building variables such as air conditioner energy use; room and attic dry bulb temperatures, indoor relative humidity and indoor pressure differentials. Carbon dioxide concentrations were measured as an indication of the ventilation rate per person. Air conditioner operational temperatures were monitored to indicate a change in performance resulting from something such as a loss of refrigerant over time. This was accomplished by recording the return and supply temperatures only when the cooling system was operating. Outdoor environment conditions of dewpoint and dry bulb temperature, wind speed and solar radiation were collected at a site approximately 15 miles from the monitored building.
5.2 Calibration
The monitoring equipment and sensors were calibrated in the lab before field installation. Carbon dioxide sensors were calibrated against certified gas mixtures. Relative humidity sensors were calibrated in environmental chambers using chilled mirror hygrometers as the standard. T-type thermocouples were spot checked, but in general have been found to provide accuracy within +0.3 F. Electric energy meters were calibrated against a bench-top power calibration meter. The energy meters have an accuracy of +/-2% of reading.
5.3 Data Transfer
All data were stored as 15 minute averages or sums. Data transfer occurred through modem and phone line that was installed solely for data transfer. A central computer system called the data logger daily at about 6 a.m., and downloaded site data to disk storage. Every data transfer was scanned for errors by comparing to prescribed boundaries. If bad data were detected, a second attempt to download data from the data logger occurred. Suspect data were marked.
A computer program was created to call the data logger, download data, and plot eight graphs containing 17 variables every twenty-four hours. These plots were automatically produced overnight and then reviewed daily to see that equipment was working well and to make note of any unusual circumstances. Such circumstances could be unusual thermostat settings for a particular time of day, air conditioning turned off or a faulty sensor. Hurricane Erin's 80 miles per hour (128.8 km/h) sustained wind on the building were noticed at this site. Electric power was lost for 1 day and the weather station tower was blown over. A site visit was made to repair the overturned weather station tower. The building did not suffer any damage from the hurricane.
6.0 Energy Savings Analysis
Cooling energy used was predicted by using a simple linear model calculated from monitored cooling energy used versus the temperature difference between outdoors and indoors. This method was compared to other multiple regression methods in different studies of monitored energy use in occupied residential buildings and it was found that little improvement could be made to the simple linear model (Parker et al. 1996). Parker performed the same analysis on an unoccupied residence monitored through a summer in south Florida (June 1, 1995 - September 30, 1995). The coefficient of determination for the unoccupied residence was 0.91. Additional analysis showed that choosing more than 12 days of continuous data from the overall summer data would produce the same regression line, but the variances were different.
The following steps were used to calculate the cooling energy before and after retrofits:
1. Monitoring data was screened so that only comparable days were used. Comparability was based on similar outdoor dry bulb temperature, outdoor dewpoint, solar radiation, wind, rain, and thermostat settings.
2. The 24 hour total cooling kWh consumed was plotted against the 24 hour average temperature difference between outside and inside. Plotting against the temperature difference helped to account for changes indoors such as t-stat setting changes (business and non-business hours settings).
3. Least - squares best-fit linear regression was performed on each series of monitored data (groups of data for each retrofit). The best-fit line provided the equation used to predict the cooling energy when the temperature difference was known.
4. The typical temperature difference between indoors and outdoors was derived using the 24 hour average typical outdoor temperature from TMY (typical meteorological year) data and the typical 24 hour interior temperature was known based on monitoring data. These two variables were used to derive the temperature difference
Figures 1 and 2 show daily total cooling energy used versus the daily average temperature difference between outdoors and indoors (Delta Temperature). Figure 1 shows the data for pre-repair, duct repair, and post- air conditioning change-out. The coefficients of determination (correlation coefficient in parentheses) for the linear regression analysis shown in Figure 1 are as follows: pre-repair 0.66 (0.81), after duct repair 0.72 (0.85), and after replacing the air conditioner 0.93 (0.96). The reason for greater variability in data before and after duct repair is unknown. Figure 2 shows data before and after the attic exhaust was turned off. The coefficients of determination for the linear regression analysis shown in Figure 2 are 0.93 (0.96) for fan on data and 0.84 (0.92) for data after the fan was turned off.
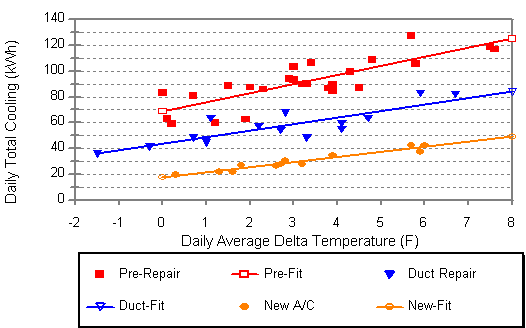
Figure 1 Daily total cooling energy before and
after repairs.
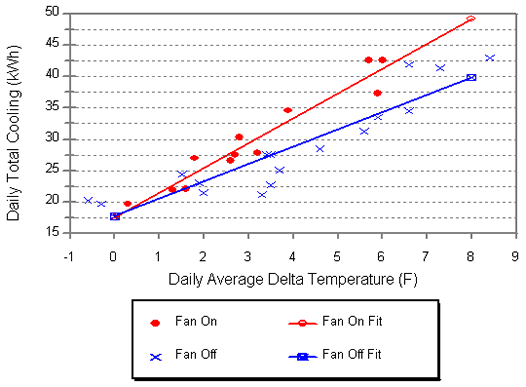
Figure 2 Daily total cooling energy during attic
fan on and off periods.
6.1 Percent Savings and Payback Calculation
Seasonal energy savings were calculated in the following manner. The least-squares, best- fit lines (cooling energy use vs temperature differential) were used in conjunction with 10 year meteorological data from FSEC weather station to calculate the expected cooling energy use. The 10-year average daily outside temperature and the average building indoor temperature were used to calculate cooling energy use that would occur for each day during a typical cooling season. Since monitoring took place primarily during the six warmest months of the cooling season, percent savings is based on a six month period starting May 1 and ending October 31. Daily energy use was summed over the entire six month period and divided by 184, the number of days in this period. Percent savings is calculated by dividing the difference between pre-repair and post-repair energy use divided by the pre-repair energy use.
Cost-effectiveness analysis is based on an eight month period from
mid March to mid November because it is reasonable to expect additional
savings from retrofits even after the six month cooling season in central
Florida. Using the same calculation method described in the preceding
paragraph, projected cooling energy savings were calculated for the
eight month period. This office normally operated six days a week, with
less cooling energy being used on Sundays because the thermostat was
set up from its business hours setting to 80 degrees F (26.7 C), and
there was also less internal heat generation with lights and office
equipment off. The observed cooling energy used on Sundays was lower
by an average of 41.7 percent. Therefore, the calculated cooling energy
used for Sundays throughout the eight-month cooling season was reduced
by 41.7 percent (since the linear equations are based on business days
only).
An overview of predicted energy savings is presented here; however
the savings from individual retrofits and the impacts from retrofits
on the ventilation, humidity, and building pressure are discussed in
more detail in the following section Building Retrofit Description and
Results. The predicted seasonal energy savings results are also summarized
in Table 1 and can be found in the Conclusions
section of this paper. The predicted energy savings in this building
were dramatic. The total retrofit package, duct repairs, AC change-out,
and turning off the exhaust fan, reduced cooling energy use by an estimated
$1341 per year. A review of past energy costs for this particular business
revealed a cost of $0.09/kWh which was used to calculate monetary savings.
This business does not pay demand charges. Given the total retrofit
cost of $3180, the simple payback period is 2.4 years. Looking at the
individual measures, duct repair pays for itself in 0.6 years, AC change-out
pays for itself in 5.4 years, and turning off the attic exhaust fan
pays for itself in 0.2 years (assume $50 service call).
6.2 Peak Electrical Demand Reduction Analysis
Demand analysis was performed by comparing demand profiles for comparable periods. The warmest days with similar pre-repair and post-repair conditions such as solar radiation, outside temperature, and difference between outdoor and indoor temperatures were chosen. Ten days were chosen for pre-repair, six for duct repair, five for impacts from the new air conditioner, and eight for turning off the attic fan. Once the sets of days were chosen, a composite 24 hour day was created of the cooling power and other variables for each monitoring period. The composite is constructed by averaging data for each hour of each day resulting in 24 values.
The peak demand for this office occurs during the three hour period from 2 through 4 PM daylight savings time (DST). However, since electric utilities in Florida experience their system peak later in the afternoon, we have chosen the period from 2 PM to 5 PM DST for comparison (note that afer 5 PM, building occupancy and use intensity varied considerably so that comparison of demand for the period after 5 PM would be considered unreliable). Figure 3 presents the cooling energy demand profiles. Table 2 presents cooling system demand for the period from 2 PM to 5 PM, including the attic exhaust fan power and can be found in the Conclusions section of this paper. This table also summarizes the average daily temperature outdoors, temperature differential between indoors and outdoors and the solar radiation per square meter. As a result of duct repair, demand decreased by 20 % from 6.5 kW to 5.2 kW. As a result of the air conditioner change-out, demand decreased by 35% from 5.2 kW to 3.4 kW. Turning off the attic fan decreased demand by 21 % from 3.4 kW to 2.7 kW. The total demand reduction from all three retrofits was 59%.
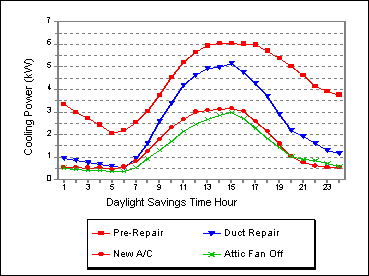 |
Figure 3 Daily composite of hourly cooling peak demand before and after retrofits. |
7. Building Retrofit Description and Results
Repair of UAF was planned for the middle of summer so that approximately comparable weather would occur during the pre-repair and post-repair periods. This building was monitored during three repair periods. It was monitored for six weeks as the building was found with an old inefficient heat pump, severe duct leaks, and the attic fan operating 24 hours a day. Then it was monitored for another four weeks after duct leakage repair, for six weeks following air conditioner change-out, and then for a final four weeks after the attic fan was turned off. The attic fan operated 24 hours a day because the thermostatic control it was connected to did not function properly.
7.1 Duct Repair
After the first six weeks, duct repairs were made and monitoring occurred for four more weeks. The most significant duct leakage sites were located by visual inspection. In some cases, leakage sites were also found by using smoke sticks while the air handler was on. After repairs were complete, the airtightness, pressure differential, and air flow tests were repeated. CFM25 in the ducts decreased by 80% from 571 to 112 (270 l/s@25 pascal to 53 l/s@25 pascal).
Cooling Energy and Demand Savings
The average cooling energy consumption (based on an eight-month cooling season) dropped from 99.6 kWh/day to 69.1 kWh/day resulting in savings of 31% from this repair. The repair required six person-hours and $30 in materials. Based on duct repair labor cost of $50 per person-hour, total estimated repair cost including materials was $330. At a rate of $0.09 / kWh, the projected cooling season savings of 5938 kWh yields monetary savings of $534 per cooling season and a payback after 7.2 cooling months. Cooling peak demand from duct repair resulted in a 20% reduction from 6.5 kW to 5.2 kW.
Impacts of Duct Repair on Ventilation, Humidity, and Building Pressure
Although severe duct leaks had been repaired, the indoor relative humidity remained high, and the building was still significantly depressurized. After duct repair the daily average relative humidity increased from 72% to 77%. The average weekday afternoon carbon dioxide levels stayed about the same at approximately 620 parts per million (ppm), the measured ventilation rate with the air handler on (and attic fan on )was 0.79 air changes per hour, and the monitored building pressure went from -0.057 in.WC (-14.3 Pa) to -0.064 in.WC (-15.9 Pa). The attic pressure with respect to the occupied space was -0.0020 in.WC (-0.5 Pa). This indicates a change in direction of pressure across the ceiling compared to the pre-repair period when it was 0.0024 in.WC (0.6 Pa).
7.2 Air Conditioner Replacement
The second retrofit was completed after duct repair at the request of the building owner. It involved replacing the existing inefficient (estimated SEER of 6.0) four-ton air conditioning system with one that had a SEER of 12.0. This condition was monitored for about four weeks.
Cooling Energy and Demand Savings
The average cooling energy consumption (based on an eight-month cooling season) dropped from 69.1 kWh/day to 39.7 kWh/day resulting in savings of 43%. The total cost for replacing the air conditioning system was $2800. Using a rate of $0.09 / kWh with the projected total savings of 5750 kWh over an eight month cooling season results in savings of $518 per cooling season and a payback period of 5.4 years. Peak electric demand (including attic fan power of 0.47 kW) was reduced by 35% from 5.2 kW to 3.4 kW.
Impacts of A/C Replacement on Ventilation, Humidity, and Building Pressure
As could be expected, no significant changes resulted in the carbon dioxide concentrations, ventilation rate, or building pressures from replacing the air conditioner. The daily average indoor relative humidity remained unchanged at 77%.
7.3 Disabling Attic Exhaust Fan
The third retrofit involved turning off the attic exhaust fan. Average cooling energy consumption (based on an eight-month cooling season) decreased by an additional 36%. The 14.3 kWh/day saved breaks down to 11.2 kWh/day from the exhaust fan motor and 3.1 kWh/day from a reduction in air conditioning energy. Savings over an eight month cooling season are projected to be 3208 kWh or $289. Assuming a service call cost of $50 for turning off the attic fan, the simple payback would be after two months. Peak electric demand (including attic fan power of 0.47 kW) was reduced by 21% from 3.4 kW to 2.7 kW.
Impacts of Disabling Attic Fan on Ventilation, Humidity, and Building Pressure
Turning off the attic fan produced dramatic impacts upon the office. The large driving force (pressure differential) causing air conditioned air to be sucked out of the occupied space and hot humid air to be drawn into the occupied space is gone when the fan is off. Table 3 is located in the Conclusions section of this paper and summarizes measured ventilation rates, relative humidity, and building pressures during initial, duct repair, and attic fan off monitoring periods. The natural air change rate (all mechanical equipment off) is not shown in Table 3, but was measured on a couple testing days and averaged 0.17 ach.
Building pressure decreased from -0.064 in.WC (-15.9 Pa) to -0.0024 in.WC (-0.6 Pa). This resulted in a large drop in the ventilation rate and the indoor relative humidity. The 24 hour average relative humidity levels plummeted from 77% to 61%. Relative humidity levels are shown in Figure 4 during a composite 24 hour day consisting of one business week of data. Each hour represents the preceding hour of gathered data. For example, hour 2 represents data gathered beginning at hour 1 and ending at hour 2. Non-business hours from 12 AM to 7 AM show the humidity drop from an average of 83% when the fan is on, to an average of 65% when the fan was off. During business hours from 11 AM to 5 PM, the relative humidity drops from an average of 68% when the fan is on to an average of 55% when the fan is off. The building ventilation rate decreased from 0.79 air changes per hour (ach) to 0.33 ach. Due to diminished ventilation, the peak carbon dioxide concentration increased from an average 614 ppm to 1054 ppm during weekday hours of 3 to 5 p.m. Figure 5 shows carbon dioxide concentrations during a composite 24 hour day consisting of one business week of data.
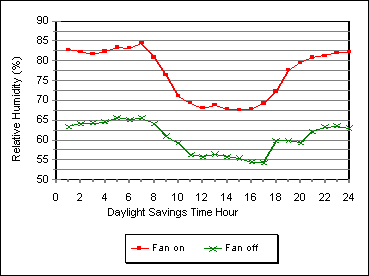 |
Figure 4 Daily composite
of indoor relative humidity before and after attic fan was
turned off. |
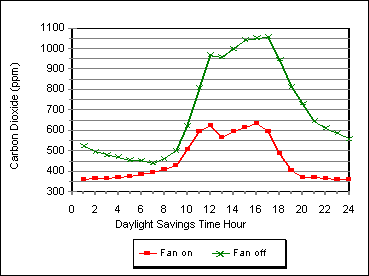 |
Figure 5 Daily composite
of carbon dioxide levels before and after attic fan was turned
off. |
Measured ventilation rates and carbon dioxide concentrations indicate that this office needs additional ventilation after duct repair and with the attic fan off to be in accordance with ASHRAE 62-1989. Typical occupancy during normal business hours is eight adults. According to ASHRAE 62-1989, the desired amount of ventilation air would be 20 cfm (9.4 l/s) per person which totals 160 cfm (76 l/s) for eight people. Infiltration testing by means of tracer gas decay indicated a total of only about 58 cfm (27 l/s) or just over 7 cfm (3.3 l/s) per person. A suggestion was made to the building manager to contact a qualified air conditioning and ventilation contractor to increase the ventilation rate, but no changes were desired to be made by the business during the time that monitoring was conducted. It was not desirable to turn on the attic fan because it increased the relative humidity significantly. A discussion of how the ventilation could have been provided follows.
One common solution to increase ventilation is to provide outside air directly into the air distribution system. In this application, a duct would run from outside to the return plenum. Filtered outdoor air would then be drawn into the air distribution system when the air handler was operating. Outdoor air flow of perhaps 160 cfm (71 l/s) would supplement the naturally occurring infiltration in the building. This would provide an overall ventilation rate that approaches the requirements of ASHRAE 62-1989 but should maintain relative humidity below 60% during most business hours. However, it is important to be aware that the overall ventilation would be smaller in the spring and fall because the air handler would run less of the time.
Providing outdoor air into the air distribution system would increase the ventilation rate and would provide another benefit. It would produce positive pressure in the occupied space. This would push air from the occupied space into the wall cavities, keeping them dry, and push air from the occupied space through the ceiling into the attic, preventing attic air from flowing to the conditioned space.
8. Conclusions
Three retrofits were performed on a real estate office (duct repair, air conditioner change-out, and turning off the attic exhaust fan). Considering all three retrofits together, cooling energy consumption was reduced by 74% or 74.2 kWh/day and peak electrical demand was reduced by 59% or 3.8 kW during the period from 2 PM to 5 PM. Repairing 80% of the duct leakage in this building reduced cooling energy use by 31% or 30.5 kWh/day and cooling peak demand reduction by 20% or 1.3 kW. The savings were substantial because the ducts were located outside the thermal barrier of the building. Change-out of the old 6-SEER air conditioning system to a 12-SEER unit produced a cooling energy reduction of 43% or 29.4 kWh/day and peak demand reduction of 35% or 1.8 kW. The last retrofit involved turning off the attic exhaust which reduced cooling energy by 36% or 14.3 kWh/day and peak demand reduction by 21% or 0.7 Kw.
With only duct repair completed, the building continued to be depressurized by the attic exhaust fan 24 hours a day. The fan provided a source of pressure differential across the ceiling, and the suspended panel ceiling in this office was not a good air barrier, resulting in airflow from the conditioned space into the attic. The conditioned air sucked out of the office was replaced by hot and humid outside air causing an increase in indoor humidity and cooling energy costs. The humidity problem was compounded by the fact that the thermostat was set higher after business hours. During nights, the run-time of the cooling system became reduced, causing a decrease in the total amount of moisture that could be removed. Meanwhile, the attic fan continued to pull moisture-laden air into the office building increasing the relative humidity of the air. During the four week period after the attic fan was turned off, the 24 hour average relative humidity levels dropped from 77% to 61% and the building ventilation rate (with air handler on) decreased from 0.79 to 0.33 air changes per hour. It appears that additional ventilation is required
Several interesting findings emerge from studying this building. First, energy waste and high indoor relative humidity can have multiple sources. It took a combination of all three retrofits to achieve the 74% cooling energy savings and to reduce the average indoor relative humidity to below 60 %. Second, when investigating problem buildings, it is important to characterize all of the uncontrolled air flow and HVAC problems that may exist. Identifying and fixing only a portion of the problems may not produce satisfactory results. All impacts from retrofits must be considered. Third, it is important to identify the location of air and thermal boundaries of the building. In this case, the roof deck of the vented attic was much more airtight than the suspended t-bar ceiling. As a consequence, the air flows and pressure differentials induced by the attic exhaust fan affected the occupied space almost as much as the attic space. Since the thermal barrier (ceiling insulation) was located at the ceiling, the attic environment was hot. When developing a retrofit plan, the air flows across leaky ceilings induced by duct leakage, closed interior doors, or other sources must be taken into account.
TABLE 1
Predicted Cooling Energy Savings and Cost Payback
Type of Repair |
Pre kWh/Day |
Post kWh/Day |
kWh/Day Saved* |
Percent Savings |
8 Month kWhSaved** |
8 Month $Saved** |
Repair Cost $ |
Payback Years |
| Duct Repair | 99.6 | 69.1 | 30.5 | 30.6 | 5938 | 534 | 330 | .6 |
| New A/C | 69.1 | 39.7 | 29.4 | 42.5 | 5750 | 518 | 2800 | 5.4 |
| Attic Fan Off *** | 39.7 | 25.4 | 14.3 | 36.0 | 3208 | 289 | 50 | .2 |
| Total | 99.6 | 25.4 | 74.2 | 74.5 | 14896 | 1341 | 3180 | 2.4 |
* kWh/day savings based on May-October.
** Annual cooling savings based on March 15- November 15, and assumes
cost of $0.09/kWh.
***Energy savings include attic fan energy of 11.2 kWh/day
TABLE 2
Cooling Energy Peak Demand (kW) Before and After Repair for Periods
Indicated.
Outdoor Temperature, Solar Radiation, and dT ( T outdoors - T indoors)
are 24 Hour Averages.
|
Type of Repair |
Pre Repair |
Post Repair |
Peak Demand Period
D.S.T. |
Peak Demand Reduction
kW |
Percent Reduction |
||||||||
# Days |
T out |
dT |
Solar (W/m^2) |
Peak kW |
# Days |
T out |
dT |
Solar (W/m^2) |
Peak kW |
||||
duct repair |
10 |
81.6 |
5.1 |
297.5 |
6.5* |
6 |
81.3 |
4.8 |
283.9 |
5.2* |
2-5 |
1.3 |
20.0 |
new a/c |
6 |
81.3 |
4.8 |
283.9 |
5.2* |
5 |
81.1 |
4.9 |
302.1 |
3.4* |
2-5 |
1.8 |
34.6 |
attic fan off |
5 |
81.1 |
4.9 |
302.1 |
3.4* |
8 |
82.7 |
5.7 |
295.6 |
2.7 |
2-5 |
0.7 |
20.6 |
| AVERAGE | 7 |
81.4 |
4.9 |
294.5 |
5.0 |
6 |
81.7 |
5.1 |
293.9 |
3.8 |
2-5 |
||
CUMULATIVE |
3.8 |
58.5** |
|||||||||||
* Peak demand includes AC and attic fan power.
** Cumulative percent reduction calculated as peak demand reduction divided by
product repair peak demand multilplied by 100.
TABLE 3
Impact of repair of uncontrolled airflow upon ventilation rates, indoor relative
humidity and building pressure with respect to outdoors when air handler is
on.
Relative humidity, and building pressure are shown as the daily average.
Type of Repair |
ach AH on |
RH% |
Big. Press. (In. WC) |
Attic Press. (Pascal) |
Attic Press. (In. WC) |
Attic Press. (Pascal) |
pre-repair |
0.87 |
72 |
-0.057 |
-14.3 |
-0.055 |
-13.7 |
duct repair |
0.79 |
77 |
-0.064 |
-15.9 |
-0.066 |
-16.4 |
Attic fan off |
0.33 |
61 |
-0.002 |
-0.6 |
-0.002 |
-0.6 |
9. Acknowledgments
The authors would like to acknowledge the Florida Energy Office as the source of funding of research that made this paper possible. We would like to thank Ed Cobham and other FEO staff for their support of uncontrolled air flow research.
10. References:
American Society of Heating, Refrigerating and Air-Conditioning
Engineers (ASHRAE). 1990
Ventilation for Acceptable Indoor Air Quality. ASHRAE Standard 62-1989.
American Society for Testing and Materials (ASTM). 1987. Standard test method
for determining air leakage rate by fan pressurization. ASTM Standard E779-87.
American Society for Testing and Materials (ASTM). 1983. Standard test method
for determining air leakage rate by tracer dilution. ASTM Standard E741-83.
Cummings, J.B., J.J. Tooley, N.A. Moyer, and R. Dunsmore. 1990. " Impacts
of duct leakage on infiltration rates, space conditioning energy use, and peak
electrical demand in Florida homes ", Proceedings of the ACEEE 1990 Summer
Study. Pacific Grove, CA.
Cummings, J.B., J.J.Tooley, and N. Moyer. 1990. " Radon Pressure differential
Project, Phase 1 ", FSEC-CR-344-90. Florida Solar Energy Center, Cape
Canaveral, FL, November 1990.
Cummings, J.B., J.J. Tooley, and N. Moyer. 1991. "Investigation of Air
Distribution System Leakage and Its Impact in Central Florida Homes " ,
Final Report to the Florida Governor’s Energy Office FSEC-CR-397-91,
Florida Solar Energy Center, Cape Canaveral, FL, January 31, 1991.
Cummings, J.B., C. Withers, N. Moyer, P. Fairey, and B. McKendry. 1996. " Uncontrolled
Air Flow in Non-Residential Buildings ", Final Report
to The Florida Energy Office FSEC-CR-878-96 Florida Solar Energy Center, Cape
Canaveral, FL, April 15, 1996.
Gammage, R.B., A.R. Hawthorne, and D.A. White. 1984. " Parameters
affecting air infiltration and airtightness in thirty-one east Tennessee homes ",
Measured Air Leakage of Buildings, Trechsel / Lagus, editors, ASTMSTP904, August
1986 from a symposium sponsored by ASTM, Philadelphia, PA, April 1984.
Modera, M.P. 1990. " Residential duct system leakage; magnitude, impacts,
and potential for reduction ", ASHRAE Transactions. Vol. 95, Pt. 2.
Parker, D.S. 1989. " Evidence of increased levels of space heat consumption
and air leakage associated with forced air heating systems in houses in the
Pacific Northwest ", ASHRAE Transactions. Vol. 95, Pt.2.
Parker, D.S., M.D. Mazzara,, J.R. Sherwin. 1996. "Monitored Energy Use
Patterns in Low-Income Housing in a Hot and Humid Climate ",
Presented at the Tenth Symposium on Improving Building Systems in Hot and Humid
Climates, May 13-14, 1996. FSEC-PF-300-96 Florida Solar Energy Center, Cape
Canaveral, FL.
Proctor, J., B. Davids, F. Jablonski, and G. Peterson. 1990. " Pacific
Gas and Electric Heat Pump Efficiency and Super Weatherization Pilot Project ",
Building Resources Management Co.
Withers Jr., C.R., J. Cummings, N. Moyer, P. Fairey, B. McKendry. 1996. " Energy
Savings from Repair of Uncontrolled Airflow in 18 Small Commercial Buildings ",
ASHRAE Transactions Vol. 102, Pt.2.
© 2007-2014 University of Central Florida. The Florida Solar Energy Center (FSEC)
is a research institute of the
University of Central Florida.
For more information about FSEC, please contact us or learn more about us.
Find us on Facebook!