

Reference Publication: Fairey, P. and Wichers, S. "Validation of EnergyGauge® USA Using the HERS BESTEST" submitted to Residential Energy Services Network. Florida Solar Energy Center, Cocoa, FL, December 15, 2004. Disclaimer: The views and opinions expressed in this article are solely those of the authors and are not intended to represent the views and opinions of the Florida Solar Energy Center. |
Validation
of EnergyGauge® USA
Using the HERS BESTEST
Philip
Fairey and Susan Wichers
Florida
Solar Energy Center (FSEC)
FSEC-DN-10-04
Abstract
This report presents results from the testing and validation of the EnergyGauge USA home energy rating software conducted using the HERS BESTEST procedures. The results show that EnergyGauge USA is an excellent and verifiable simulation program that is capable of meeting all national requirements for home energy rating software tools.
Table of Contents
- The HERS BESTEST Procedure
- The Test Cases
- Heating Load Results
- Cooling Load Results
- Heating Load Differential Results
- Cooling Load Differential Results
- References
HERS BESTEST (Judkoff & Neymark, 1995) is a verification procedure developed by the National Renewable Energy Laboratory (NREL) to determine the accuracy and effectiveness of the energy load prediction capability of software tools used for Home Energy Ratings. It uses a wide variety of building configurations and characteristics as test cases for the evaluation.
The procedure uses results from three, widely-used and well-validated, detailed building energy simulation software programs to develop a range of reasonable results for each of the test cases. The reference programs used to generate the test case results are as follows:
- BLAST 3.0, Level 215: Developed by the U.S. Department of Defense for use in analyzing energy efficiency improvements for their buildings.
- DOE2.1E-W54: Considered to be the most advanced of the programs sponsored by the U.S. Department of Energy and the technical basis for setting national building energy codes and standards in the United States.
- SERIRES/SUNCODE 5.7: A public domain program developed by NREL.
The results from these three reference programs are then statistically analyzed to determine the 90% confidence interval for each set of test case results. These 90% confidence intervals establish the range of acceptable results for each test case. The National Association of State Energy Officers' (NASEO) National Home Energy Rating Technical Guidelines and the Mortgage Industry's National Accreditation Procedures for Home Energy Rating Systems require that home energy rating software tools "pass" each test for each building configuration that the rating system software intends to evaluate.
The following test cases are provided by the HERS BESTEST procedure:
- Case L100: The Base Case Building. This is a 1539 sq.ft., single-story, wood-frame, fully-vented crawlspace home with 270 sq.ft. of single-glazed windows (distributed with 90 sq.ft. on the north and south faces and 45 sq.ft. on the east and west faces). The walls are insulated with R-11 insulation and the ceiling and floor are insulated with R-19 insulation. This is the case against which most other cases are compared to determine if the rating tool can accurately determine energy differences due to changes in building configuration.
- Case L110: High Infiltration (1.5 ach). Exactly the same as Case L100 with the exception of the infiltration rate, which is increased from its base case value 0.67 air changes per hour (ach) to a value of 1.5 ach.
- Case L120: Well Insulated Walls and Roof. Exactly the same as Case L100 except that the wall insulation is increased from R-11 to R-23 and the ceiling insulation is increased from R-19 to R-58.
- Case L130: Double-Pane, Low-Emissivity Windows with Wood Frames. Exactly the same as Case L100 except that the single-glazed windows are replaced with high-efficiency windows having an overall U-factor of 0.30 and an overall Solar Heat Gain Coefficient (SHGC) of 0.335.
- Case L140: Zero Window Area. Exactly the same as Case L100 except that the windows are replaced with wood frame walls having R-11 insulation.
- Case L150: South-Oriented Windows. Exactly the same as Case L100 except that the entire 270 sq.ft. of windows is moved to the south face of the home.
- Case L155: South-Oriented Windows with Overhang. Exactly the same as Case L150 except that an opaque overhang is added at the top of the south facing exterior wall. The overhang extends outward 2.5 feet and is positioned 1 foot above the top of the 5-foot high windows.
- Case L160: East- and West-Oriented Windows. Exactly the same as Case L100 except that all the windows are moved to the east and west faces of the building with 50% (135 sq.ft.) on each face. To prevent input error, EnergyGuage USA does not allow the total width of windows to equal or exceed the width of the wall they are located on. Therefore 1 foot was added to the east and west walls.
- Case L170: No Internal Loads. Exactly the same as Case L100 except that the internal gains are reduced from 68,261 Btu/day to zero.
- Case L200: Energy Inefficient. Exactly the same as Case L100 except for the following: Infiltration rate is increased from 0.67 ach to 1.5 ach, Exterior wall insulation is replaced by an air gap, Crawlspace floor insulation is removed, and Ceiling insulation is reduced from R-19 to R-11.
- Case L202: Low Exterior Solar Absorptance. Exactly the same as Case L100 except that the solar absorptance of the roof and walls is reduced from 0.6 to 0.2.
- Case L302: Uninsulated Slab-on-Grade. Exactly the same as Case L100 except that the floor system is changed from a fully-vented crawlspace to an uninsulated, concrete slab-on-grade.
- Case L304: Insulated Slab-on-Grade. Exactly the same as Case L302 except that R-5.4 exterior foundation insulation is added around the slab perimeter.
- Case L322: Uninsulated Basement. Exactly the same as Case L100 except that the floor system is changed from a fully-vented crawlspace to an uninsulated conditioned basement with 1-0" of the uninsulated basement wall and the uninsulated floor band joist exposed. This case is not used for cooling energy load results.
- Case L324: Insulated Basement. Exactly the same as Case L322 except that R-11 insulation is added at the inside of the basement walls and the floor band joist. This case is not used for cooling energy load results.
With the exception of Cases L322 and L324, each of the above test cases is simulated in Colorado Springs, CO to evaluate heating energy loads and in Las Vegas, NV to evaluate cooling energy loads.
Table 1 below consists of the 90% confidence intervals for the maximum and minimum ranges of allowable heating load predictions produced by the three reference programs compared against the heating energy load predictions of EnergyGauge USA in Colorado Springs, CO.
All EnergyGauge USA heating load results fall within the 90% confidence intervals required by national HERS standards.
Table 1 Annual Heating Load Results for Colorado Springs, CO |
|||
Test Case |
Range Minimum |
EnergyGauge |
Range Maximum |
L100 |
48.75 |
56.52 |
79.48 |
L110 |
71.88 |
79.10 |
103.99 |
L120 |
37.82 |
43.46 |
64.30 |
L130 |
41.82 |
44.74 |
53.98 |
L140 |
42.24 |
46.73 |
56.48 |
L150 |
40.95 |
48.95 |
71.33 |
L155 |
43.53 |
51.36 |
74.18 |
L160 |
48.78 |
57.00 |
81.00 |
L170 |
61.03 |
64.34 |
92.40 |
L200 |
106.41 |
125.25 |
185.87 |
L202 |
111.32 |
133.73 |
190.05 |
L302 |
56.12 |
57.67 |
86.90 |
L304 |
46.11 |
52.95 |
73.15 |
L322 |
73.71 |
98.25 |
111.69 |
L324 |
46.38 |
57.72 |
77.47 |
Heating Load Plots
Figures 1a and 1b below present the graphic representation of the data
contained
in Table 1 above.
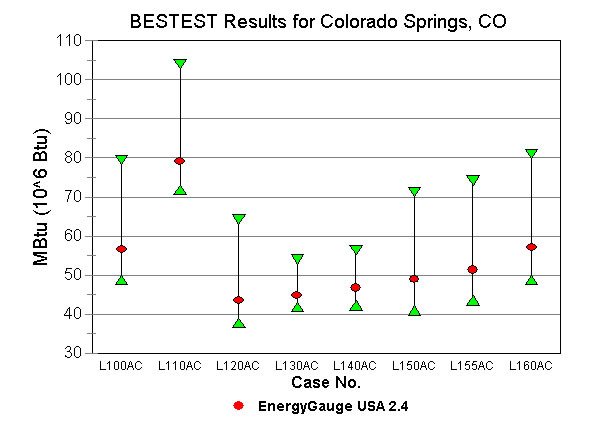
Figure 1a. Heating load results for test cases L100-L160 using EnergyGauge USA in Colorado Springs, CO.
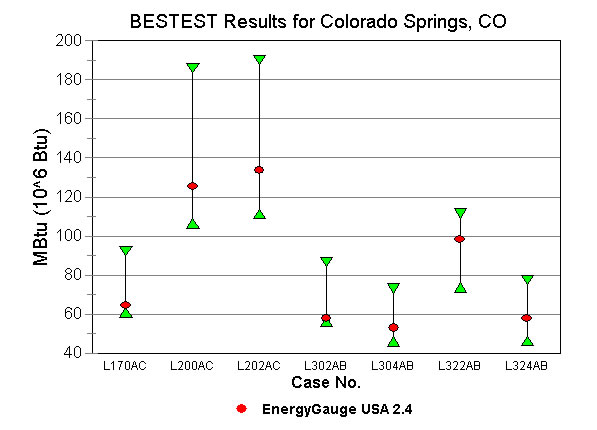
Figure 1b. Heating load results for test
cases L170-L324 using EnergyGauge USA in Colorado Springs, CO.
Table 2 below consists of the 90% confidence intervals for the maximum and minimum ranges of allowable cooling load predictions produced by the three reference programs compared against the cooling energy load predictions of EnergyGauge USA in Las Vegas, NV.
All EnergyGauge USA cooling load results fall within the 90% confidence intervals required by national HERS standards.
Table 2 Annual Cooling Load Results for Las Vegas, NV |
|||
Test Case |
Range Minimum |
EnergyGauge |
Range Maximum |
L100 |
50.66 |
54.50 |
64.88 |
L110 |
53.70 |
57.24 |
68.50 |
L120 |
47.34 |
50.14 |
60.14 |
L130 |
32.95 |
36.94 |
45.26 |
L140 |
19.52 |
24.69 |
30.54 |
L150 |
62.41 |
65.38 |
82.33 |
L155 |
50.08 |
52.84 |
63.06 |
L160 |
58.61 |
61.40 |
72.99 |
L170 |
41.83 |
41.89 |
53.31 |
L200 |
60.25 |
65.92 |
83.40 |
L202 |
52.32 |
53.50 |
75.95 |
Cooling Load Plots
Figures 2a and 2b give results from the cooling load tests using Las Vegas, NV as the climate.
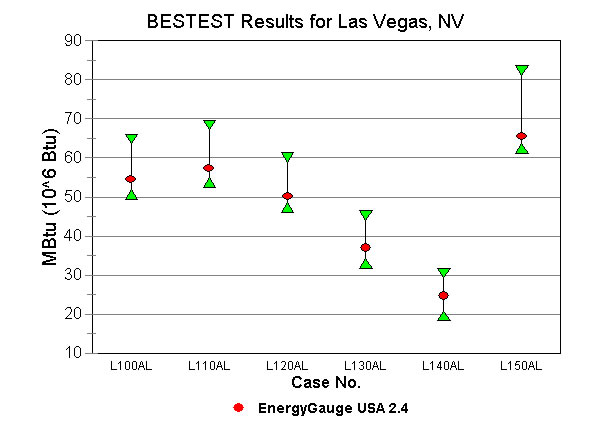
Figure 2a. Cooling load results for test cases L100-L150 using EnergyGauge USA in Las Vegas, NV.
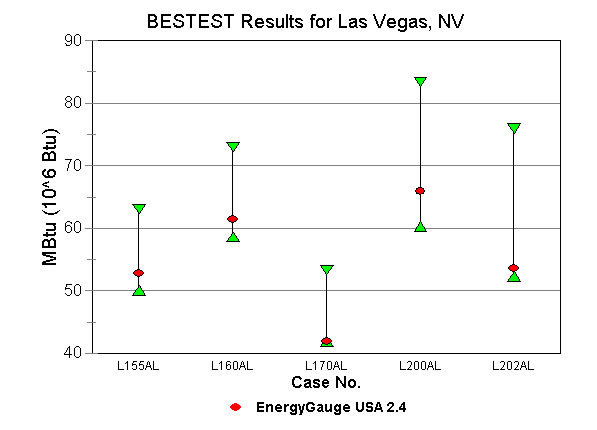
Figure 2b. Cooling load results for test
cases L155-L202 using EnergyGauge USA in Las Vegas, NV.
Heating Load Differential Results:
Table 3 below consists of the 90% confidence intervals for the maximum and minimum ranges of allowable heating load differential predictions produced by the three reference programs compared against the heating energy load differential predictions of EnergyGauge USA in Colorado Springs, CO.
All EnergyGauge USA heating load differential results save the ground contact results fall within the 90% confidence intervals required by national HERS standards. The ground contact results are highlighted in Table 3 and are examined in greater detail in the section entitled Comments on Slab and Basement Model Results.
Table 3 Annual Heating Load Differential Results for Colorado Springs, CO |
|||
L110-L100 |
19.36 |
22.58 |
28.12 |
L120-L100 |
-18.57 |
-13.06 |
-7.67 |
L130-L100 |
-27.50 |
-11.78 |
-5.97 |
L140-L100 |
-24.42 |
-9.79 |
-4.56 |
L150-L100 |
-12.53 |
-7.57 |
-3.02 |
L155-L150 |
-1.54 |
2.41 |
6.88 |
L160-L100 |
-3.72 |
.48 |
5.10 |
L170-L100 |
-7.12 |
7.82 |
17.64 |
L200-L100 |
56.39 |
68.73 |
107.66 |
L202-L100 |
-0.51 |
8.48 |
9.94 |
L302-L100 |
-3.29 |
1.15 |
14.50 |
L302-L304 |
5.66 |
4.72 |
17.75 |
L322-L100 |
15.17 |
41.77 |
39.29 |
L322-L324 |
21.25 |
40.57 |
28.22 |
Comments on Slab and Basement Model Results
Even though EnergyGauge USA falls within the BESTEST ranges for all individual load cases, it does not fall within all the ranges established for heating load differences. Table 3 shows that, for the slab (L302-L304) the difference is less than the minimum established by BESTEST and for the basement (L322-L100, L322-L324) differences, EnergyGauge USA load savings are greater than the maximum established by BESTEST. This result stems from the fact that EnergyGauge USA uses a slab and basement model published by LBNL (Winkleman, 1998) three years after the BESTEST procedure was developed. The reasons for these differences are not yet clear but they are being investigated and, if justified by the investigation, the ground model used by EnergyGauge will be adjusted in the future.
Heating Load Differential Plots
Figures 3a and 3b give results from the heating load differential (delta) tests using Colorado Springs, CO as the climate.
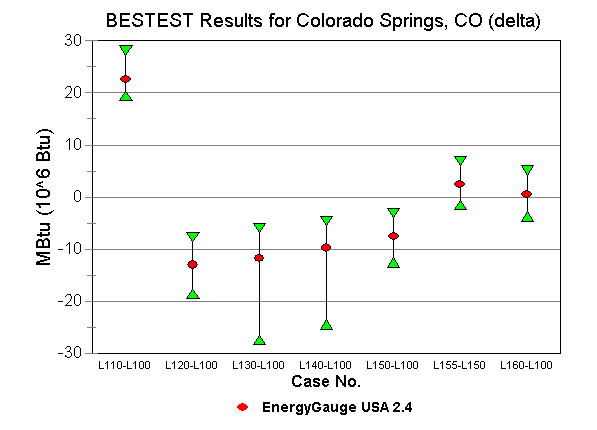
Figure 3a. Heating load differential
results for test cases L110-L160 using
EnergyGauge USA in Colorado Springs,
CO.
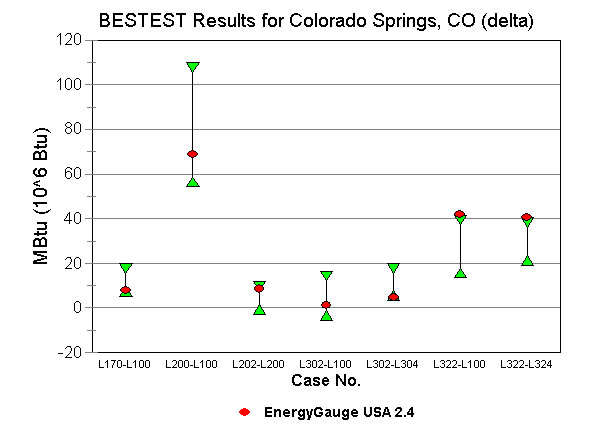
Figure 3b. Heating load differential
results for test cases L170-L324 using EnergyGauge USA in Colorado Springs,
CO. (See also Comments on Slab and Basement Model
Results above.)
Cooling Load Differential Results:
Table 4 below consists of the 90% confidence intervals for the maximum and minimum ranges of allowable cooling load differential predictions produced by the three reference programs compared against the cooling energy load differential predictions of EnergyGauge USA in Las Vegas, NV.
All EnergyGauge USA cooling load differential results fall within the 90% confidence intervals required by national HERS standards.
Table 4 Annual Cooling Load Differential Results for Las Vegas, NV |
|||
L110-L100 |
-0.98 |
2.74 |
7.84 |
L120-L100 |
-8.87 |
-4.36 |
0.68 |
L130-L100 |
-24.40 |
-17.56 |
-13.71 |
L140-L100 |
-38.68 |
-29.81 |
-27.14 |
L150-L100 |
8.72 |
10.88 |
20.55 |
L155-L150 |
-22.29 |
-12.54 |
-9.64 |
L160-L100 |
3.88 |
6.90 |
12.28 |
L170-L100 |
-15.74 |
-12.61 |
-4.83 |
L200-L100 |
6.63 |
11.42 |
21.39 |
L200-L202 |
2.03 |
12.42 |
14.86 |
Cooling Load Differential Plots
Figures 4a and 4b give results from the cooling energy load differential (delta) tests using Las Vegas, NV as the climate.
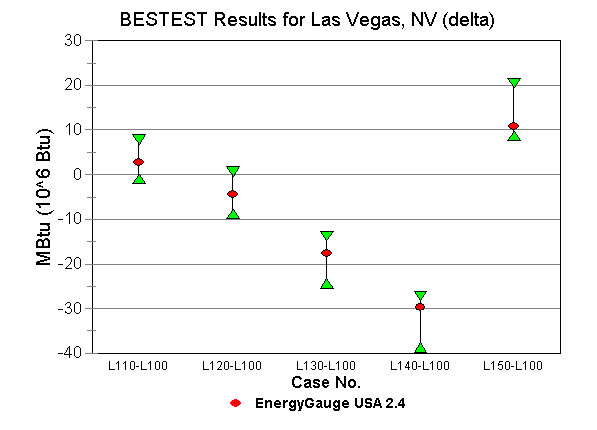
Figure 4a. Cooling load differential results for test cases L110-L150 using EnergyGauge USA in Las Vegas, NV.
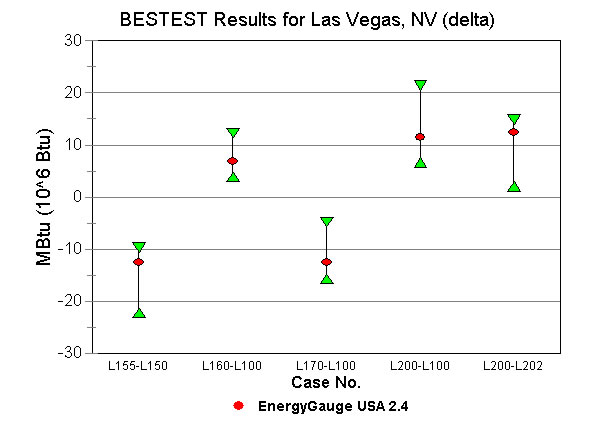
Figure 4b. Cooling load differential results for test cases L150-L202 using EnergyGauge USA in Las Vegas, NV.
Judkoff, R. and J. Neymark, 1995. "Home Energy Rating System Building Energy Simulation Test (HERS BESTEST)," Vol. 1 and 2, Report No. NREL/TP-472-7332. National Renewable Energy Laboratory, Golden, Colorado 80401-3393. (This document also available online at http://www.nrel.gov/publications/.)
Winkelmann, F., 1998. "Underground Surfaces: How to Get Better Underground Surface Heat Transfer Calculation in DOE-2.1E," DOE-2 USER News, Vol. 19, No. 1, p. 6- 13. Lawrence Berkeley National Laboratory, Berkeley, CA.
© 2007-2014 University of Central Florida. The Florida Solar Energy Center (FSEC)
is a research institute of the
University of Central Florida.
For more information about FSEC, please contact us or learn more about us.
Find us on Facebook!