

Reference Publication: Parker, D., Floyd, D., "Results from a Comprehensive Residential Lighting Retrofit," Submitted to Florida Energy Office, September, 1996. Disclaimer: The views and opinions expressed in this article are solely those of the authors and are not intended to represent the views and opinions of the Florida Solar Energy Center. |
Results
from a Comprehensive
Residential Lighting Retrofit
Danny
Parker and David Floyd
Florida
Solar Energy Center (FSEC)
FSEC-CR-914-96
Executive Summary
A single family
residence in Miami, Florida was used as a case study to determine how residential
lighting energy use could be reduced by substituting energy efficient lamps
and fixtures. The three person household was chosen based both on its high
utility bills and extensive use of interior lighting. A detailed audit
revealed 40 lamps or bulbs on 26 controls (switches) with a total connected
load of 2.5 kW.
All major energy using appliances in the home were sub-metered so that
lighting and other plug loads could be differenced from the measured total
power demand. Also, each of the individual lighting fixtures were metered
using time of use light loggers in the fall of 1995 so that the run time
each was used could be determined. The total household lighting use, estimated
by the light loggers was 4,050 kWh/year or about 23% of annual total consumption.
The metering revealed that outdoor lighting fixtures used the most electricity,
followed by lighting in the kitchen, garage and study. Fixtures in these
areas accounted for 80% of total lighting energy use.
The house was
monitored from May through mid December, 1995 in a baseline condition.
On December 11th, 27 various compact fluorescent lamps (CFLs) and other
more efficient lighting sources were substituted for the majority of incandescent
A-lamps in use. Motion sensor controls were provided for the exterior lighting.
The connected lighting load was dropped to 1.1 kW. The total hardware cost
for the retrofit was approximately $400.
The building was monitored in its altered condition through June of
1996 with the metered lighting and plug loads differenced with those
during the pre-retrofit period. The measured savings was approximately 6.8
kWh/day -- equal to a reduction in household lighting energy consumption
of some 61%. Figure
E-1 shows the metered before and after lighting and plug load energy
profiles along with the estimated savings. The lighting energy use reduction
is highest between 6 and 10 PM. A more conservative savings estimate, (obtained
by multiplying the per fixture light logger run hours by the changed lamp
wattage), calculated a savings of 5.2 kWh/day (47%) although no estimates
were available for the savings of the outdoor lighting system alterations
due to difficulties with the exterior light loggers in the post period.
Figure E-1. Average measured lighting and plug load demand profiles before and after retrofit. Pre period was June 20 - December 10, 1995. Post period was December 13, 1995 - June 20, 1996.
The intent of the project was to achieve the maximum lighting energy savings possible, rather than to produce the most economic savings levels. Nevertheless, based on the 47% - 61% savings experienced, the reduction has an annual value of $150 - $200 at current Florida utility prices. The simple payback for the project was between 2 and 3 years not counting the greater life of the more efficient lighting (CFL lamps typically have a service life of 10,000 hours). The study showed that economics could have been even better if the retrofit had concentrated on outdoor and kitchen lighting and other heavily used fixtures. Savings of approximately 30% could have been available for an investment of only $170. Such results indicate that extensive use of more efficient lighting technologies in Florida residential homes can produce very attractive energy savings for the average homeowner.
Introduction
For residential lighting tasks, compact fluorescent lamps (CFL) consume only a fraction of the electricity standard incandescent lighting demand for similar levels of illumination. CFLs fit in most standard fixtures and can be easily retrofit into a home.(1) Many previous studies have examined the potential of CFLs to reduce lighting energy use in residences, but to our knowledge no investigation has actually performed a comprehensive lighting retrofit and measured the energy use reduction.
The Florida Solar Energy Center (FSEC) recently completed such a study in a single family home in Miami, FL. The home was extensively monitored for a base period to obtain lighting power use for standard incandescent lighting. After this initial six month period, CFLs and other more efficient fixtures were installed throughout the home. Physical monitoring of each light fixture was used to determine reductions to lighting power consumption as well as long term metering over a six month post period.
Previous Studies
Annual residential lighting energy usage in Florida has been "guess-timated" at 1,000 kWh per household (SRC, 1992). However, because of associated practical difficulty with metering, few projects have measured lighting energy use in homes. A pilot study was conducted in 1991 by Pacific Power and Light to examine the residential lighting load, customer acceptance of CFLs, their cost effectiveness, and the maximum percentage of existing fixtures that could be retrofitted (Manclark, 1991). The study of 53 homes in Yakima, Washington showed that there were an average of 29 fixtures per house with a median fixture usage of 6% or 1 1/2 hours per day. The estimated annual lighting energy use from the study was 2,900 kWh although potentially biased due to the time of the year (winter) when the data were taken. The results showed that approximately 658 kWh per home, 23% of lighting use could be saved by replacing 30% of the incandescents with CFLs.
More recently, an ambitious monitoring project commissioned by the Bonneville Power Administration and Tacoma Public Utilities showed that the annual lighting energy use per household in 161 monitored sites was approximately 1,800 kWh/yr (Tribwell and Lerman, 1996). That study also found that lighting energy use varied seasonally. Consumption was 30% greater in winter months than in summer months. Approximately 23% of household fixtures were found to be on more than three hours per day.
Objectives
Three unique research questions were to be addressed by FSEC's residential lighting study:
1) Time of day load profiles for lighting energy use would be developed by fixture. This was deemed important because Florida utililities are sensitive to the timing of energy end-use demand.
2) An actual retrofit of fixtures would be performed with lighting energy use measured before and after the retrofit.
3) The potential interaction between space cooling use and interior lighting consumption (internal heat gain) would be measured.
Description of the Test Site
 |
|
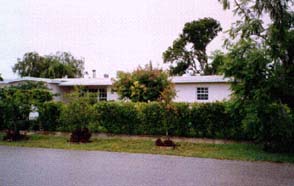
| Figure 1. South street exposure of study house. |
The site was selected based on a previous history of high energy bills. A review of utility records for the home in 1993 revealed a total annual energy consumption of 17,763 kWh -- quite high for a home with a natural gas-fired water heater and range.(2) A walk-through audit revealed that interior lighting was extensively used in the home, suggesting the site as a natural candidate for a lighting research project.
The home is occupied by two middle-aged adults and a ten year old child. The wife is home for portions of each week day tending a home business. The father is an English teacher at a local school and writes in his spare time. As such, he uses lighting in his study extensively during early morning and late evening hours. Both father and son are typically at school from 7 AM - 3 PM on week days. All family members are typically home on weekends.
Monitoring
In the spring of 1995, the site was fully instrumented to isolate the lighting loads and plug loads from other major loads. Refrigerator, dryer, heating and cooling electrical loads were metered in addition to total load.(3)
The sub-metering plan aimed to isolate miscellaneous plug loads and lighting by subtracting the major electrical end uses from total. Thus, if only lighting loads were altered, the differences in the estimated miscellaneous loads could be used to estimate lighting energy savings based on a pre and post retrofit monitoring protocol.
A comprehensive lighting inventory of the house was performed in August of 1995 as summarized in Table 1. The location of the fixtures on a rendering of the house floor plan is shown as Figure 2. The home was found to contain 40 different lamps under 26 controls (switches). In general, the lighting consisted of various incandescent 4-lamps of various sizes. The total connected lighting load was 2.5 kW. Obviously, however, not all lighting is powered at any one time. Thus, a key part of the monitoring protocol was to learn the distribution of "on-time" of both the overall household lighting system, as well as that for individual fixtures. Monitoring of the home in the baseline condition began on April 27th, 1995. A graphical example of 15-minute data collected from the site on September 7, 1995 is shown in Figure 3. In the sample, morning and evening elevations in the measured electric load are clearly visible.
Figure 2

Figure 3. Measured household electricity use on Sept. 7,1995. Lighting and miscellaneous loads are in the middle.
Table 1
Study Household Lighting Inventory
| Switch | Area | Lamp/Fixture | Total Watts | Replacement Type |
|
1
2 3 |
Kitchen
Counter Lighting Overhead Lighting Under Counter Lighting |
60 W Incand. Globes (2)
100 W, 60, 25 Incand. (3) 20 W FL Tube |
120
180 20 |
15 W CFL (3)
30 W Circline. (1) ---- |
|
4
5 |
Dining
Over Table Aquarium Incand. Lamp |
50 W Halogen*
25 W Incand. |
50
25 |
---
11 W FL |
|
6
7 8 9 |
Living
Room
Floor Lamp Overhead Ante Room Table Lamp Table Lamp |
75 W Incand.
60 W Incand. Globe 75 W Incand. 100 W Incand. |
75
60 75 100 |
15 W CFL
18 W CFL 22 W Circline 22 W Circline |
|
10
11 |
Florida
Room
Overhead Dining Table Lamp |
60 W Incand. Globe
100 W Incand. (2) |
60
200 |
15 W CFL
22 W Circline (2) |
|
12
13 14 |
Study
Desk-top Lamp Portable Swing Lamp Table Lamp |
100 W Incand.
13 W CFL 75 W Incand. |
100
13 75 |
15 W CFL
---- 22 W Circline |
| 15 | Hallway
Overhead Lamp |
60 W Incand. | 60 | ---- |
| 16, 17 | Bedroom
2 Table Lamps |
60 W Incand. (2) | 120 | 22 W Circline (2) |
| 18, 19 | Master
Bedroom
2 Table Lamps |
60 W Incand. (2) | 120 | 42 W Halogen (2) |
| 20 | Bath
Vanity Lamps |
55 W Incand. (4) | 220 | 15 W CFL (3) |
| 21 | Master
Bath
Vanity Lighting |
60 W Incand. (3) | 180 | 40 W I Globes (3) |
|
22
23 24 |
Garage
General Overhead Desk Lamp Garage Door Lamp |
100 W Incand. Globe (1)
100 W Incand. (1) 55 W Incand. (1) |
100
100 55 |
15 W CFL
22 W Circline 42 W Halogen |
|
25
26 |
Outdoor
Lighting
Front Porch Back Porch |
60 W Incand. Globe
65 W PAR (4) 75 W PAR 75 W PAR |
60
130** 75 75 |
60W I (2)***
45 W PAR |
 |
|
| Figure 4. Over sink lighting in the house kitchen. 180 W incandescent fixture was ON an average of 10.6 hours per day. Retrofit with 30 W Circline fluorescent. |
** Two of the PAR lamps were burned out at the time of the retrofit
*** Occupant changed the fixture to a two bulb 60 W exterior type at time of retrofit
Total
Lamps = 40 Lamps, 26 Controls
Total Wattage = 2,483 W = 2.5 kW
Total Retrofit Wattage = 1,121 W
One problem with the subtraction method of monitoring (major end uses are subtracted from total load) is that the residual loads left over comprise lighting as well as numerous other plug loads. At the study site this includes three TVs, two VCRs, six ceiling fans, a home computer system, electric clocks, dishwashers, vacuum cleaners etc. Consequently, in addition to the electrical metering, individual time-of-use light loggers and plug loggers (Pacific Science & Technology TOU-L) were deployed on each of the lighting fixtures in the home to establish actual on-time of each. The central idea was to assess how the "pure" lighting loads compared with those determined by subtraction.
The light logger monitoring began on August 8, 1995. The availability of the lighting loggers made it necessary to capture the pure lighting loads by metering two groups of fixtures at different times. Figure 5 shows the average on-time of a fixture with incandescent lamps (180 Watts total) over the kitchen sink (Figure 4) in August and September of 1995.
The composite load from the light loggers was then aggregated by wattage for each room in the home.
The comparative data from the lighting and plug load data captured by the central data logger was then compared with that recorded by the individual lighting loggers. The two resulting load profiles are then compared in Figure 6. Predictably, the lighting and plug load from August 8th - December 10th (18.1 kWh/day) were greater than of the "pure" lighting loads (11.1 kWh/day). However, both profile shapes have an unmistakable similarity. The real surprise was the magnitude of the lighting load, estimated from the five month monitoring period at over 4,050 kWh/year!(4) Although large, this is not unreasonable since the maximum recorded in the Bonneville study was nearly 7,400 kWh/year (Tribwell and Lerman, 1996).
Figure 6. Comparative lighting and plug load profiles.
August 8 - December 10, 1995.
Even more enlightening than the total was where lighting electricity was consumed, shown in Table 2 and Figure 7. The table below shows both the average number of hours fixtures were used within the various rooms along with the fraction of the measured daily lighting energy that was used in each space. Similar to the Bonneville study, we found that outdoor and kitchen lighting comprise the largest fraction of total lighting consumption.
Table 2
Fraction
of Daily Electric Lighting Energy used by Room
August 8 - December, 10, 1995: (11.1 kWh/day)
Location |
Daily kWh |
Percentage |
Avg. No. Hours On Per Day |
| Outdoor
Kitchen Garage Study Dining Room Master Bedroom Bath Aquarium Lighting Bedroom Florida Room Living Room Master Bath Hallway |
3.73
2.56 1.34 1.09 0.59
0.28
0.22 0.21 0.19 0.09 0.06 |
33.6%
23.1% 12.1% 9.8% 5.3%
2.5%
2.0% 1.9% 1.7% 0.8% 0.1% |
10.1
8.0 13.4 6.8 5.3
1.3
1.8 1.1 0.9 0.5 1.0 |
Figure 7. Daily lighting demand profiles by room. August 8 - December 10, 1995
Major lighting energy use in a room or space does not always indicate
wasteful behavior. The housewife needs effective illumination of
the dark garage during daytime hours (no daylight) and the family
also prefers sufficient outdoor lighting at night for security
purposes.
 |
|
| Figure 9. A 22 W Circline was fitted into a table lamp in the Florida Room. |
Electric lighting loads can be expected to vary seasonally with day length. An early study of metered lighting and other miscellaneous end-use in a large sub-metered sample of homes in the Northwestern U.S. by Pacific Northwest Laboratories (PNL) demonstrated a 40% variation from a high in December to a low in June (Pratt et al., 1993). Moreover, the PNL research clearly identified lighting loads associated with holiday use being much greater in the month of December. Similarly, the recent Bonneville study showed 30% greater lighting energy use in winter versus summer months (Tribwell and Lerman, 1996). However, the seasonal fluctuation might be expected to be less in Florida at its lower latitude than in the Pacific Northwest. In Miami, the days are shortest (and nights longest) on the winter solstice on December 21st at 10.6 hours and longest on, June 21st, the summer solstice at 13.7 hours. This represents a difference in available seasonal daylight hours of approximately 23%.
Not surprisingly, we were able to verify that our site's lighting load varied considerably from summer to winter. Use of the monitored miscellaneous loads was deemed necessary when it became apparent that plugged holiday lighting electricity use was not inconsequential -- a fact not captured by the light loggers. Also, the data from the light loggers was not continuous over the entire period since the group of fixtures was split in half for the metering.
Figure 8 shows how the monthly lighting and plug loads varied. Note the greater loads in evidence from holiday lighting during the month of December along with the visible reduction associated with a ten day vacation in July. Monthly lighting and other plug loads at the test home varied by 57% throughout the year from the highest to lowest levels. However, eliminating July (vacation) and December (holiday) lighting drops the variation due to changing day length to 24% from June - November.
Figure 8. Monthly variation in metered lighting and plug
loads.
June - December 1995.
The magnitude of holiday lighting should not be underestimated. Lighting and plug loads at the home were 27% greater in December than the preceding month -- an increase suggesting holiday lighting may be as great as 3 - 4 kWh/day. The elevated load lead us to examine the electrical consumption of household Christmas lighting. Using a digital power analyzer we found wide variation in the electrical demand of several strings of lights tested and a total potential typical load for the holiday lighting of over 700 Watts .
Retrofit
Between December 10th and 12th of 1995, the lighting system in the home was changed out to the lamps and fixtures described in Table 1 (Figure 9). Twenty-seven new lamps or controls were installed at a hard cost of $405. The installation was timed to coincide with the winter solstice so that similar seasonal data could be obtained before and after the change. The connected household lighting load was dropped from 2.5 to 1.1 kW -- a reduction of 57%. Subsequent to the retrofit, the energy use continued to be collected by the data logger system so that differences in lighting loads could be recorded to examine savings.
Generally, CFLs were installed into interior fixtures which were used frequently and motion sensor control with PAR halogen lamps were substituted for exterior lighting. Infrequently used interior lighting or hard to fit fixtures had incandescent halogen bulbs substituted. The retrofit equipment manifest is given in Table 3.
Table 3
Lighting Retrofit Equipment List
Lamp/fixture |
Quantity |
Lumens (Lumens/Watt) |
Unit Cost |
Total Cost |
| 15
W CFL Globe
30 W Circline 22 W Circline 15 W Short CFL 18 W CFL 42 W Halogen Bulb 40 W Incand. Globe 45 W Halogen PAR 11 W FL aquarium lamp Motion sensor controls |
6
5 4 1 3
3 |
800
(50)
1550 (70) 900 (60) 1100 (61) 665 (16)
NA |
$14
$14 $16 $16 $3
$20 |
$70
$94 $80 $16 $6
$60 |
| Total | 27 |
$405 |
* Center beam candle power; rating for PAR type lamps
A Valhalla 2100 Digital Power Analyzer was used to perform spot checks on both the existing fixtures and the retrofit lamps to ensure that claimed wattages were approximately correct for both groups. Generally, we found the true power demand of the fixtures to be within 3% of UL rated values with no discernable systematic bias in either group of lamps. No attempt was made to verify the equivalency of manufacturer claims for lamp lumen output, although specific comparative information on CFLs was consulted from publications available from the National Lighting Product Information Program and other resources (Barrett, 1993; Davis et al., 1994).
User Acceptance
Some reductions to effective illuminance were used to reduce wattage in the retrofit, but only with the approval of the home owners. For instance, the wife of the family thought the bare 60W incandescent bulbs on the master bathroom vanity were too bright and asked for "something with a softer light" for the retrofit. Based on the light logger data for this fixture we knew that the vanity lighting was not typically left on for long periods of time. Thus, we substituted conventional 40W incandescent globes to meet both objectives of reduced wattage and lower light output. In other cases the light output from the newer fixtures actually increased; checks with the homeowners were useful to ensure satisfactory results.
 |
|
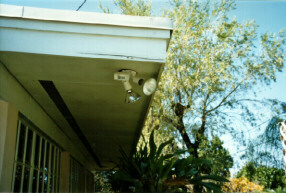
| Figure 10. Two of six PAR lamps on the home exterior which were retrofit a motion sensor control. Controls provided some savings in early evening hours. |
The family was dissatisfied with the outdoor lighting motion sensors until they realized that the light switch could be used to over-ride the controls keep the lighting on. Unfortunately, this proved to be a weak link in the overall retrofit since the altered front porch lighting was both increased in wattage and nearly always over-ridden during evening hours. Similarly, the outdoor lighting retrofit in the rear was compromised by a porch light which was over-ridden and left on from midnight until morning whereas it was not always left powered previously. The result of these actions was that the motion sensor retrofit saved little electricity except in the early evening hours.
 |
|
| Figure 11. New 5-inch triple tube 15 W CFL was able to fit in tight spots. |
Each of the fixtures and lamps to be altered were examined and physically measured before ordering equipment. This made for a relatively trouble-free installation. As usual, the need for very short CFLs was apparent during the retrofit. Fortunately, th
Installation of the exterior lighting motion sensors proved more difficult than anticipated due to the need to provide larger cutouts for the control boxes. In all, the retrofit took a single day to complete throughout the home. As such, it should be noted that the costs shown in Table 3 include nothing for project labor, which would significantly alter results. However, no labor costs were included since the retrofit is an easy do-it-yourself project for those interested.
 |
|
| Figure 12. The dining room fixture uses 50 W halogen lamp and could not be altered for lack of a dimming CFL substitute. The lamp is ON an average of 9.4 hours per day. |
In the monitoring, we encountered difficulties in using the light loggers on outdoor fixtures. A significant number of "false positives" were recorded on exterior fixtures where lighting on-time was correlated with daytime hours. At first we believed this could be avoided by using the available sensitivity setting to dull the photometric element into only operating when the lighting was powered. However, the sun can be very bright -- obviously brighter than the anticipation of researchers! Fortunately, this was corrected post hoc since the time-of-use loggers allowed us to examine the on-off patterns over the daily cycle. Another outdoor light logger was made ineffective when a dying moth, attracted to the fixture at night, fell onto the photo sensor element. Use of other sensing methods for outdoor fixtures, such as an available logger with a clip-on current transducer, is therefore recommended for anyone attempting to duplicate our research.
Other practical problems were associated with installation. The particular logger which we used has a status window which indicates whether the logger is sensing the lights are "ON" or not. Knowing this information is vital to proper set up of the equipment. Often the loggers are placed into fixtures after which the status "window" cannot be seen. We found that an inspection mirror helps to see around corners to make sure sensitivity measurements are working. We also learned of the danger of placing the loggers too close to lamps. By accident we melted one of the project loggers in the 180 W incandescent kitchen drum fixture (see Figure 13). Amazingly, the logger continued to take useful measurements for the entire period. Even so, such circumstances could create a fire hazard and reasonable precautions on sensor placement should be taken.
Figure 13. Time of use light loggers utilized in the project.
This particular unit
was melted by an incandesent fixture, yet continued
to collect data.
Savings
Savings from the retrofit were estimated in two ways. In the first method, the metered lighting and plug loads from June 20th - December 10th, 1995 pre period were compared with the same loads for the post period from December 13, 1995 - June 20 th, 1996. This comparison, which is shown as Figure 14 shows an average 6.8 kWh/day change over the period. Savings are concentrated in the hours between 7 AM and midnight and are highest between 8 and 10 PM. This is equivalent to a 40% reduction in the metered lighting and plug loads and a 61% reduction in the pure lighting load calculated to average 11.1 kWh/day. The annual savings equates to 2,480 kWh or about $200 at current utility prices ($0.08/kWh).
The second method of estimating savings from the project was more conventional.
The change in the wattage of each retrofit fixture shown in Table 1
was multiplied by the average number of daily hours of use shown for
each switch or control as taken from the deployed lighting loggers.
Unfortunately, the post period data for the motion controls was lost
for the outdoor rear fixtures when a dying moth fell onto the photo
sensor element obscuring its output only two days after it was deployed.
As previously described, the motion sensor control of the front porch
lighting was largely over-ridden and little savings were observed.
Thus, this method of estimating the savings is not able to account
for any change in the outdoor lighting from the retrofit. Also, light
logger data was not available for two altered fixtures due to a project
over sight. Thus, the estimate in Table 4, a 47% or 5.2 kWh/day reduction,
are biased low and can be considered a very conservative estimate.
Table 4
Light Logger Estimate of CFL Retrofit Savings
|
Fixture Description |
Fixture Power Reduction (W) | Recorded Use (Hours) | Daily Savings (kWh) |
| Kitchen Kitchen over sink Kitchen counter Total |
150 75 225 |
10.6 5.5 |
1.583 0.413 1.996 |
| Garage | 85 | 13.4 | 1.139 |
| Study Study table lamp Lamp #2 Total |
78 78 156 |
7.2 3.2 |
0.562 0.250 0.812 |
| Bedrooms M. Bedroom (west) M. Bedroom (east) Bedroom lamps Total |
18 18 152 188 |
5.0 3.5 1.8 |
0.090 0.063 0.278 0.431 |
Living
Room/Florida Room Living
room table (north) Living
room table (south) Florida
room dining |
78 53 45 78 78 11 347 |
0.5 1.9 1.2 2.0 0.1 1 4.7 |
0.039 0.101 0.054 0.156 0.008 0.205 0.561 |
| Bathrooms Master bath Guest bath Total |
60 175 235 |
0.5 1.3 |
0.030 0.223 0.250 |
| Total | 5.189* |
* Does
not include savings from outdoor lighting fixtures (motion sensors)
or from
living room floor standing lamp or garage table lamp retrofits.
Interaction with AC Demand
It was hoped that the influence on space cooling from the reduced lighting energy load could be observed as a by-product of the retrofit. However, examination of the summer data (June - August) pre and post lighting retrofit showed no statistically discernable change in cooling energy use. This is believed due to a continuing drop-off in air conditioner performance throughout the period. Examination of the unit in the summer of 1996 found that the air conditioning unit indoor air handler evaporator coil was becoming progressively more fouled with mold and mildew due to a low face coil air flow (680 cfm for a three ton unit). We believe this reduction in cooling system performance has masked the change in internal cooling loads within the building over the year. Unfortunately, this confounded our effort to measure the interaction of interior lighting and space cooling use.
Retrofit Economics
It should be noted at the outset that the original intent of the retrofit project was not to provide economic savings from a lighting retrofit, but rather to see what could be accomplished with readily available technology if maximum savings were desired. Regardless of this emphasis, however, the project showed good economics. The overall hardware cost, not including labor was about $400.
The annual estimated lighting energy savings based on the data from the light loggers was very conservatively estimated at 1,900 kWh per year; the estimated lighting energy savings based on the subtraction method was 2,480 kWh/year. The later value is more likely correct since it includes savings from changes to outdoor lighting and two fixtures missed by the light loggers and is based on longer time periods than the light logger estimates. With a current electric utility cost of $0.08/kWh, this equates to approximately $150 - $200 saved annually. The savings of lighting electricity use were 47 - 61% depending on the estimation method. This is quite close to the 57% value that Leslie and Conway (1993) estimated was possible in the Lighting Pattern Book for Homes. The simple payback is then approximately 2 - 3 years for a simple rate of return of about 40%.
Generally, in a residential retrofit, substitution of CFLs for incandescent lamps is recommended for fixtures that are used more than three hours per day. This recommendation is based on the relative economics of installing CFLs against the produced rate of savings. For instance a 15 W CFL substituted for a 60 W incandescent lamp will produce a savings of 49 kWh a year when burned for three hours a day. At $0.08/kWh and a $15 lamp cost the simple payback is 3.8 years and for an attractive simple rate of return of 26%. At two hours per day burn time, the numbers are still fairly attractive (5.7 yr payback and an 18% ROR). However, when lamps are used for short periods of time, the economics rapidly deteriorate. For instance, for a fixture only used an average of half an hour per day, the payback time increases to 23 years and a the rate of return to a sub-standard 4%.
Of course, this analysis is rather simplistic. It ignores the difference in replacement costs for the systems (CFLs typicially lasts ten times as long as incandescents) and interactions with the cooling system. However, the simple calculations give credence to the conventional wisdom. Although a two hour minimum might be a more realistic cutoff point.
Lessons Learned
The big problem with the importance of concentrating on heavily used lighting fixtures is knowing which fixtures are used more than two hours. In our study this was relatively easy since the individual fixtures were metered. However, most households will not have the benefit of such information. Fortunately, data from the 161 home study in the Pacific Northwest provides insight into the typical hours that fixtures are used daily in various rooms based on households.
Table 5
Average On-time for Selected Locations
Location |
Hours |
| Outdoor
porches Kitchens Outdoor yard/driveway Living rooms Bathrooms Bedrooms |
4.7 3.9 3.4 3.1 1.7 1.3 |
Source: Tribwell and Lerman, 1996.
The table shows good correspondence to the data taken in our own study and emphasizes the need for addressing outdoor lighting energy consumption. A simple rule of thumb would be that all incandescent outdoor lighting, that in kitchens and in living rooms would be good candidates for replacement. Of course circumstances differ in individual homes and this should only be used as a guide to provide a better match to actual needs.
Since the intent of our study was to achieve maximum possible savings, we chose to ignore such information and install CFLs where ever they could be fit. However, had we followed the above advice (change lighting outdoors and in kitchen and living room) the data from Table 1 and 4 show we would have achieved a savings of 3.3 kWh/day (30% reduction) at a cost of $168 for installing 11 CFLs.(5) Although this strategy would have missed lucrative opportunities in the garage and den, the overall performance would have been quite good-- a $96 annual savings and a 1.7 year payback.
The difficulty with acceptance of motion sensor controls and the lack of demonstrated savings suggests that such devices may not be a reliable substitute for more efficient lamps and fixtures. In particular, we could have obtained added savings of nearly 1 kWh per day by substituting two 15-W CFLs for the two 60 W incandescent lamps in the front porch light fixture which is left on an average of 10 hours each evening.
Persistence is often a question with residential CFL installations. Thus, we examined the state of the lighting retrofit six months after being installed. We found all but one of the lamps still in place, although some table and floor lamps had been moved in position. One halogen bulb had been broken when a bedroom lamp fell. However, these changes would not be expected to change the anticipated savings levels. Perhaps a greater issue is long-term persistence. Even with a 10,000 hour life, the most frequently used CFLs -- and those providing best economics -- will burn out and need replacement in 2 - 4 years.
Summary
A single family residence in Miami, Florida was used as a case study to determine how residential lighting energy use could be reduced by substituting energy efficient lamps and fixtures. A detailed audit revealed 40 lamps or bulbs on 26 switches and other controls with a total connected load of 2.5 kW.
All major energy using appliances in the home were sub-metered so that lighting and other miscellaneous loads could be differenced from the measured total power demand. Also, each of the individual lighting fixtures were metered using time of use light loggers in the fall of 1995 so that the time each was used could be determined. The metering revealed that outdoor lighting fixtures used the most electricity, followed by lighting in the kitchen, garage and study.
The house was monitored from May through mid-December, 1995 in its base condition. On December 11th, 27 various compact flourescent lamps (CFLs) and other more efficient lighting sources were substituted for the majority of incandescent A-lamps in use. Motion sensor controls were provided for the exterior lighting. The connected lighting load was reduced to 1.1 kW. The total hardware cost for the retrofit was approximately $400.
The building was monitored after the retrofit until June of 1996 with the metered lighting and plug loads differenced with those during the pre-retrofit period from June - December of 1995. The measured savings was approximately 6.8 kWh/day-- equal to a reduction in household lighting energy consumption of some 61%. The lighting energy use reduction is highest between 8 and 10 PM. A more conservative savings estimate, (obtained by multiplying the per fixture light logger run hours by the changed lamp wattage), calculated a savings of 5.2 kWh/day (47%) although no estimates were available for the savings of the outdoor lighting system alterations due to difficulties with the exterior light loggers in the post period.
Since the intent of the project was to achieve the maximum lighting energy savings, economics were not a fundamental objective. Nevertheless, the 47% - 61% savings measured has an annual value of $150 - $200 at current Florida utility prices. The simple payback for the project was between 2 and 3 years not counting the greater life of the more efficient lighting (CFL lamps typically have a median life of 10,000 hours). The study showed that economics could have been even better if the retrofit had concentrated on outdoor and kitchen lighting and lighting and other heavily used fixtures. Savings of approximately 30% would have been available for an investment of only $170. Our results indicate that extensive use of more efficient lighting technologies in Florida residential homes can produce very attractive energy savings for the average homeowner.
References
J. Barrett, 1993. Specifier Reports: Screwbase Compact Fluorescent Lamp Products, Rensselaer Polytechnic Institute, Troy, New York.
J. Byrne, 1994. "Energy Efficient Lighting for the Home," Home Energy, November/December, 1994.
K.M. Conway, 1994. "Lighting Makeovers: the Best is Not Always the Brightest," Home Energy, November/December, 1994.
R.G. Davis, Y. Ji and X. Luan, 1994. "Performance Evaluations of Compact Flourescent Lamps: What Does Equivalent Really Mean," Proceedings of the 1994 Summer Study on Energy Efficiency in Buildings, Vol. 3, p. 45, American Council for an Energy Efficient Economy, Washington, DC.
R. Leslie, K. Conway, 1993. The Lighting Pattern Book for Homes, Lighting Research Center, Rensselaer Polytechnic Institute, Troy New York.
B. Manclark, 1991. "Of Sockets, Housecalls, and Hardware", Home Energy, November/December, 1991.
R.G. Pratt, C.C. Conner, B.A. Cooke and E.E. Richman, 1993. "Metered End Use Consumption and Load Shapes from the ELCAP Residential Sample of Existing Homes in the Pacific Northwest," Energy and Buildings, Vol. 19, p. 179-193, Elsevier Sequoia, Netherlands.
Synergic Resources Corporation, 1992. Electricity Conservation and Energy Efficiency in Florida: Technical, Economic and Achievable Results, SRC Report No. 7777-R3.
L.S. Tribwell and D.I. Lerman, 1996. "Baseline Residential Lighting Energy Use Study," Proceedings of the 1996 summer Study on Energy Efficiency in Buildings, Vol. 3, p. 153, American Council on a Energy Efficient Economy, Washington, DC.
_________________________________________________________
Appendix A
Summary Description of Energy Efficient Residential Lighting Technology
Background
Energy efficient lighting for residential use includes technologies such as halogen or compact fluorescent lamps (CFL) to replace standard incandescent lamps. Halogen incandescent bulbs offer approximately a 10% improvement in luminous efficacy (lumens/watt) and may be appropriate for hard to fit or infrequently used fixtures. Energy efficient fluorescent lighting include T8 lamps in combination with an electronic ballast. Standard outdoor floods may be replaced with a more efficient high intensity discharge (HID) source such as high pressure sodium or metal halide. Controls such as motion sensors and photocells can be used with outdoor lighting fixtures for additional savings.
In order for the CFL technology to be more widely accepted in residences, there are several improvements that must be realized:
1) Physical limitations - Some of the longer, wider CFLs do not fit in table lamps. Some types of lamps and fixtures cannot be changed with anything except halogen bulbs.2) Light output limitations - Although a CFL may fit in a fixture, it may not give the equivalent light output as a standard incandescent in use. Light output also varies with position and studies have shown that in the base up position, the light output is actually lower than manufacturer's published rating (Davis et al., 1994).
3) Dimming: until recently, most CFLs could not be dimmed on a conventional rheostat. Thus, any applications where incandescents and dimmers are desirable, such as lighting for overhead dining, have not been amenable to change out.
Comparative Performance:
CFLs of an equivalent lamp illuminance have been shown to save up to 20-75% of per fixture energy use depending on the incandescent lamp being replaced. For example, if a 60-watt incandescent is replaced with a 15-watt CFL, a savings of 75% is possible. Halogen lamps can also provide similar energy savings when replacing standard PAR flood lamps with halogen floods. The T8/electronic ballast system can provide up to 30% savings when used to replace the standard T12/magnetic ballast system. HID lamps are the most efficient group of lamps on the market today. They can provide up to 75% savings over a standard outdoor incandescent flood while providing more light. However the poor color rendering of high pressure sodium lamps and the long restrike times present important drawbacks for residential applications. Motion or photometric controls may add further to total energy savings (Leslie and Conway, 1993).
Applicability in Residences:
CFLs may be used in table lamps and recessed cans in kitchens or hallways. Halogens lamps are used best for accent lighting such as a track system to light art work or to provide task lighting in a kitchen. Halogen floods and HID lamps with controls may be used outside to provide security lighting at night. The T8/electronic ballast system may be used in a kitchen for ambient lighting or under cabinet task lighting. Fluorescent lighting may also be a good choice in workshop areas.
Potential Economics:
Replacing standard lamps with energy efficient lamps in residences have the potential to save an average of 26% of lighting energy (Leslie and Conway, 1993). The CFLs cost about $10-$20 and have a long payback when burned for short periods of time. Halogen lamps can have a short payback period if they are used to replace standard incandescent lamps. The energy savings from replacing fixtures averages 57% of pre-retrofit use (Leslie and Conway, 1993). Although the savings are higher, the cost is also higher than a lamp replacement. Payback for CFL substitution for incandescent lamps is generally less than 3 years if used for three hours or more each day. The T8/electronic ballast system, HID lamps and hardwired CFLs are best used in new construction applications or with remodeling projects due to their high cost. A motion sensor/photocell unit costs $10-$40 and can offer an average of 45% savings depending on the pre-retrofit burn hours. All interior lighting energy reduction measures may have additional benefits in southeastern homes since the need for space cooling and/or discomfort may be reduced by the lower level of internal heat generation.
_________________________________________________________
Appendix B
Test of Electrical Consumption of Christmas Lights
A digital power analyzer was used to examine the wattage of several strings of commercially available Christmas lights. Five different strings of various types were tested. Line voltage was 121 V during the test. Each was classified as a "Decorative Lighting String" by UL and were manufactured in China or Thailand:
| Desctiption | Type | # of bulbs | Watts | W/bulb |
| 1)
Small clear bulbs (GE W2-35/50CL) |
Indoor/outdoor Rated: 36 W |
100 | 34.1 | 0.34 |
| 2)
Small "midget globe bulbs" |
Indoor Rated: 36 W |
50 | 11.0 | 0.22 |
| 3)
Small colored/clear bulbs (GW-W2-35/50) |
Indoor/outdoor Rated: 36 W |
100 | 33.4 | 0.33 |
| 4)
Colored light set C 7.5 5 W bulbs |
Indoor/outdoor Rated: 125 W |
25 | 128.0 | 5.12 |
| 5) Large 10 W C- bulbs | Outdoor Rated: 500 W |
50 | 504.4 | 10.17 |

David Floyd takes measurements of the wattage of tested strings of Christmas lights.
Our data showed that, irrespective of light output, the electricity use of each bulb varies by 46:1 from the highest to the lowest. In general, the miniature incandescent "W2" bulbs use only a fraction of the power of the more traditional "C"-candelabra-base bulbs. Since a typical Christmas tree may have at least 100 bulbs with twice as many outdoor strings, connected decorative lighting loads could vary from a low of 60 W up to 3000 W depending on the holiday lighting system types that are chosen.
1. See Appendix A for a short description of energy-efficient lighting technologies. A much more complete discussion is found in the November/December 1994 issue of Home Energy: Jeanne Byrne "Energy Efficient Lighting for the Home" and Kathryn Conway "Lighting Makeovers: The Best is Not Always the Brightest."
2. Typical electricity consumption for a house with such appliances in South Florida is approximately 12,000 kWh/year.
3. Measurement of air conditioning was considered important. A three ton heat pump provides heating and cooling for the home. It was hoped that the study might show the savings attributable to the lighting source change as well as any potential interactions with the space conditioning system. This was a reasonable expectation result since lower lighting energy use drops internal heat gain and hence space cooling needs.
4. On this basis, lighting is approximately 23% of the home's total electricity consumption.
5. This assumes that the front porch lighting would have ignored motion sensor control and used two 15W CFLs substituting for the 60 W incandescent lamps currently being used there. These lights are powered an average of 10 hours per day.
* Submitted to:
Florida Energy Office
2740 Centerview Dr.
Tallahassee, FL 32399
© 2007-2014 University of Central Florida. The Florida Solar Energy Center (FSEC)
is a research institute of the
University of Central Florida.
For more information about FSEC, please contact us or learn more about us.
Find us on Facebook!