

Reference Publication: Sonne, J K, D S Parker and J R Sherwin (2002). Flexible Roofing Facility: 2001 Summer Test Results. FSEC-CR-1336-02. Florida Solar Energy Center, Cocoa, FL. Disclaimer: The views and opinions expressed in this article are solely those of the authors and are not intended to represent the views and opinions of the Florida Solar Energy Center. |
Flexible Roofing Facility: 2001 Summer Test Results
Jeffrey
K. Sonne, Danny
S. Parker, John R. Sherwin
Florida
Solar Energy Center (FSEC)
FSEC-CR-1336-02
Notice
This
report was prepared as an account of work sponsored by an agency
of the United States government. Neither the United States government
nor any agency thereof, nor any of their employees, makes any warranty,
express or implied, or assumes any legal liability or responsibility
for the accuracy, completeness, or usefulness of any information,
apparatus, product, or process disclosed, or represents that its
use would not infringe privately owned rights. Reference herein to
any specific commercial product, process, or service by trade name,
trademark, manufacturer, or otherwise does not necessarily constitute
or imply its endorsement, recommendation, or favoring by the United
States government or any agency thereof. The views and opinions of
authors expressed herein do not necessarily state or reflect those
of the United States government or any agency thereof.
Acknowledgment
This work is sponsored, in large part, by the U.S. Department of Energy, Office of Building Technology, State and Community Programs under cooperative agreement no. DE-FC36-99GO10478. This support does not constitute an endorsement by DOE of the views expressed in this report.
The authors
appreciate the encouragement and support from George James, program
manager in Washington DC and Keith Bennett, project officer in Golden,
CO. We are also grateful to our colleagues Subrato Chandra and Robin
Vieira for technical advice. Thanks to Wanda Dutton for report preparation.
Executive
Summary
The Flexible Roof Facility (FRF) is a test facility in Cocoa, Florida designed to evaluate five roofing systems at a time against a control roof with dark shingles. The intent of the testing is to evaluate how roofing systems impact summer residential cooling energy use and peak demand. In the summer of 2001, the following roofing systems were tested. See Figure E-1 for the test facility, the cell numbering is from left to right.
| Cell # | Description |
| 1 | Weathered white barrel tile with sealed attic |
| 2 | Double roof with radiant barrier, sealed attic and insulated roof deck |
| 3 | High reflectance brown metal shingle with vented attic |
| 4 | Terra cotta barrel tile with vented attic |
| 5 | Dark shingles with standard attic ventilation (Control Test Cell) |
| 6 | Weathered white metal with sealed attic |
Figure E-1. Flexible Roof Facility in summer 2001 configuration.
All had R-19 insulation installed on the attic floor except in the configuration with the double roof (Cell #2) which had R-19 of open cell foam sprayed onto the bottom of the roof decking. The measured thermal impacts include ceiling heat flux, unintended attic air leakage and duct heat gain. We also developed a new analysis method to estimate total cooling energy use impacts of different roofing systems considering the various influences.
The sealed attic double roof system (Cell #2) provided the coolest attic space of all systems tested (average maximum mid-attic temperature was 81.9oF), and therefore also the lowest estimated impact due to return air leakage and duct conduction heat gains. However, it also had the highest ceiling heat flux of all strategies tested, reducing its improvement over the standard dark shingle roof.
Sealing the white tile (Cell #1) and white metal (Cell #6) roofs' soffit vents this summer decreased their performance from the last two years in which they were vented, although some of the decrease was likely due to weathering. Both mid-attic temperatures and estimated total heat gain for the weathered white tile and white metal roof systems were comparable (20.6oF and 17.5oF lower than the control dark shingle for the white tile and white metal roofs respectively).
The highly reflective brown metal shingle roof (Cell #3) provided the coolest peak attic temperature of all cells without roof deck insulation. Its average maximum mid-attic temperature was 98.4oF (21.3oF lower than the control dark shingle cell). While the brown metal shingle roof's reflectance was somewhat lower than the weathered white tile and white metal roofs we observed evidence that the air space under the metal shingles provides additional effective insulation.
We also estimated the combined impact of ceiling heat flux, duct heat gain and unintended attic air leakage from the various roof constructions. All of the alternative constructions produced lower estimated cooling energy loads than the standard vented attic with dark shingles (Figure E-2).
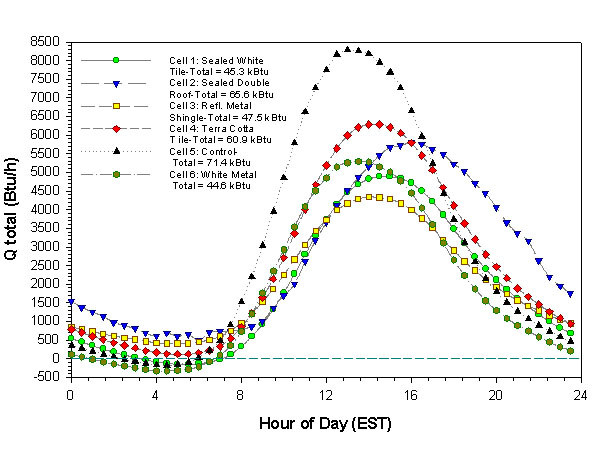
Figure E-2. Average summer day impact of roofing system on
typical cooling energy loads (Btu/hr).
Rank |
Description | Roof Cooling Load Reduction |
1 |
Weathered white metal with sealed attic: | 37.5% |
2 |
Weathered white barrel tile with sealed attic: | 36.6 |
3 |
High reflectance brown metal shingle with vented attic | 33.5 |
4 |
Terra cotta barrel tile with vented attic | 14.7 |
5 |
Double roof with sealed attic | 8.1 |
The
relative reductions are consistent with the whole-house
testing recently completed for FPL in Ft. Myers (Parker
et al., 2001). This testing showed white metal roofing
having the largest reductions, followed by white tile
with terra cotta roofs and finally sealed attic construction.
Background
Improving attic thermal performance is fundamental to controlling residential cooling loads in hot climates. Research shows that the influence of attics on space cooling is not only due to the change in ceiling heat flux, but often due to the conditions within the attic itself and their influence on heat gain to duct systems and on air infiltration into the building. Figure 1 illustrates the fundamental thermal processes with a conventional vented attic.
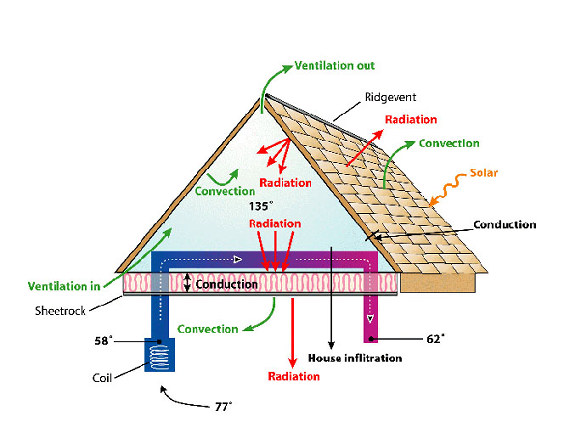
Figure
1. Vented attic thermal processes.
The importance of ceiling heat flux has long been recognized, with insulation a proven means of controlling excessive gains. However, when ducts are present in the attic, the magnitude of heat gain to the thermal distribution system under peak conditions can be much greater than the ceiling heat flux (Parker et al., 1993; Hageman and Modera, 1996).(1) This influence may be exacerbated by the location of the air handler within the attic space - a common practice in much of the southern US. The air handler is poorly insulated but has the greatest temperature difference at the evaporator of any location in the cooling system. It also has the greatest negative pressure just before the fan so that some leakage into the unit is inevitable. As evidence for this influence, a monitoring study of air conditioning energy use in 48 central Florida homes (Cummings, 1991) found that homes with the air handlers located in the attic used 30% more space cooling energy than those with air handlers located in garages or elsewhere.
Buildings research also shows that duct system supply air leakage can lead to negative pressures within the house interior when the air handler is operating. The negative pressures can then result in hot air from the attic being drawn down into the conditioned space through gaps around recessed light fixtures or other bypasses from the attic to the interior. Attic air is often also directly drawn into the return air stream through leakage pathways (see Figure 2). These phenomena are commonly encountered in slab on grade homes in Sunbelt states in the U.S. where the dominant infiltration leakage plane from the exterior is through the ceiling.
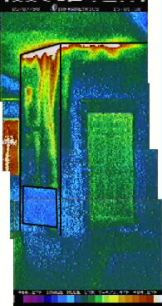
Figure 2. Thermograph of air being drawn
from
the attic to the air handler in a Florida house.
The
impact of duct heat transfer and air leakage from the attic
space shows that controlling attic air temperatures can
be equally important as controlling ceiling heat flux alone.
Consequently, in our assessment of the impact of different
roof constructions on cooling related performance, we considered
both ceiling flux and attic air temperature.
Test
Facility Description and Objectives
During the summer of 2001, tests were performed on six different residential plywood-decked roofing systems. The experiments were conducted at the flexible roof facility (FRF) located in Cocoa, Florida, ten miles (17 km) west of the Atlantic ocean on mainland Florida. The FRF is a 24 ft by 48 ft (7.3 x 14.6 m) frame building with its long axis oriented east-west (Figure 3). The roof and attic are partitioned to allow simultaneous testing of multiple roof configurations. The orientation provides a northern and southern exposure for the roofing materials under evaluation. The attic is sectioned into six individual 6 foot (1.8 m) wide test cells (detail A in Figure 3) spanning three 2 ft (0.6 m) trusses thermally separated by partition walls insulated to R-20 ft2-hr-oF/Btu (RSI-3.5 m2-K/W) using 3 inches (7.6 cm) of isocyanurate insulation. The partitions between the individual cells are also well sealed to prevent air flow cross-contamination. The gable roof has a 5/12 pitch (22.6o) and 3/4 inch (1.9 cm) plywood decking. On the attic floor, R-19 (RSI-3.3) unsurfaced batt insulation is installed between the trusses in all of the test bays (with the exception of Cell #2) in a consistent fashion. The attic is separated from the conditioned interior by 0.5 inch (1.3 cm) gypsum board. The interior of the FRF is a single open air conditioned space.
Figure 3. Flexible roofing facility layout and schematic.
The roof lends itself to easy reconfiguration with different roofing products and has been used in the past to examine different levels of ventilation and installation configurations for tile roofing (Beal and Chandra, 1995). Testing has also compared reflective roofing, radiant barriers and sealed attic construction (Parker and Sherwin, 1998). Appendix B lists the test cell configurations over recent years. A black asphalt shingle roof on one of the test cells serves as a reference for other roofing types.
Our tests in 2001 addressed the following questions:
1) What is the performance (ceiling flux and attic air temperatures) of a standard black asphalt shingle roof with 1:300 ventilation (the control cell)?
2) How does a weathered white barrel tile roof without ventilation compare to the control cell?
3) How does a higher IR reflectance brown metal shingle roof function relative to the lower reflectance one installed the previous summer?
4) How does a direct nailed red barrel tile roof perform relative to other roof types?
5) How does an innovative double roof construction with an insulated roof deck and no attic ventilation perform compared with other types?
How
does a weathered white standing seam metal roof perform
relative to white tile and the other types?
Test
Configuration and Instrumentation
To answer the above questions, we configured the test cells in the following fashion:
Cell #1: Direct nailed white concrete barrel tile (weathered); unvented attic
Cell #2: Black asphalt shingles with vented double roof deck with radiant barrier and 6" foam insulation on underside of bottom roof deck; unvented attic
Cell #3: IR reflective brown metal shingles; 1:300 soffit and ridge ventilation
Cell #4: Direct nailed terra cotta concrete barrel tile; 1:300 ventilation
Cell #5: Black asphalt shingles; 1:300 soffit and ridge ventilation (control cell)
Cell #6: White standing seam metal (weathered); unvented attic.
The final appearance of the facility as configured for testing is shown in Figure 4. All roofing materials were installed in a conventional manner, and according to manufacturer's specifications and current practice in the Central Florida area. Although raised counter-batten type tile installations which promote ventilation have been shown to be thermally beneficial (see Beal and Chandra, 1995), current practice, with its focus on lower first costs, dictated a direct nailed application method for the tile roofs. Perforated vinyl soffit vents were used, and ridge vents for the two asphalt shingled cells were the "shingle vent" type with foam mesh or rigid plastic over the ridge outlet covered by shingles.
Standard unvented roof caps were utilized for the two tile roof sections as commonly used in south Florida, and a manufacturer supplied ridge vent was used with the standing seam metal roof. In applicable test cells the free ventilation area was first estimated based on dimensional measurements and then verified by a fan pressurization test of the attic to estimate the equivalent leakage area, allowing for a consistent comparison. Three cells (#1, 2 and 6) were sealed for the duration of the summer testing.
Samples of the new, unexposed roofing materials were sent to a laboratory to establish their integrated solar reflectance using ASTM Test Method E-903 (1996) and long wave emittance using ASTM E-408. Table 1 shows the laboratory reported values prior to weathering ("initial") and weathered values from an invented pyronometer test ("2001").
Table
1. Tested Roofing Material Solar Reflectances and
Emittances*
| Sample | Solar Reflectance Initial (2001)* | Low-wave emmittance Initial |
| Cell #1: White barrel tile | 75.4% (38%) | 0.88 |
| Cell #2: Black shingle | 2.7% (12%) | 0.90 |
| Cell #3: IR selective metal shingle | (24%) | NA |
| Cell #4: Terra cotta barrel tile | 19.5% (10%) | 0.91 |
| Cell #5: Black shingle | 2.7% (10%) | 0.90 |
| Cell #6: White metal | 67.6% (46%) | 0.83 |
* Initial values are for new, unexposed products. For 2001 values, the white samples are four years old, and the shingle and red tile have been exposed for ten years. Values in parentheses are field tested using inverted pyranometer procedure. Other values are laboratory tested values using ASTM E-903 and ASTM E-408.
Instrumentation for the project was extensive so the data can eventually validate a detailed attic simulation model. A number of temperature measurements using type-T thermocouples were made. Air temperature measurements were shielded from the influence of radiation. The temperature measurements included:
- Exterior surface of the roof and underlayment
- Decking underside
- Attic air at several heights within the attic
- Soffit inlet air and ridge vent exit air
- Insulation top surface
- Conditioned
interior ceiling
The following meteorological data were taken:
- Solar insolation
- Aspirated ambient air temperature
- Ambient relative humidity
- Wind speed at a 33 ft (10 m) height
- Rainfall
(tipping bucket)
All of the test cells were operational by June 7, 2001, at which point data collection began. The test cells were maintained in an unaltered state through the middle of September with continuous data collection. However, due to unforeseeable instrumentation problems several weeks of data were lost.(2)
Results
Attic Air Temperature
The average day mid-attic air temperature profiles are shown in Figure 5. The profiles show the impact of the various roofing options in reducing summer cooling energy use associated with attic duct heat gains and loads from unintended air leakage coming from the attic zone.
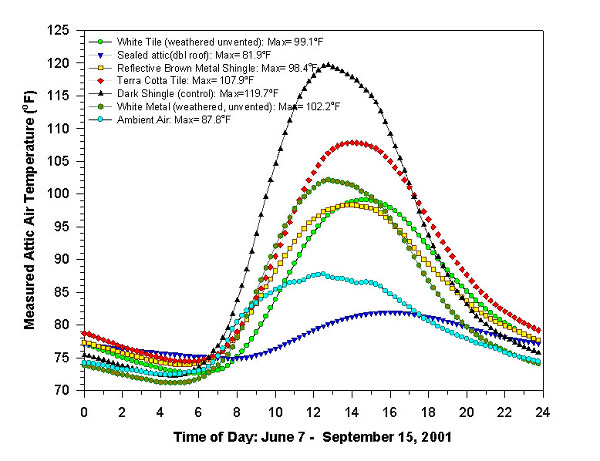
Figure 5. Measured average mid-attic air temperatures over the 2001 summer period.
The statistics for the average, minimum and maximum attic air temperatures over the entire summer are summarized in Table 2. These results show that the sealed attic with the double roof provides the lowest overall attic temperatures (78.1oF) and hence lowest attic duct system heat gains and impact from return air leakage from the attic zone. The next most productive roof combination in this regard is Cell #6 with the sealed, weathered white metal roof (83.5oF). Very similar to this performance is Cell #1 with the weathered white tile roof without ventilation (83.8oF). Next best in performance is Cell #3 with the IR reflective metal shingles and vented attic at 84.4oF. The ventilated terra cotta tile roof (Cell #4) averaging 88.1oF, is only marginally better than the standard attic at 90.4oF.
Table
2. FRF: Measured Attic Air Temperatures (oF)
June
7 - September 15, 2001
| Mean | Standard | Minimum | Maximum | ||
| Ambient Air | 79.3 | 6.76 | 66.1 | 95.6 | |
| Cell #1 | White barrel tile (sealed vents) | 83.8 | 11.27 | 65.9 | 111.2 |
| Cell #2 | Double roof deck (sealed attic) | 78.1 | 3.11 | 72.6 | 85.4 |
| Cell #3 | High reflectance brown metal shingle | 84.4 | 10.56 | 67.3 | 111.6 |
| Cell #4 | Terra cotta barrel tile | 88.1 | 14.43 | 67.3 | 125.7 |
| Cell #5 | Black shingle (control cell) | 90.4 | 20.22 | 64.9 | 143.4 |
| Cell #6 | White st. sm. metal (sealed vents) | 83.5 | 13.00 | 63.8 | 115.5 |
A rank order impact listing from best to worst summarizes these findings. Note that this ranking doesn't account for ceiling fluxes.
Rank Order on Reducing Cooling Season Impact to Duct System Heat Gains and Air Leakage (best to worst; note that the 2nd, 3rd, and 4th places in this list are very close in impact)
1. Sealed attic with double roof and insulated roof deck
2. Sealed attic with weathered white metal
3. Sealed attic with weathered white barrel tile
4. High reflectance brown metal shingles with vented attic
5. Terra cotta barrel tile with vented attic
6. Black asphalt shingles with ventilated attic
Maximum Attic Air Temperatures
A comparison of the average maximum attic air temperature for each cell against the average maximum ambient air temperature along with the corresponding temperature difference is shown in Table 3 below for the period between June 7 and September 15, 2001. These results show the success of the various roofing options in controlling duct heat gains and loads from unintended air leakage under averaged peak conditions for the period.
Table 3. FRF Average Maximum Attic and Ambient Air Temperatures.
| Average
Max. Attic |
Average
Max. Ambient |
Difference | ||
| Cell #1 | White barrel tile (sealed vents) | 99.1oF | 87.8oF | + 11.3oF |
| Cell #2 | Double roof deck (sealed attic) | 81.9oF | 87.8oF | - 5.8oF |
| Cell #3 | High reflectance brown metal shingle | 98.4oF | 87.8oF | + 10.6oF |
| Cell #4 | Terra cotta barrel tile | 107.9oF | 87.8oF | + 20.1oF |
| Cell #5 | Black shingle (control cell) | 119.7oF | 87.8oF | + 32.0oF |
| Cell #6 | White st. sm. metal (sealed vents) | 102.2oF | 87.8oF | + 14.4oF |
Rank Order on Reducing Peak Impact to Duct System Heat Gains and Air Leakage (best to worst; note that the 2nd and 3rd places in this list are very close in impact)
1. Sealed attic with double roof and insulated roof deck
2. High reflectance metal tiles with vented attic
3. Sealed attic with weathered white tile
4. Sealed attic with weathered white metal
5. Terra cotta S-tiles with vented attic
6. Black asphalt shingles with ventilated attic
Note that Cell #2 with the sealed attic and insulation on the underside of the roof decking cannot be directly compared with the other cells as the others do not have roof deck insulation but instead have insulation on top of the ceiling. Comparing the 2001 summer results with 1999 and 2000 Cell #2 results (sealed attic without double roof and RB) however, shows that the double roof/RB combination average maximum mid-attic temperature difference from ambient was 4.7oF lower than the same sealed attic without the double roof. Its maximum mid-attic temperature of 81.9oF was also 6.3oF lower than the averaged 1999 and 2000 results.The highly reflective brown metal shingle (Cell #3) provided the coolest attic of the cells without roof deck insulation. The average maximum mid-attic temperature in this case was 98.4oF, or 10.6oF higher than ambient. In 2000, the brown (non-highly reflective) metal shingle that was on the same cell had an average maximum attic temperature 13.5oF higher than ambient, while in 1999, a white highly reflective metal shingle on the same cell had an average maximum attic temperature 3.8oF higher than ambient.The white barrel tile (Cell #1) and white standing seam metal (Cell #6) roofs were not vented during the 2001 summer test period. Note also that these roofs were 5 years old this summer and their surfaces are somewhat more weathered than was the case during the 1999 and 2000 test periods. The average maximum attic temperature this summer for the white barrel tile with unvented attic was 99.1oF, or 11.3oF higher than ambient, compared with 4.8oF and 6.1oF higher than ambient respectively for 1999 and 2000 when the attic was vented. For the white metal seam roof with unvented attic, the average maximum attic temperature this summer was 14.4oF higher than ambient, compared with 9.7oF and 9.1oF higher than ambient for 1999 and 2000 respectively when the attic was vented. Ceiling Heat Flux Table 4 shows the statistics for ceiling heat fluxes over the 2001 summer period, and Figure 6 shows the ceiling flux data for the same period graphically. The uninsulated ceiling of the double roof with sealed attic (Cell #2) has a peak heat flux similar to that of the control (Cell #5), although with a significant time lag of over 3 hours. The mean heat flux for the double roof is 1.04 Btu/ft2/hr, or 40% higher than the control. Also note from Figure 6 that the double roof has the highest nighttime flux values of all the cells. The highly reflective brown metal shingle roof (Cell #3) has the lowest peak ceiling heat flux at 1.36 Btu/ft2/hr, and also has a relatively low mean flux of 0.44 Btu/ft2/hr, which is just slightly higher than the unvented weathered white tile and white metal roofs at 0.40 Btu/ft2/hr and 0.39 Btu/ft2/hr respectively. The unvented white metal roof shows the lowest overall average heat flux and thus the lowest indicated ceiling influence on cooling for the overall period.
Table
4. FRF Measured Ceiling Heat Fluxes (Btu/ft2/hr)
June 7 - September 15, 2001
| Cell # | Mean | Stddev | Min | Max | Flux Change Relative to Cell #5 | |
| Flux 1 | White barrel tile (sealed vents) | 0.40 | 0.55 | -0.45 | 1.71 | -45.9% |
| Flux 2 | Double roof deck (sealed attic) | 1.04 | 0.95 | -1.56 | 3.56 | +40.5% |
| Flux 3 | High reflectance brown metal shingle | 0.44 | 0.35 | -0.14 | 1.36 | -40.5% |
| Flux 4 | Terra cotta barrel tile | 0.60 | 0.67 | -0.35 | 2.41 | -18.9% |
| Flux 5 | Black shingle (control cell) | 0.74 | 1.00 | -0.49 | 3.48 | Ref |
| Flux 6 | White st. sm. metal (sealed vents) | 0.39 | 0.64 | -0.56 | 1.99 | -47.3% |
Rank Order on Reducing Cooling Season Ceiling Heat Flux (best to worst, note that the 1st, 2nd, and 3rd places in this list are very close in impact)
1. Weathered white metal with sealed attic
2. Weathered white barrel tile with sealed attic
3. High reflectance metal shingles with vented attic
4. Terra cotta barrel tiles with vented attic
5. Black asphalt shingles with ventilated attic
6. Sealed attic with double roof and insulated roof deck
Estimation of Overall Impact of Roofing System
As described earlier in the report, the impact of a roofing system on cooling energy use in southern climates is often made up of three elements:
- Ceiling heat flux to the interior over time Air unintentionally drawn from the attic into conditioned space
- Heat
gain to the duct system located in the attic space
The heat flux through the ceiling impacts the interior temperature and hence the thermostat which then calls for mechanical cooling. Thus, the heat flux impacts cooling energy use at all hours and affects the demand for air conditioning.The other two influences, air leakage drawn from the attic into the conditioned space and heat gain to the duct system primarily occur only when the cooling system operates. Thus, the impact depends on the air conditioner runtime in a particular time interval. To obtain the average cooling system runtime, we used a large set of residential cooling energy use data which has only recently been made public domain. This data comes form 171 homes monitored in the Central Florida area where the 15-minute air conditioner power was measured for over a year (Parker, 2002). For each site, the maximum demand during summer was also recorded to determine the maximum cooling system power. Thus, it is possible to determine the diversified runtime fraction by dividing the average air conditioner system power by its maximum demand. This calculation was made by averaging the air conditioner and air handler power for all sites and dividing by the average maximum summer demand, which was 3.96 kW. Figure 7 shows the maximum average cooling system runtime is approximately 55% at 4 PM and is at its minimum of 15% at 6 AM. It is important to note that this is an average summer day as determined by evaluating all data from June - September inclusive. It does not represent an extreme summer day condition. With the runtime fraction determined for an average home in Central Florida for the summer, it is then possible to estimate the impact of duct heat gain and attic return air leakage with some working assumptions.
over an average summer day in a large sample of Central Florida homes.
To estimate the overall impact of each roofing system, we first assume a typical single-story home with 2,000 square feet of conditioned floor area. Then three equations are defined to estimate the individual impacts of duct heat gain (Qduct), attic air leakage to conditioned space (Qleak) and ceiling heat flux (Qceiling).
For duct gains, heat transfer is estimated to be:
Qduct = cooling
load related to duct gains (Btu/hr)
Areaduct = 25% of conditioned floor
area or 500 ft2 (Gu et al., 1996, see Appendix
G)
Rduct = R-6
flex duct
Tattic = attic
air temperature measured in FRF test cells
Tduct, air = typical air temperature leaving
evaporator (58oF)
RTF = typical
air conditioner runtime fraction as determined from data
in Figure 7
Generally, the duct heat gains will favor the double roof sealed attic construction which results in lower duct temperatures. For attic air leakage to conditioned space, the estimated heat transfer is:
Qleak = Flow * PctLeak* PctAttic * 1.08 * (Tattic - Tinterior) * RTF
Where:Qleak = cooling load related
to unintentional air leakage to conditioned space from
attic (Btu/hr)
Flow = air handler flow; 4-ton system for 2000 ft2 home,
400 cfm/ton = 1600 cfm
PctLeak = duct leakage assumed as 10% of air handler
flow
1.08 = air specific heat density product per CFM
(Btu/hr CFM oF)
PctAttic = 33% of duct leakage is assumed to be
leakage from the attic (see Figure 1)
Tattic = attic air temperature measured
in FRF test cells
Tinterior = interior cooling temperature
(75oF)
RTF = typical air conditioner runtime fraction
as determined from data in Figure 7
Heat flux is proportional to the house ceiling area and is
estimated as:
Qceiling = Areaceiling * Qflux
Where:
Areaceiling = 2,000
ft2
Qflux = measured
ceiling heat flux from FRF data
So the total heat gain impact of a roofing systems is estimated to be:
Qtot = Qduct + Qleak + Qceiling
Figure 8 shows the combined roofing system heat gain estimated for 2,000 square foot houses with each of the six roofing systems tested this summer. Figure 9 breaks down the Qduct, Qleak and Qceiling components of Figure 8 for the Cell #5 control roof to show the relative contribution of each component. Note that the combined estimated duct leak gain and duct conduction gain is approximately equal to the ceiling flux gain.
Figure
8. Estimated combined impact of duct heat gain, air leakage
from the attic to conditioned space,
and ceiling heat flux
on space cooling needs on an average summer day in a 2,000ft2 home.
Figure 9. Components of estimated daily heat gain due to duct heat gain, air leakage from the attic to the conditioned space and ceiling heat flux for Cell #5.
Table 5 shows the relative impact on space cooling and performance relative to the control (Cell #5). All of the alternative test cells do better than the standard reference cell. The estimation shows that the weathered white metal roof without ventilation (Cell #6) does best, followed by the weathered white tile roof without ventilation (Cell #1) and then the high reflectance metal shingle roof (Cell #3). The terra cotta tile roof with a ventilated attic provides a reduction of about half that of the previous types. The sealed attic with the double roof provides the lowest reduction. The is primarily a result of the much greater measured heat flux across the uninsulated ceiling.
Table 5. Combined Ceiling Heat Flux, Duct Heat Gain and Attic Duct Leakage Impact in a 2000 sqft home.
| Case | Average Daily kBtu from Roof/Attic | Percent Heat Gain Difference Relative to Control | |
| Cell #1 | White barrel tile (sealed vents) | 45.3 | -36.6% |
| Cell #2 | Double roof deck (sealed attic) | 65.6 | -8.1% |
| Cell #3 | High reflectance brown metal shingle | 47.5 | -33.5% |
| Cell #4 | Terra cotta barrel tile | 60.9 | -14.7% |
| Cell #5 | Black shingle (control cell) | 71.4 | 0.0% |
| Cell #6 | White st. sm. metal (sealed vents) | 44.6 | -37.5% |
Conclusions
The 2001 FRF test results suggest indicators of the relative thermal performance of various roofing systems under typical Florida summer conditions. Within the body of the report, we describe the various relative impacts to ceiling heat flux, unintended attic air leakage and duct heat gain. Also, while an estimate, we believe that our newly developed extrapolated heat gain analyses provides a useful means of estimating total cooling energy benefits of different roofing systems and a tool to help identify savings opportunities.In this year's tests, the sealed attic double roof system (Cell #2) provided the coolest attic space of all systems tested (average maximum mid-attic temperature was 81.9oF, with the next lowest being 16.5oF higher), and therefore also the lowest estimated duct leakage and duct conduction heat gains. However, it also had the highest ceiling heat flux of all strategies tested, reducing its improvement over the standard dark shingle roof in the control home. Note also that since this double roof configuration provided significantly cooler attic temperatures than the standard sealed attic tested during the previous two summers, higher total heat gains should be anticipated from standard sealed attics. Thus, this system may represent an optimal system for sealed attics which use dark roofing. Future research may examine a combination of ceiling floor insulation with the concept to control ceiling heat flux.
Sealing the white metal (Cell #1) and white tile (Cell #6) roofs' soffit vents this summer decreased their performance from the last two years that they were vented, although some of the decrease was likely due to weathering. Both mid-attic temperatures and estimated total heat gain for the weathered white tile and white metal roof systems were comparable. The white tile roof provided slightly lower average maximum mid-attic temperatures (20.6oF and 17.5oF lower than the control dark shingle for the white tile and white metal roofs respectively).
At an average maximum mid-attic temperature of 98.4oF (21.3oF lower than the control dark shingle cell), the highly reflective brown metal shingle roof (Cell #3) provided the coolest peak attic temperature of all cells without roof deck insulation. While the brown metal shingle roof's reflectance was somewhat lower than the weathered white tile and white metal roofs', it is likely that the air space under the metal shingles provides additional effective insulation. Both of these characteristics probably come into play to help it achieve lower peak attic temperatures, while the additional insulating effect likely causes its slightly higher nighttime attic temperatures.
We also estimated the combined impact of ceiling heat flux, duct heat gain and air being unintentionally drawn from the attic into conditioned space for the various roof constructions. These estimates indicate that all of the tested roof configurations yield lower heat gains during the summer cooling season than the control roof which has dark shingles with R-19 ceiling insulation and 1:300 ventilation. One emerging fact from the recent testing is that nighttime attic temperature and reverse ceiling heat flux have a significant impact on the total daily heat gain, and therefore constructions that produce lower attic evening temperatures benefit from these effects. The rank order is shown below and in Figure 10 with the percentage reduction of roof/attic related heat gain (not to be confused with cooling energy savings).(3)
- Weathered white metal with sealed attic: 37.5%Weathered white barrel tile with sealed attic: 36.6%High reflectance brown metal shingle with vented attic: 33.5%Terra cotta barrel tile with vented attic: 14.7%
- Double
roof with sealed attic: 8.1%
Figure
10. Percentage savings in daily total roof/attic related
heat gain.
The rank order of the reductions are consistent with the whole-house roof testing which was recently completed for FPL in Ft. Myers (Parker et al., 2001) which showed white metal roofing as having the largest reductions, followed by white tile with terra cotta roofs and finally sealed attic construction.
In future reports we plan to continue providing the extrapolated total heat gain estimates. These estimates should provide an effective means of comparing various tested roofing systems. As time permits, we also may examine previous years' data from the FRF in a like fashion.
Appendix A - Long Term Weather Data at the Flexible Roof Facility
For the analysis, we examined how the long term summer weather has varied at the Flexible Roof Facility from 1997 - 2001. The purpose was to create a method that can be used to normalize data on attic temperatures and ceiling heat fluxes that will allow comparison over various roofing systems from one year to the next.
This was done by examining how temperatures and heat fluxes varied from one year to the next when evaluated from June - September. The results, which are shown below, evidence little variation from one year to the next, both for ambient air temperature and in Cell #5, the reference cell, over the last five years. Ceiling heat fluxes vary a little more, but not that much.
| ------------ Cell #5 ------------- | |||||
| Year | Avg. Ambient(F) | Avg. Attic(F) | Max Attic (F) | Avg. FluxBtu/ft2/hr | Max FluxBtu/ft2/hr |
| 97 | 79.1 | 90.8 | 141.9 | 0.73 | 3.34 |
| 98 | 81.7 | 92.6 | 142.3 | 0.84 | 3.39 |
| 99 | 79.9 | 90.9 | 142.3 | 0.77 | 3.41 |
| 00 | 80.1 | 91.2 | 141.2 | 0.78 | 3.36 |
| 01 | 79.3 | 90.4 | 143.4 | 0.74 | 3.48 |
The year 1998 stands out as an outlier, but that is expected (record breaking hot summer). Our working idea would be to ratio temperature and flux data to 1997 for each quantity to normalize for summer weather in future analysis of data from the FRF when evaluated over successive summer seasons.
Appendix B - FRF Test Cell Summer Configuration History
FRF
Test Cell Summer Configuration History
(Bold =
changed cell in that year)
1997
1 White barrel tile, standard ventilation
2 Dark shingles with RBS, 1:150 ventilation
3 Dark shingles with RBS, 1:300 ventilation
4 Red terra cotta tile, standard ventilation
5 Dark shingles with standard ventilation (Control)
6 White standing seam metal with standard ventilation
1998
1 White tile, standard ventilation
2 Dark shingles, sealed attic with R-19 Icynene deck insulation
3 Dark shingles with RBS, 1:300 ventilation
4 Red terra cotta tile, standard ventilation
5 Dark shingles with standard ventilation (Control)
6 White standing seam metal with standard ventilation
1999
1 White tile, standard ventilation
2 Dark shingles, sealed attic with R-19 Icynene deck insulation
3 White metal shingles with standard ventilation
4 Red terra cotta tile, standard ventilation
5 Dark shingles with standard ventilation (Control)
6 White standing seam metal with standard ventilation
2000
1 White tile, standard ventilation
2 Dark shingles, sealed attic with R-19 Icynene deck insulation
3 Dark brown metal shingles with standard ventilation
4 Red terra cotta tile, standard ventilation
5 Dark shingles with standard ventilation (Control)
6 White metal standing seam roof with standard ventilation
2001
1 White barrel tile, unvented
2 Dark shingles, double roof, sealed attic with R-19 Icynene deck insulation
3 IR reflective brown metal shingles with standard ventilation
4 Red terra cotta tile, standard ventilation
5 Dark shingles with standard ventilation (Control)
6 White metal standing seam roof, unvented
References
Beal, D. and S. Chandra, 1995. "The Measured Summer Performance of Tile Roof Systems and Attic Ventilation Strategies in Hot Humid Climates," Thermal Performance of the Exterior Envelopes of Buildings VI, U.S. DOE/ORNL/BTEC, December 4-8, 1995, Clearwater, FL.
Gu, L. et. al. Comparison of Duct System Computer Models That Could Provide Input to the Thermal Distribution Standard Method of Test (SPC 152P), FSEC-CR-929-96, Appendix G; Table G-2, Florida Solar Energy Center, Cocoa, FL.
Jump, D.A. , I.S. Walker and M.P. Modera, 1996. "Measurements of Efficiency and Duct Retrofit Effectiveness in Residential Forced Air Distribution Systems," Proceedings of the ACEEE 1996 Summer Study on Energy Efficiency in Buildings, Vol. 1, p. 147, American Council for an Energy Efficient Economy, Washington, DC.
Parker, D.S. and J.R. Sherwin, 1998. "Comparative Summer Attic Thermal Performance of Six Roof Constructions," ASHRAE Transactions, American Society of Heating, Refrigerating and Air Conditioning Engineers, June 20-24, 1998, Toronto, CA.
Parker, D.S. , J.K. Sonne, J.R. Sherwin and N. Moyer, 2000. "Comparative Evaluation of the Impact of Roofing Systems on Residential Cooling Energy Demand in Florida," FSEC-CR-1220-00, Florida Solar Energy Center, Cocoa, FL.
Parker, D.S. , 2002. "Research Highlights from a Large Scale Monitoring Study in a Hot Climate," International Symposium on Highly Efficient Use of Energy and Reduction of its Environmental Impact, Japan Society for the Promotion of Science, January 22-23, 2002.
1. A simple calculation illustrates this fact Assume a 2,000 square foot ceiling with R-30 attic insulation. Supply ducts in most residences typically comprise a combined area of ~25% of the groww floor area (See Gu et al. 1996 and Jump and Modera 1996), but are only insulated to between R-4 to R-6. With the peak attic temperature at 130oF, and 78o F maintained inside the house, a UA (delta)T calculation shows a ceiling heat gain of 3,500 Btu/hr. With R-5 ducts in the attic and a 57oF air conditioner supply temperature, the heat gain to the duct system is 7,300 Btu/hr if the cooling system ran the full hour under design conditions - more than twice the ceiling flux.
2. Due to a datalooger failure and related problems, data from June 22nd and 23rd, July 3rd to July 26th, and August 6th is not included in these results.
3. Since
the roof/attic ceiling heat flux, duct heat transfer
and duct leakage likely comprise about a third of the
total home cooling demand, the above values can be so
modified to approximately overall impact.
Prepared
for:
Department of Energy
Office of Building Technology
State and Community Programs
George James, Program Manager
Building America, Washington, DC
Keith Bennett, Project Officer
DOE Golden, CO
© 2007-2014 University of Central Florida. The Florida Solar Energy Center (FSEC)
is a research institute of the
University of Central Florida.
For more information about FSEC, please contact us or learn more about us.
Find us on Facebook!